## I. INTRODUCTION
There is a vast amount of studies and literature on the concepts of Value Chain and Competitive Strategy, which were originally proposed by Michael Porter [1]. Since then, these two concepts have supported the development of organizations in their quest to enhance their competitiveness in the markets. The concept of value in products has gained significant importance in ensuring their success.
Today, discussing value in products or services is a term related to customer perception. It is a term that is subject to how the customer perceives the attributes of the product or service. In other words, value has a significant subjective component, as it depends on multiple factors for evaluation by the end consumer. Nevertheless, organizations are obligated to continue creating value in their processes that integrate the Value Chain to remain competitive in the market.
The use of Value-Generating Variables, as described here, aims to quantify how the links in an organization's Value Chain create and add value to their products or services. These Value Generating Variables facilitate the way in which value is transferred from one link to another within the organization's own chain, thereby creating and sustaining the competitive advantages that allow the organization to continue succeeding in the market.
By identifying and defining the Value-Generating Variables (VGV) for each link in the Value Chain, the specific characteristics of the link are established, through which the link itself develops the value added to the product. This is because the VGVs are defined by the members of the link themselves.
Systems Theory [2] states that any system, such as the Value Chain, is made up of several subsystems, and in the case of the Value Chain, these subsystems are called value-creating links. Each link independently conducts activities that create and contribute value to the product. To carry out value-creating activities within the link, personnel must follow methods, instructions, and...
Procedure and reliance on the infrastructure and technology available within the link. The creation of value also implies the consumption of resources.
Each link delivers or transfers value to the next link or links that make up the chain. This transfer of value is received by the following links, which in turn add value to the product and pass it on to the subsequent links. This process repeats until the end of the chain, where the consumer acquires the product.
With the exchange or transfer of value in the chain, interrelationships are formed at the junctions between the links. Each link is a subsystem that affects all other subsystems it is connected to.
At the junctions between links, a series of interrelationships is created in the creation of value, and this is where the VGV of each link connects. These connections between the VGV of each link allow the creation and transfer of value to be more efficient.
VGVs are classified according to their focus on value creation, including VGVs that create factors of Efficiency, Quality, Innovation, and/or Customer Satisfaction Capability [3]. In value creation, each VGV can support improved efficiency and thereby contribute value, or enhance innovation and also contribute value. Thus, we can establish how each VGV is focused on these four factors or only some of them. These four factor classifications determine the competitive advantage to which the VGV is oriented in value creation, and consequently, the competitive strategy that the VGV develops within the organization's Strategic Direction. The concepts of Strategy and Competitive Advantage are based on those presented by Michael Porter [1] and the authors Luis Ángel Guerras Martin and José Emilio Navas López [3].
The methodology is based on these concepts of strategy and competitive advantage to classify and diagnose the vocation of the VGV chains in the links. The methodology also utilizes existing tools such as Incidence Matrices, Forgotten Effects, Fuzzy Numbers or Fuzzy Logic, and the Expertons Method.
By identifying the value chain generated by the VGVs in the organization and classifying it from the perspective of competitive strategy, we can establish which strategic chain(s) the organization follows to create value.
The main contribution of using VGVs in the diagnostic method is the integration of factors that enable the evaluation of value creation and transfer by the structure. This, in turn, allows the application of each of the tools and how they combine to conduct the evaluation and diagnosis.
This text describes each step and phase of the methodological process, grounding its practical application with an example from an organization operating in the Food Industry, which we will refer to as "The Company."
The article by Busquets, Echeverria Villagómez (2018) presents the results of a study on the impacts of Metrology in the value chain of the Automotive Industry through the application of a methodological model that combines several recognized tools for the evaluation and diagnosis of complex systems, as mentioned earlier.
The tools included in the methodology for the diagnosis and evaluation of the value chain, as described by Busquets Efren (2021), are as follows:
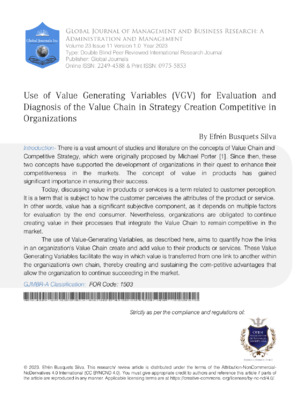
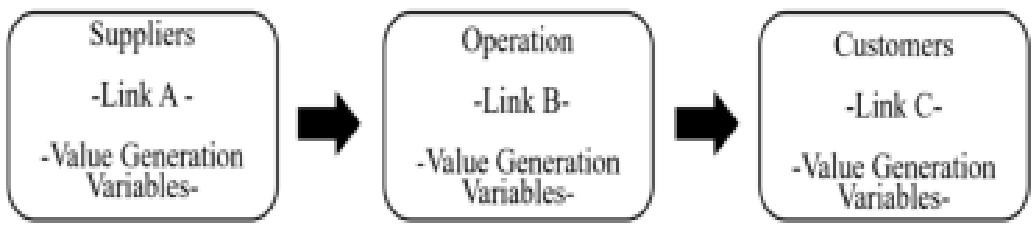
1. Value Chain: Michael Porter [1] developed this diagnostic tool. The value chain model represents how organizations integrate the value of their products and services from a systemic perspective.
2. Incidence Matrix: It is a graphical representation of the connections or interrelationships that one system has on another, also recognized as a tool for modeling or graphing the interrelationships between the variables of one system on another.
Michael Porter Chain Value [1]:
3. Forgotten Effects: The authors A. Kaufmann, J.G. Aluja [4] [5] [6] developed a method to discover some effects that have not been considered during decision-making. This concept of unidentified or forgotten effects is based on an idea by the economist Jean Furastie, but it is A. Kaufmann, J.G. Aluja [4] who developed the mathematical method based on incidence matrices or the PCM (participative causal matrix) model.
4. Fuzzy Numbers: Fuzzy Mathematics, Fuzzy Numbers, Fuzzy Logic are terms associated with Lotfi A. Zadeh, first known in 1965 in his work titled "Fuzzy Sets." Today, its primary use is in the development of models for the analysis and study of complex systems in general. Fuzzy Logic is a formal mathematical approach to modeling complex systems. The applications of fuzzy logic or fuzzy mathematics have grown significantly over the last two decades. The methodology's flexibility, tolerance for imprecision, and ability to model nonlinear problems make it ideal for developing complex system models.
5. Strategy and Competitive Advantage: In the section on Strategies and Competitive Advantages, Michael Porter [1] and the authors Luis Ángel Guerras Martin and José Emilio Navas López [3] are also included. These concepts are part of the theories of Strategic Management and the study of organizations' competition in the markets.
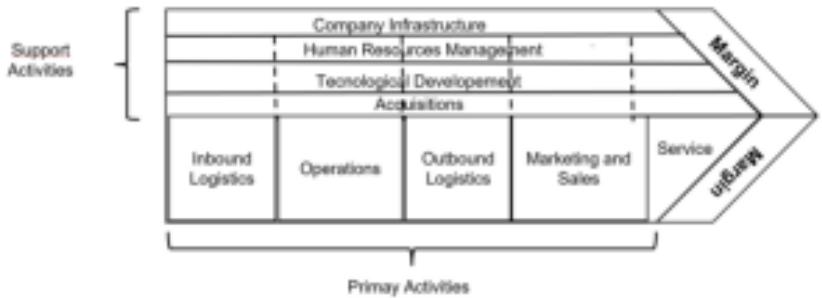 Figure 1: Chain Value
## II. BASE MODEL
Currently, the concept of the value chain is widely accepted as the foundation for identifying the activities that add the most value to a product or service [12]. The development of activities for the manufacturing or creation of a product or service occurs in such a way that with the execution of each activity, the product acquires and increases its value, and this is where the value chain is reflected [13]. The operations or activities carried out by the organization are considered links in the chain; these links operate in close interaction when building or manufacturing the product or service.
Each link adds value to a greater or lesser extent. The value of each link is one of the chain's objectives, and the goal is to have high quality products with a fair price at the end of the chain that customers or buyers are willing to acquire.
### a) Value Chain Generator
From the above and with a systemic approach, this study proposes to establish a higher level of analysis of the Value Chain by identifying the variables that generate value within the activities that make up the chain.
Analyzing the value chain at the level of value-generating activities makes it difficult to identify the possible causes of value creation within the chain itself. That's why this work proposes to detail the variables that each activity or link uses to create value. These variables are called Value-Generating Variables (VGV) and are defined as the attributes, characteristics, and elements with which each link creates value when performing value creating activities as part of the Value Chain (Busquets, Echeverria Villagómez 2018).
The attributes and characteristics with which each link creates value can vary from link to link, as these characteristics can include technology, technological equipment, facilities and infrastructure, processes and procedures, knowledge, experience, capacity, as well as leadership, communication, and team integration. In other words, any characteristic with which the human team in the link supports itself to create value is referred to as Value Generating Variables (VGV) (Busquets, Echeverria Villagomez 2018) and may differ from one link to another.
VGVs will facilitate the analysis of the Value Chain within the study model, as each link by itself integrates a subsystem within the Value Chain system. VGVs are the components that make up the subsystems called links, and VGVs establish the characteristics of the links and also characterize how the value chain adds value to the product or service.
Potter's Value Chain model describes that links are interconnected through links (Potter, ---), as the links form a system of interdependent activities. Therefore, according to Potter, the links describe a relationship between the way one activity is carried out and the performance of another. In other words, the links describe the interrelationships created between the activities or links of the Value Chain. The way an activity is performed within the link in the study model is directly related to the VGV of the link when performing the activity, as the VGVs group the elements that the link uses to create value and add it to the product or service.
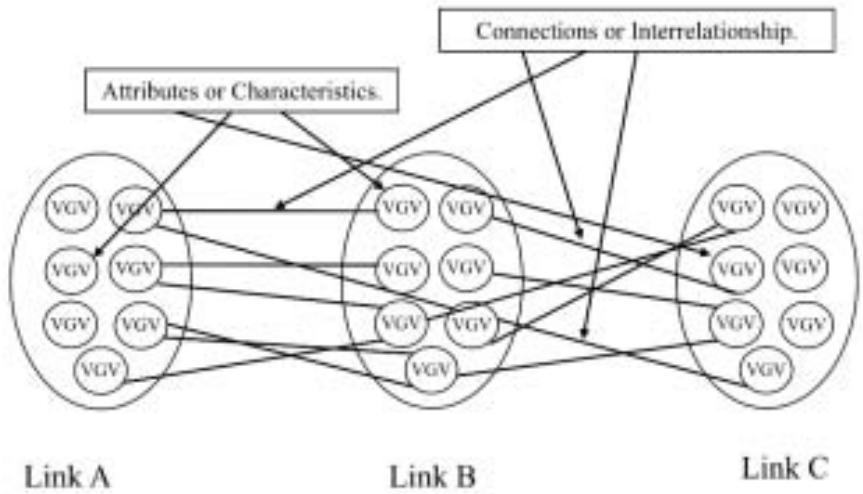
Value is created by the links in the chain or activities and is transferred through the chains themselves via links. The following figure shows the links that are created between the links. For example, link A transfers the value it created through the execution of its activities to link B. Now, with the inclusion of Value-Generating Variables (VGV), the links between the links are detailed by establishing the interrelationships that occur between the VGVs of each link.
Incidence of the VGV's link A on the VGV's link B Figure 2: Incidents and Links of the VGV for the Creation of Value
VGV determines the traits and characteristics of each link regarding value creation. In other words, the processes or activities involved in value creation have a set of attributes and characteristics that differentiate them in how they operate and develop their own processes. These traits allow synergy to be created among the activities, thereby facilitating harmony in the operation of the organization (Mintzberg, 1991).
## i. Study
This study was conducted in a small and medium-sized enterprise (SME) operating in the food industry (Cheese Production). The research involved interviews with the director and plant manager, as well as physical visits to the plant facilities to understand how their business operates and identify their value chain.
For the purposes of the study, the Value Chain was summarized into three Links: Suppliers, the Organization, and Customers.
The Links that are created between the Links are based on the interactions of the same VGVs of the
Figure 2 shows the basic model of how The Company generates value.
Links. These Links can explain or detail the entire network of interactions in the chain, from suppliers to customers, passing through operations.
Metrological value is generated from the initial operations in the chain and increases as it reaches the next link. In this way, each link must provide value or, in its absence, support the creation of value. Michael Porter [1] classifies activities that add value or attributes to a product or service as follows:
Direct activities are those that create value for consumers.
Indirect activities are activities that do not create value in the product but enable direct activities to be carried out consistently or uninterrupted.
Quality assurance refers to work related to ensuring the quality of other activities.
Porter's classification includes quality assurance activities, and it can be inferred that quality is an important attribute in value creation, and a product that the buyer perceives as having a higher degree of quality can therefore acquire greater value.
In the case of the company's work and the value chain, their activities are classified as Quality Assurance, but they play a significant role in the industry's main operations.
### b) Value-Generating Variables. (VGV)
The degree of value that each link contributes to the product depends on its position within the value chain and also depends on the value creation through the link's own characteristics. Since value is created by the link through a series of attributes possessed by the value generating link, these characteristics or attributes are identified as the value-generating variables of the links.
Each link has different value-generating variables, depending on its functions. These include characteristics of the human team that integrates the link, such as experience, skills, training, preparation, and infrastructure, as well as the characteristics of personnel integration, such as communication, teamwork, etc.
### c) Process and Method for Determining. VGV
To determine the value-generating variables of each link, the following process was established:
Through work sessions, interviews, or phone calls, 8 suppliers of various raw materials, 2 organization executives, and 7 customers (including 2 distributors, 2 restaurants, 1 taquería, 1 pizzeria, and 1 convenience store) were contacted.
With this information, the Value-Generating Variables (VGVs) were generated and classified into factors of Efficiency, Quality, Innovation, and Customer Satisfaction Capability.
This Value Chain is made up of 8 VGVs in the Suppliers link, 8 in the Organization link, and 12 VGVs in the Customers link.
The tables 1-3 display the VGVs of each link.
The variables for each value-generating link are as follows:
Table 1: Suppliers' Value Generated (VGV)
<table><tr><td>VGV1</td><td>Name</td><td>Description</td><td>Area</td></tr><tr><td>1</td><td>Products from raw material suppliers with high quality components and features.</td><td>Ability of suppliers to maintain standards, specifications and certifications of their products.</td><td>Raw material quality</td></tr><tr><td>2</td><td>Order to delivery logistics.</td><td>Be able to link raw material orders with the delivery times required by the little shepherd.</td><td>Logistics</td></tr><tr><td>3</td><td>Capacity and knowledge of the supplier to manage health standards, safety in their products.</td><td>Experience in sanitary manufacturing processes.</td><td>Healthcare quality</td></tr><tr><td>4</td><td>Current scheduled fulfillment capacity.</td><td>Supply guarantee due to supplier stock management, on-time deliveries and flexibility to current variations</td><td>Customer service, marketing</td></tr><tr><td>5</td><td>Supply potential for volume growth of up to 10 times more.</td><td>Supplier capacity for immediate production, storage and distribution of up to 10 times more.</td><td>Customer service, marketing</td></tr><tr><td>6</td><td>Supplier business administration.</td><td>Ability to negotiate sales, price, treatment and payment agreements convenient for both parties and the type of agricultural and industrial business.</td><td>Marketing, finance</td></tr><tr><td>7</td><td>Supplier's ability to understand customer needs.</td><td>alignment of actions to comply in volume, time and quality.</td><td>Marketing, production</td></tr><tr><td>8</td><td>Supplier commercial advice.</td><td>supplier recommendations on volumes and prices to maintain costs in the face of economic and dollar variations.</td><td>Marketing</td></tr></table>
Table 2: Operating Value Added (VGV)
<table><tr><th>VGV</th><th>Name</th><th>Description</th><th>Area</th></tr><tr><td>1</td><td>Ability to say what I need for raw materials and who will provide it.</td><td>They are the activities that allow me to define and select suppliers based on their quality of raw materials and delivery time.</td><td>Supplies</td></tr><tr><td>2</td><td>Effectiveness to coordinate a sales plan, with a production plan and raw materials.</td><td>It refers to being able to link orders with production times, the installed capacity of the processes.</td><td>Logistics</td></tr><tr><td>3</td><td>Capacity and knowledge of staff in the production processes.</td><td>It is the experience and expertise in the processes through training in setting, draining, melting, extruder and integration of new equipment.</td><td>Human Resources</td></tr><tr><td>4</td><td>Competence to integrate personnel into a human resources process</td><td>It has an effect on: low staff turnover, honesty, loyalty and environment.</td><td>Human Resources</td></tr><tr><td>5</td><td>ways to manage financial resources.</td><td>It involves all the money management.</td><td>Finance</td></tr><tr><td>6</td><td>Ability to integrate technology into the organization.</td><td>It focuses on production processes, services, administration and logistics.</td><td>technology</td></tr><tr><td>7</td><td>Ability to understand the needs, desires or expectations of clients.</td><td>Alignment of actions to comply in volume, time and quality.</td><td>Comerzalization/Production</td></tr><tr><td>8</td><td>Ability to integrate, maintain and replicate the characteristics of manufactured products.</td><td>Integration of formulation and processes to obtain Defined quality products.</td><td>Production/Quality</td></tr></table>

Table 3: VGV of Customers <table><tr><td>VGV</td><td>Name</td><td>Description</td><td>Area</td></tr><tr><td>1</td><td>Quality Goods.</td><td>Ability to maintain standards and product specifications constantly for the three brands, in all presentations, for each market segment.</td><td>Product quality</td></tr><tr><td>2</td><td>Excellent products.</td><td>Guarantee of freshness, safety, hygiene, cleanliness, flavor, and no special handling.</td><td>Product quality</td></tr><tr><td>3</td><td>Current supply capacity.</td><td>Guarantee of supply to the client by handling adequate equipment in quantity and capacity.</td><td>Costu</td></tr><tr><td>4</td><td>Point of sale attention.</td><td>Performance of the distributors and ability to touch the 1,600 points of sale in Bajio and Queretaro with frequency of 2 times a week, during 7 days, wit</td><td>Costumer Service/ Distribution</td></tr><tr><td>5</td><td>Specialization of driver-salespeople in customer service and distribution.</td><td>Human resources trained in Customer Service, Distribution and Customer Search.</td><td>Costumer Service/ Distribution</td></tr><tr><td>6</td><td>Product sales by religion, type of customer, market segment, product line and benefits.</td><td>Alignment of Actions to Place and Close Sales.</td><td>Commercialization/Sales</td></tr></table>
<table><tr><td>VGV</td><td>Name</td><td>Description</td><td>Area</td></tr><tr><td>1</td><td>Quality Goods.</td><td>Ability to maintain standards and product specifications constantly for the three brands, in all presentations, for each market segment.</td><td>Product quality</td></tr><tr><td>2</td><td>Excellent products.</td><td>Guarantee of freshness, safety, hygiene, cleanliness, flavor, and no special handling.</td><td>Product quality</td></tr><tr><td>3</td><td>Current supply capacity.</td><td>Guarantee of supply to the client by handling adequate equipment in quantity and capacity.</td><td>Costu</td></tr><tr><td>4</td><td>Point of sale attention.</td><td>Performance of the distributors and ability to touch the 1,600 points of sale in Bajio and Queretaro with frequency of 2 times a week, during 7 days, wit</td><td>Costumer Service/ Distribution</td></tr><tr><td>5</td><td>Specialization of driver-salespeople in customer service and distribution.</td><td>Human resources trained in Customer Service, Distribution and Customer Search.</td><td>Costumer Service/ Distribution</td></tr><tr><td>6</td><td>Product sales by religion, type of customer, market segment, product line and benefits.</td><td>Alignment of Actions to Place and Close Sales.</td><td>Commercialization/Sales</td></tr></table>

Determining the Value-Generating Variables (VGVs) of the links transforms the Value Chain into a
Value-Generating Network, which can be explained as a system for creating and transferring value.
Source: Busquets, 2019
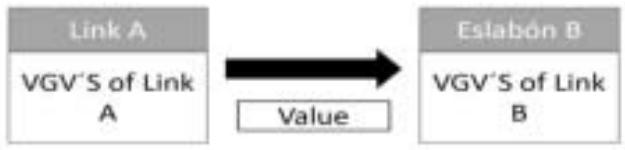
The following figure shows the Value Creation Network formed by the VGVs of the links and their interactions.
The interrelationships created by the activities within the Value Chain form a network of connections between the VGVs. The coherence in the operation of the VGVs from different links allows for synergy among the activities and, in turn, enables the organization that contains the Value Chain to create harmony in its operation (Mintzberg, 1991).
Even though Value Chains in organizations may appear as a linear process, Mintzberg (1991) clarifies that organizations are not linear, and consequently, Value Chains cannot be either. The Value Chain develops as a network of interrelationships between the links or activities of the chain (Value-Generating Network).
The variables that generate value for the links exhibit some similarities or commonalities, such as teamwork, training, and skills in multifunctional processes or projects.
The experts in each area defined the variables they perceive to have the most impact on value generation from link activities. This evaluation is a perception of the expert team and their techniques.
"An expert is the result of a grouping of ideas from experts based on a topic that has a fuzzy uncertainty or many possible answers depending on each person. Each expert has an opinion, and each of these opinions is valid based on their experiences and studies, but not everyone believes the same thing, as there is a certain subjectivity in their responses. Therefore, by grouping them according to a specific methodology, a precise answer can be reached" [15].
It's important to note that the variables established by the expert groups in each link are not formalized and differ from any official management model or procedure of the company. This is because the analysis, classification, and selection of value-generating variables depend on the perception of the members, which has a degree of subjectivity. However, by aggregating the responses, precise conclusions can be reached.
### d) Relationships of the Value-Generating Variables
The value chain in the company consists of a system of interdependent activities that are related through links [1]. In fact, Porter describes the company as a collection of discrete but interrelated economic activities or connections that allow them to produce and sell products in a coordinated manner. These connections are referred to as links, the links of the activities or links of the value chain. They are also reflected in how the links and their value-generating variables are interconnected.
In other words, following the meaning of value generation within the chain, the activities are interconnected and create links. Each link (Link A) delivers the generated value to the next link (Link B), through which the variables of Link B create value and, through the link they maintain with the variables of Link B, contribute to or affect the variables that generate the value of B. The impact of one link on another is shown in the following figure.
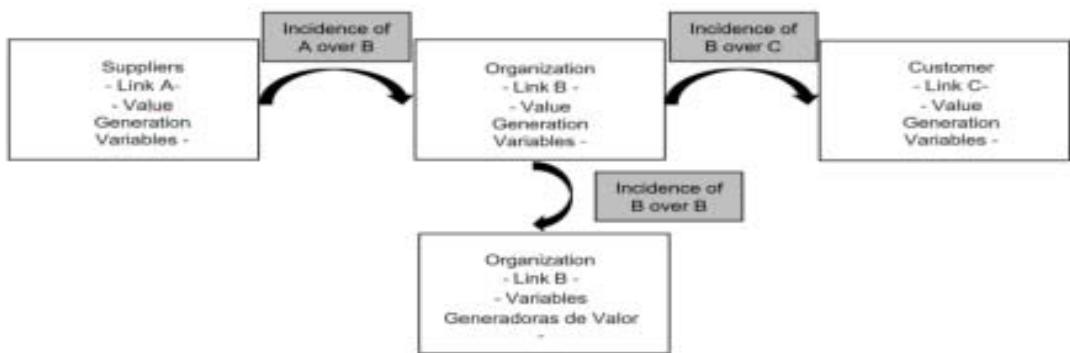
The impact of the variables in one link (Link) on the variables in the next link (Link) supports the value chain operation of the company.
## III. INCIDENCE MATRICES (PCM)
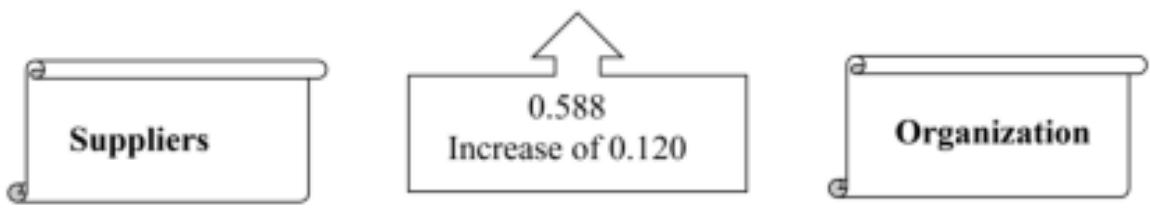
To evaluate the extent of incidence between the variables from one link to another, following the natural flow of the product or service creation process as per Porter's model, the study applies the tool of incidence matrices or Participative Causal Matrix (PCM), in combination with fuzzy numbers [13].
Each incidence between the links generates a matrix of fuzzy incidences, where the intersection of each value-generating variable of the evaluated link (Link A) is assessed against each variable generating value in the evaluation link (Link B). The crossing elements are defined as connections [1] and represent the interactions between the variables of the value generators.
### a) Process and Method for Evaluating PCM
To evaluate the incidence between the value-generating variables, the Participative Causal Matrix
(PCM) model was evaluated by an experton method, and to build the experton method, the following process was carried out: [16]
1. Create a table with opinion scales (Table 4)
2. Ask the experts for their degree of response regarding a topic of interest.
3. Obtain probabilities of responses.
4. Obtain cumulative probabilities of responses.
Following the Experton method, members of the "influenced" or "impacted" link assess the incidence they perceive from the value-generating variables of the "influencing" or "incident" link on their value-generating variables.
The variables of the evaluated link represent the rows of the matrix, and the variables of the evaluating link represent the columns of the same matrix. These incidences are known as first-order incidences [6].
## i. Create a Table with Opinion Scales
The expert opinion scale is based on fuzzy numbers, as shown in the table below.
Table 4: Fuzzy Number Scale Semantics of perception. No Incidencia 0 Virtually no incidence 0.1 Almost no incidence 0.2 very weak incidence 0.3 Weak incidence 0.4 Median inciden 0.5 Sensitive incidence 0.6 Quite an incidence 0.7 Strong incidence 0.8 Very strong incidence 0.9 The highest incidence 1
<table><tr><td colspan="2">Semantics of perception.</td></tr><tr><td>No Incidencia</td><td>0</td></tr><tr><td>Virtually no incidence</td><td>0.1</td></tr><tr><td>Almost no incidence</td><td>0.2</td></tr><tr><td>very weak incidence</td><td>0.3</td></tr><tr><td>Weak incidence</td><td>0.4</td></tr><tr><td>Median inciden</td><td>0.5</td></tr><tr><td>Sensitive incidence</td><td>0.6</td></tr><tr><td>Quite an incidence</td><td>0.7</td></tr><tr><td>Strong incidence</td><td>0.8</td></tr><tr><td>Very strong incidence</td><td>0.9</td></tr><tr><td>The highest incidence</td><td>1</td></tr></table>
For this example in the company, fuzzy numbers have been used to obtain fuzzy matrices from experts using a central evaluation. While there are several options for evaluating fuzzy incidence matrices, such as confidence intervals, triangular (lower-middle-upper endpoints), as well as triplet of confidences, the methodology described here handles the option of using any of the fuzzy matrix options described by Kaufmann, A., Gil Aluja [4].
ii. Ask the Experts for their Response on the Degree of Incidence of each Topic
Each member of the expert groups in the link generates an incidence matrix based on a fuzzy number scale and answers the following question:
"How much does VGV of Ai affect VGV of Bj?"
## iii. Obtain Probabilities of Responses
The incidence of each variable from the previous link is assessed on the variables in the link to which the experts belong. Each expert generates an incidence evaluation matrix according to their perception in each evaluated link, i.e., how the value-generating variable of each Ai affects the value-generating variable of each Bj in one way. As a result, we obtain all the values of a VGV (i, j) in a performance matrix of each expert's system: $m A / B \sim i j$.
## iv. Obtain Cumulative Probabilities of Responses as
Explained Earlier, the First Order Incidence
Evaluation is the resulting matrix from the assessment exercise of the VGV incidences of one link in the VGV of another link, which is carried out by the group of experts. This results in an incidence matrix obtained by the central tendency statistical method. We get the value of each cell ij by averaging the value of each cell evaluated by the experts [8].
In such a way: $\text{MA/B} \sim \text{i j} = \text{Average}\{m1, m2, m3, m€\}$; where $\text{€} =$ number of experts. With the matrices generated by the experts from each link, a matrix of incidences is determined with the average of all matrices (Central Tendency Method), where the value of each link ij is equal to the average of the value of each link evaluated by the expert. Therefore, for each link, a matrix of incidents from individual expert assessments is obtained. The Organization link generated a first-order incidence matrix with 8 VGVs from the Suppliers link and 8 VGVs from the Organization:
Fuzzy incidence matrix Suppliers $\rightarrow$ Organization: M A/ B $\sim$ i j
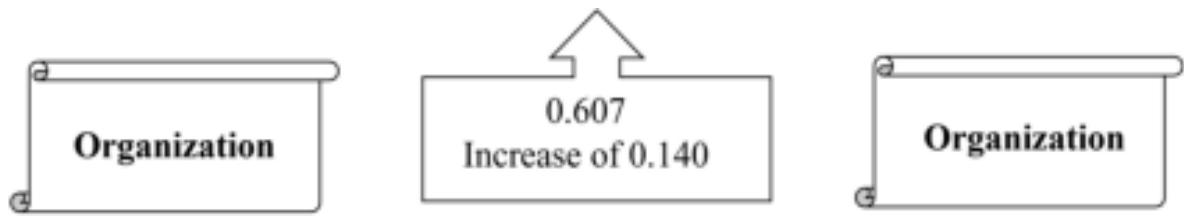
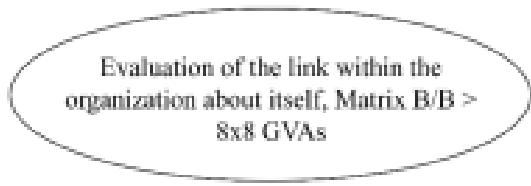
The value chain evaluation includes a self-evaluation by the experts in the Operations area of the company regarding their own VGVs, which generated a Participative Causal Matrix with fuzzy numbers of the incidence that the experts in this Operations area perceive from their own VGVs. This represents the experts' perception of the operations of their own VGVs and how they help add value to their processes; this matrix is defined as:
Incidence Matrix Organization $\rightarrow$ Organization: M B/B $\sim$ jk
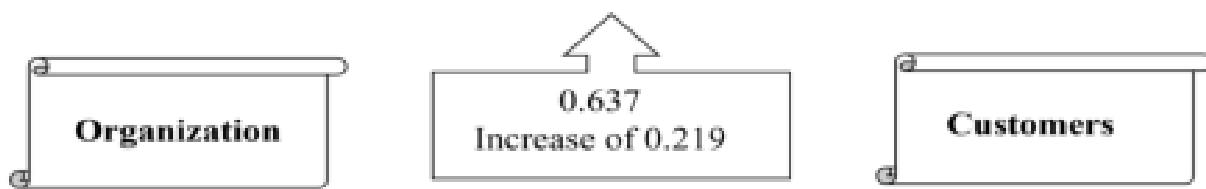
The first-order incidence matrix generated by the Operations/Operations area is an 8x8 matrix. Continuing with the value chain, the Operations area of the Company generated a Participative Causal Matrix with fuzzy numbers of the incidence that the experts in this area perceive from the VGV of the Customers area of the Company. This represents the perception that experts or customers of the Company have of how the Operations experts of the Company help them add value to their processes; this matrix is defined as:
Incidence Matrix Organization $\rightarrow$ Customers: M B/C $\sim$ jk
The first-order incidence matrix generated by Operations consists of 8 VGVs from Operations and 8 VGVs from Customers.
Measurement Results (Matrix A/Matrix B)
Linkage from suppliers to the organization.
Evaluation of the link of suppliers on the organization, Matrix A/B > 8x8 GVAs

<table><tr><td>#</td><td>Variables of the suppliers.</td><td>Avarage</td><td>Synergy</td></tr><tr><td>1</td><td>High-quality raw material suppliers' products with premium components and features.</td><td>0.688</td><td>Quality</td></tr><tr><td>4</td><td>Current Scheduled Supply Capacity</td><td>0.675</td><td>Efficiency</td></tr><tr><td>2</td><td>Order to Delivery Logistics</td><td>0.629</td><td>Ability to satisfy costumers</td></tr><tr><td>7</td><td>Supplier's ability to understand customer needs</td><td>0.621</td><td>Ability to satisfy costumers</td></tr><tr><td>3</td><td>Supplier's capacity and knowledge in handling sanitary standards and ensuring product safety.</td><td>0.621</td><td>Quality</td></tr><tr><td>8</td><td>Supplier's commercial advisory services</td><td>0.533</td><td>Ability to satisfy costumers</td></tr><tr><td>5</td><td>Supply potential with volumes capable of growing up to 10 times more.</td><td>0.504</td><td>Innovation</td></tr><tr><td>6</td><td>Commercial management of the supplier</td><td>0.433</td><td>Ability to satisfy costumers</td></tr></table>
Measurement Results (Matrix B/Matrix B) Linkage within the operation.
Measurement Results (Matrix B/Matrix C)
<table><tr><td>#</td><td>Variables of the suppliers.</td><td>Avarage</td><td>Synergy</td></tr><tr><td>1</td><td>Ability to discern my raw material needs and identify the supplier who will provide them</td><td>0.733</td><td>Quality</td></tr><tr><td>8</td><td>Ability to integrate, maintain, and replicate the features of manufactured products.</td><td>0.717</td><td>Quality</td></tr><tr><td>2</td><td>Effectiveness in coordinating a sales plan with a production and raw material plan.</td><td>0.646</td><td>Ability to satisfy costumers</td></tr><tr><td>7</td><td>Capacity to understand the needs, desires, or expectations of customers.</td><td>0.596</td><td>Ability to satisfy costumers</td></tr><tr><td>3</td><td>Capacity and knowledge of personnel in the manufacturing processes.</td><td>0.588</td><td>Quality</td></tr><tr><td>6</td><td>Capacity to integrate technology into the organization</td><td>0.583</td><td>Innovation</td></tr></table>
Linkage from the operation to the customers, incidence column.
<table><tr><td>#</td><td>Variables of the suppliers.</td><td>Avarage</td><td>Synergy</td></tr><tr><td>7</td><td>Capacity to understand the needs, desires, or expectations of customers.</td><td>0.728</td><td>Ability to satisfy costumers</td></tr><tr><td>2</td><td>Effectiveness in coordinating a sales plan with a production and raw material plan</td><td>0.725</td><td>Ability to satisfy costumers</td></tr><tr><td>1</td><td>Ability to discern what I need in raw materials and who will provide it.</td><td>0.708</td><td>Quality</td></tr><tr><td>8</td><td>Ability to integrate, maintain, and replicate characteristics of manufactured products</td><td>0.697</td><td>Quality</td></tr><tr><td>6</td><td>Capacity to integrate technology into the organization.</td><td>0.597</td><td>Innovation</td></tr><tr><td>3</td><td>Capacity and knowledge of personnel in the manufacturing processes.</td><td>0.581</td><td>Quality</td></tr><tr><td>5</td><td>Ways to manage financial resources</td><td>0.553</td><td>Efficiency</td></tr><tr><td>4</td><td>Competence in integrating personnel in a human resources process.</td><td>0.506</td><td>Efficiency</td></tr></table>
Linkage from the operation to the customers, impacted row.
<table><tr><td>#</td><td>Variables of the suppliers.</td><td>Avarage</td><td>Synergy</td></tr><tr><td>1</td><td>Quality Products</td><td>0.821</td><td>Quality</td></tr><tr><td>2</td><td>Effectiveness in Excellent Product</td><td>0.804</td><td>Quality</td></tr><tr><td>8</td><td>Competition against other products in the market</td><td>0.783</td><td>Quality</td></tr><tr><td>7</td><td>Selling products by region, customer type, market segment, product line, and presentations.</td><td>0.725</td><td>Customer service capability</td></tr><tr><td>9</td><td>Customer attention and relationship</td><td>0.708</td><td>Customer service capability</td></tr><tr><td>3</td><td>Perception of variations in product quality</td><td>0.700</td><td>Efficiency</td></tr><tr><td>12</td><td>Plant order system</td><td>0.571</td><td>Customer service capability</td></tr><tr><td>6</td><td>Specialization of driver-salespersons in customer service and distribution</td><td>0.558</td><td>Quality</td></tr><tr><td>4</td><td>Current scheduled supply capacity</td><td>0.533</td><td>Efficiency</td></tr><tr><td>5</td><td>Attention to points of sale</td><td>0.525</td><td>Customer service capability</td></tr><tr><td>10</td><td>Customer management and flow closure (1)</td><td>0.467</td><td>Customer service capability</td></tr><tr><td>11</td><td>Customer management and flow closure (2)</td><td>0.446</td><td>Customer service capability</td></tr></table>
<table><tr><td>#</td><td>Variables of the suppliers.</td><td>Avarage</td><td>Synergy</td></tr><tr><td>1</td><td>Quality Products</td><td>0.821</td><td>Quality</td></tr><tr><td>2</td><td>Effectiveness in Excellent Product</td><td>0.804</td><td>Quality</td></tr><tr><td>8</td><td>Competition against other products in the market</td><td>0.783</td><td>Quality</td></tr><tr><td>7</td><td>Selling products by region, customer type, market segment, product line, and presentations.</td><td>0.725</td><td>Customer service capability</td></tr><tr><td>9</td><td>Customer attention and relationship</td><td>0.708</td><td>Customer service capability</td></tr><tr><td>3</td><td>Perception of variations in product quality</td><td>0.700</td><td>Efficiency</td></tr><tr><td>12</td><td>Plant order system</td><td>0.571</td><td>Customer service capability</td></tr><tr><td>6</td><td>Specialization of driver-salespersons in customer service and distribution</td><td>0.558</td><td>Quality</td></tr><tr><td>4</td><td>Current scheduled supply capacity</td><td>0.533</td><td>Efficiency</td></tr><tr><td>5</td><td>Attention to points of sale</td><td>0.525</td><td>Customer service capability</td></tr><tr><td>10</td><td>Customer management and flow closure (1)</td><td>0.467</td><td>Customer service capability</td></tr><tr><td>11</td><td>Customer management and flow closure (2)</td><td>0.446</td><td>Customer service capability</td></tr></table>
### b) Evaluation
Our Value Chain consists of 3 Links: Suppliers, the Organization, and Customers. It has 3 links evaluated by measuring incidences.
<table><tr><td></td><td>Suppliers Organization</td><td>Internal Organization</td><td>Client Organization</td></tr><tr><td>Current Assessment</td><td>0.518</td><td>0.512</td><td>0.484</td></tr></table>
## IV. CONCLUSIONS
The present study demonstrates the use of Value Generating Variables (VGV) along with various existing methodologies specifically tailored to create a diagnostic model for the value chain in a company or organization within the food industry.
The study maps the quantitative evaluation of Global Value Added (VGV) and its numerical contribution in creating value for the products developed by the company. This demonstrates, in a practical manner, how this model is applicable for diagnosis. The classification of VGV helps identify those elements significantly supporting the value created within the standards of the value chain.
The study cannot be conclusive as it provides a simplified analysis of the methodology; however, it demonstrates that the model is consistent in its results. In conclusion, it presents itself as a viable option for the quantifiable diagnosis of the value chain and Global Value Adds (VGVs) With the classification of Value Generation Chains (VGVs) based on their contribution to the created value within the value chain, it is possible to categorize the primary VGV chains that generate value. This enables the identification of the type of competitive strategy the organization is pursuing. Subsequently, targeted improvements to the competitive strategy can be proposed, focusing on the chains that generate the most significant value.
The proposed model creates maps of the value creation system used by the organization and the network system where the interaction with Value Generation Chains (VGVs) occurs. It also facilitates the identification of chains with higher synergy in value creation.
The Value Generation Chains (VGV)-based model presented in the study opens up a wide range of potential applications for diagnosing value creation in organizations.
Possible subsequent studies could focus on the synergy of Value Generation Chains (VGVs) within the value chain, as well as Creation of Advantages and Competitive Strategy through VGVs.
Generating HTML Viewer...
References
18 Cites in Article
Michael Porter (2002). Ventaja Competitiva. Creación y sostenimiento de un desempeño superior.
P Van Gigch,John (2006). Teoría General de Sistemas.
L Guerras,J Navas (1996). La Dirección Estratégica de la Empresa. Teoría y Aplicaciones.
A Kaufmann,J Gil Aluja (1986). Introducción de la teoría de los subconjuntos borrosos a la gestión de las empresas.
A Kaufmann,J Gil Aluja (1987). Eficacia de diferentes técnicas para reducir el estrés.
A Kaufmann,J Gil Aluja (1988). Modelos para la investigación de efectos olvidados.
C Pérez (2014). Aportes teóricos a la Matemática Borrosa.
Gordon Hayward,Valerie Davidson (2003). Fuzzy logic applications.
Ahmad Mirdamadi,Niloofar Mirdamadi (2013). A Case of Recurrent Osteomyelitis Due to Retained Micro-Catheter after Cerebral Angiography.
J Tinto,M Molina De Tinto,H Chávez (2015). Instrumentos fuzzy para la toma de decisiones en las ciencias contables.
A Azadegan,L Porobic,S Ghazinoory,P Samouei,A Saman (2011). Fuzzy logic in manufacturing: A review of literature and specialized application.
G Deloscobos,A Terceño,M Gutiérrez (2013). Lineamientos generales de solución para programación lineal con coeficientes borrosos.
Albert Weckenmann,Teresa Werner (2010). Holistic Qualification in Manufacturing Metrology by Enhancing Knowledge Exchange Among Different User Groups.
M Hansen,J Birkinshaw (2007). The Innovation Value Chain.
Paulino Mallo,María Artola,Mariano Morettini,Marcelo Galante,Mariano Pascual,Adrián Busetto (2021). Valuación de activos intangibles con matemática difusa y su adecuación a normas contables españolas e internacionales.
M Rodríguez,K Cortez (2012). Nuevos Métodos Cuantitativos Aplicados a las Ciencias Sociales.
P Navarrete (2016). COMENTARIOS DE CIERRE.
J Ruiz,J Zubillaga (2002). Investigación de Efectos Olvidados en el Despliegue de la Función de Calidad (QFD).
No ethics committee approval was required for this article type.
Data Availability
Not applicable for this article.
How to Cite This Article
Efrén Busquets Silva. 2026. \u201cUse of Value Generating Variables (VGV) for Evaluation and Diagnosis of the Value Chain in Strategy Creation Competitive in Organizations\u201d. Global Journal of Management and Business Research - A: Administration & Management GJMBR-A Volume 23 (GJMBR Volume 23 Issue A11): .
Explore published articles in an immersive Augmented Reality environment. Our platform converts research papers into interactive 3D books, allowing readers to view and interact with content using AR and VR compatible devices.
Your published article is automatically converted into a realistic 3D book. Flip through pages and read research papers in a more engaging and interactive format.
Our website is actively being updated, and changes may occur frequently. Please clear your browser cache if needed. For feedback or error reporting, please email [email protected]
Thank you for connecting with us. We will respond to you shortly.