I. INTRODUCTION
Job and career opportunities in STEM experienced tremendous growth each year. Because of this, industry professionals, politicians, and educators strongly encourage and support students matriculating into degree programs in the STEM field. While the growth in the number of graduates needed to fill the increasing number of opportunities is promising, female and minority students are underrepresented in the STEM fields (National Science & Technology Council, 2018). Many educators believe a lack of interest in the STEM professions begins at an early age. Disenfranchised students need the opportunities afforded to students in more affluent areas of a school district, city, or state (Anderhag et al., 2016). Research shows a lack of minority female students going into the STEM fields. This is partly due to the need for more awareness of the STEM field. This STEM knowledge and understanding measured at the beginning and end of the research study will be shared after the final analysis.
The researchers, as well as the workshop presenters, are faculty members at a private university located in the state of Florida. The study aimed to include 9th-grade female students from all racial and ethnic backgrounds and expose them to hands-on workshops related to STEM. Further, it is the view of the researchers involved in this study that this population of minority, underserved students will benefit from the infusion of the arts in this project. According to Brouillette (p.58), "Now there is growing recognition that, in STEAM projects, the arts not only play their traditional content area role but also scaffold the teaching of science concepts that students could not otherwise envision." One challenge educators face introducing new, often unfamiliar STEM concepts is building a personal connection that will have meaning. Through creative, arts-based approaches, this challenge is more likely to impact the imagination and interest of the student. This effort to connect is carefully crafted by the educator, with the emphasis being placed on STEM disciplines. The arts are a paved learning pathway that allows students to invent, problem-solve, create, and make what they are learning tangible. The research location is a public charter school that receives funding from the state. The principal and his leadership team provided the physical space and staffing necessary to support the STEAM workshops. STEAM professionals recruited from Nova Southeastern University delivered art-focused presentations at the weekly meetings.
The ninth-grade female students were asked to participate in this research study provided by faculty members from the researchers' University because they are currently enrolled in an intervention High School. The parents of these underaged children must grant permission to allow their child to participate. These students were chosen based on students having similar academic performance. One group of 25 female students was identified from the school's advanced science class (biology), with the remaining 12 students participating on a volunteer basis. The biology class has a Florida-certified teacher and two aides.
II. METHOD AND MATERIALS
The school helped identify all 37 students to participate in this study. These students participated in weekly STEM (STEAM) workshops with a pre-planned
STEM (STEAM) curriculum that the presenters and the researchers created. In addition, the students took a pre-survey using the S-Stem questionnaire regarding their perceptions of the STEM (STEAM) program before the start of the project. Following the 15 STEM (STEAM) workshop sessions, the participating students will take a post-survey using the S-STEM questionnaire. The research team will compare the pre-and post-questionnaire results at the end of the intervention period.
All participants have the right not to participate and leave the study anytime. If they decide not to participate or go, they will still receive the regular science program at the school but will not be part of the research study. However, if a student chooses to stop being in the study before it is over, any information collected (such as the pre-survey) will be kept in the research records for 36 months from the end of the study and may be used as a part of the research.
There is no guarantee or promise that participants will receive any benefit from this study. The possible use of being in this research study is to know how their perception of the STEM (STEAM) field has changed and science knowledge has improved at the end of the study. The researchers intend that information learned from the survey will benefit people in similar settings.
All information about the participants in this research study will be handled confidentially, within the limits of the law, and will be limited to people who need to review this information. The lead researcher stored the participant information on a university computer. The researchers will use the data for granting agencies and publications to share knowledge with other researchers and educators.
Many K-12 students, predominantly minority female students in the United States, lack the knowledge and skills to continue their STEM education and ultimately enter the workforce. There is an estimated growth rate of STEM careers between 2017 and 2027, compared to in other career fields (Education Commission of the States, 2020). To meet this need for STEM professionals, educational leaders in the United States are adamant in stating, "to hold a competitive edge in a rapidly changing global workforce, bolstering the nation's science, technology, engineering, and math (STEM) workforce is essential" (National Education Association, 2016).
Although in their earliest years, children are natural scientists, engineers, and problem-solvers (Murphy, 2001), by the time these same students reach the grade, over have lost interest in focusing on higher education or a career in one of the STEM disciplines. Other researchers strongly believe that students are interested in STEM disciplines; a strong interest never develops (McCreedy & Kierking, 2013). Regardless of the reason, the fact remains that our STEM pipeline is significantly reduced by the time students reach middle school, secondary school, and college. Females, students from lower socioeconomic backgrounds, and students from ethnic or racial minority groups are most affected (Figure 1).
| Example 1 | Strongly Disagree | Disagree | Neither Agree nor Disagree | Agree | Strongly Agree |
| ○ | ○ | ○ | ○ | ○ |
Figure 1: Perceived Reasons for Gender and Ethnic Underrepresentation in STEM Of these, equal gender representation is the most significant concern for educators. Studies have shown that, while gender disparity is lessening, more can be done to recruit females into STEM-related higher education and careers (Hawkins, 2015). Efforts to rectify this problem have shown that early exposure to informal STEM experiences can positively affect learning and participation (Langdon et al., 2011). This research project involved developing and delivering weekly STEAM hands-on workshops to high-school females and evaluating their effect on STEM interest, awareness, and knowledge. The study was conducted in an urban, predominantly Hispanic, lower socioeconomic Title 1 school in West Palm Beach, Florida. An over-arching research question guided the work: "Can participation in weekly STEAM workshops increase young females' STEM interest and awareness?"
In the most recent census, West Palm Beach, Florida, had approximately 110,000 residents, with a racial breakdown of non-Hispanic white,
African American, and Hispanic, earning a median income of roughly $54,000 (United States Census Bureau, 2019). The School District of Palm Beach County (SDPBC) consists of 160 K- 12 schools enrolling approximately 170,000 students yearly. The district offers over 300 Choice programs that allow students to focus on various personal interests (e.g., the International Baccalaureate program, programs dedicated to music and the fine arts, information technology, and foreign languages). In addition, three schools host Choice STEM programs at the high school level (Palm Beach County Schools, 2020).
The high school hosting the research project is a Title 1 institution with a population of approximately 200 students. In the most recent school year, the population was about Hispanic, Black, and non-Hispanic white; the remaining represented other racial and ethnic groups. The population is female and male, and of students are eligible for free or reduced lunch. In addition, the school has ten
Choice Programs, a no Choice STEM program (Palm Beach County Schools, 2020).
This research aimed to develop and deliver a STEM-focused weekly program at the high school. This study focused on all aspects of STEM integrating the arts. The participants included female, predominantly Hispanic, 9th-grade students. Administrators at the school provided teachers, staff, and the physical space necessary to support the program. In addition, STEM professionals from the researchers' private university were recruited and delivered focused presentations at the weekly meetings, including anatomy, elementary physics, food science, botany, 2-D painting/drawing, sound, engineering, Tai Chi, and physiology.
The Student Attitudes Toward STEM Survey (S-STEM) measures students' interest and awareness of STEM content and careers (Friday Institute for Educational Innovation, 2012) and has shown
acceptable levels of reliability and construct validity (Faber et al., 2013; Unfried et al., 2015). The S-STEM consists of four sections to measure one make within the STEM domain (i.e., science, technology, engineering, and math). For this study, the researchers used a modified version of the science section comprised of nine statements with answers ranging from "Strongly Disagree" to Agree Strongly." The answers will represent numeric values ranging from 1 to 5; an overall average will be computed.
Based on the Central Limit Theorem (CLT), the sample size of 37 is sufficient for statistical significance. The Central Limit Theorem is used so that the sampling distribution will always be generally distributed if the sample size is large enough, in our case, 37 students.
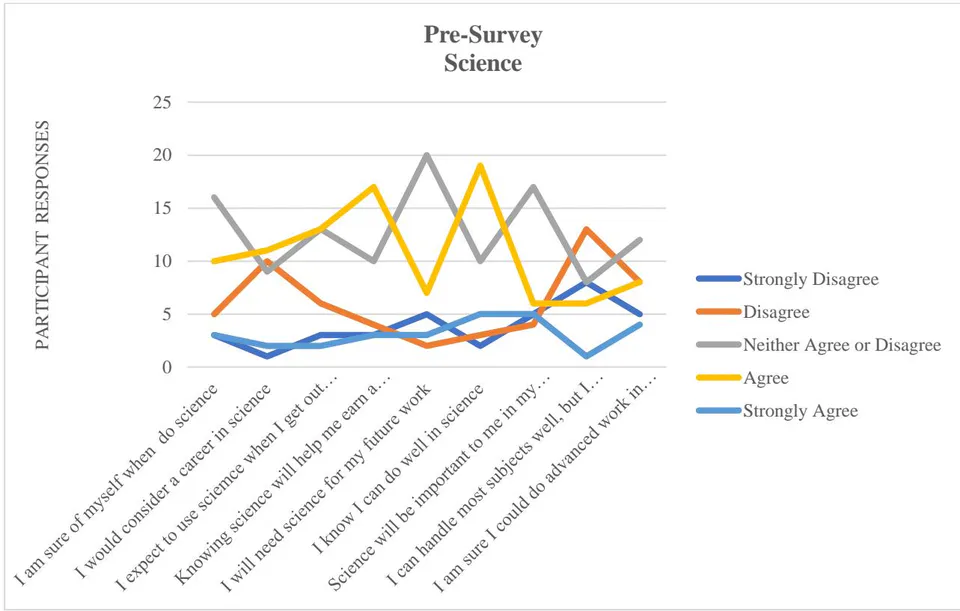
The pre-survey on Science, Technology, Engineering, and Mathematics was given in October 2022 before the workshops (Figure 2).
III. RESULTS AND DISCUSSION
Statistical methods for analyzing data are critical as they provide necessary insight to researchers. For individuals conducting research problems, it is essential to understand how to develop a research problem, along with a plan for gathering data, followed by ways to interpret the collected data. Next, researchers gather raw data and transform them into graphs to further dissect the results. Finally, researchers can conclude a population using analysis methods such as descriptive statistics, inferential statistics, and
correlation analysis. This study will investigate 9th-grade female students' attitudes and abilities toward four areas of STEM following a survey obtained from a population sample.
a) Development of Raw Data into Graphs
The central limit theorem is the principle that the distribution from sample means makes assumptions as a population grows. Using the preliminary pre-survey data of 9th-grade female students, we can make assumptions about the people of all 9th-grade female students regarding the sample responses to the
questions about the four areas of STEM. The post-survey data was compared to the preliminary data to determine if the students' beliefs remained the same or experienced a change.
For this study, the students were asked preliminary questions regarding their feelings and abilities in four areas of STEM: math, science, engineering, and technology. The questions required the
students to respond with one of the provided answer choices, strongly disagree, disagree, neither agree nor disagree, coordinate, and strongly agree. Established answer choices allow for easy understanding and better comparison between the students and the post-survey data. In addition, the preliminary survey results were developed into a graph to provide a visual of the data.
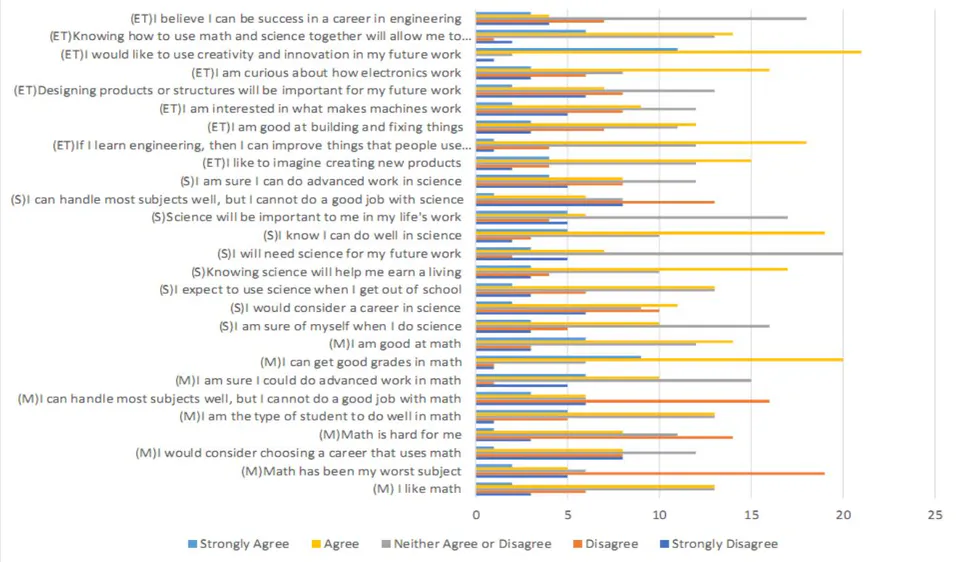
A bar graph is determined to suit the data best to show all responses on the same plane. This graph easily distinguishes the frequency of each response to the questions. From this, we can gather some general assumptions regarding 9th-grade female students. For example, the question "Math has been my worst subject" produced a substantial number of "disagree," while the other responses were somewhat equal. This tells us that most students do not think math is their worst subject.
b) Descriptive Statistics Analysis
To better understand the results of the survey, it is advisable to make use of descriptive statistics. Measures of central tendency and variability are often used first to analyze data. The main direction is determined by uncovering the mean, median, and mode. Variability considers the responses' dispersion using tools such as range and interquartile range.
Due to the nature of the survey, the data would be considered ordinal. The research questions are
formatted in a way that generates responses on a scale known as a Likert scale (Sullivan & Artino, 2013). Likert data requires respondents to rank their agreeableness to each statement. Reactions in the data set are among five choices ranging from strongly disagree to agree strongly. The differences between each option are not necessarily equal, which allows us to consider this ordinal data (Sullivan & Artino, 2013).
Ordinal data is best analyzed using median, mode, range, and interquartile range. Inputting the survey data into the SPSS software computes this information for further analysis. Each question is labeled as the subject abbreviation followed by the question number (e.g., M1 = "I like math"). The responses are converted into quantitative data for ease of interpretation. Therefore, strongly disagrees, disagree, neither agree nor disagree, agree, and strongly agree.
Figure 3: (Tables 1, 2, and 3): Raw Data Analysis Statistics
| M8 | M9 | S1 | S2 | S3 | S4 | S5 | ||
| N | Valid | 37 | 38 | 37 | 38 | 37 | 37 | 37 |
| Missing | 2 | 1 | 2 | 1 | 2 | 2 | 2 | |
| Median | 4.0000 | 4.0000 | 3.0000 | 3.0000 | 3.0000 | 4.0000 | 3.0000 | |
| Mode | 4.00 | 4.00 | 3.00 | 4.00 | 4.00 | 3.00 | ||
| Range | 4.00 | 4.00 | 4.00 | 4.00 | 4.00 | 4.00 | 4.00 | |
| Minimum | 1.00 | 1.00 | 1.00 | 1.00 | 1.00 | 1.00 | 1.00 | |
| Maximum | 5.00 | 5.00 | 5.00 | 5.00 | 5.00 | 5.00 | 5.00 | |
| Percentiles | 25 | 4.0000 | 3.0000 | 3.0000 | 2.0000 | 2.5000 | 3.0000 | 3.0000 |
| 50 | 4.0000 | 4.0000 | 3.0000 | 3.0000 | 3.0000 | 4.0000 | 3.0000 | |
| 75 | 4.5000 | 4.0000 | 4.0000 | 4.0000 | 4.0000 | 4.0000 | 4.0000 | |
Statistics
| M1 | M2 | M3 | M4 | M5 | M6 | M7 | ||
| N | Valid | 37 | 37 | 37 | 37 | 37 | 37 | 37 |
| Missing | 2 | 2 | 2 | 2 | 2 | 2 | 2 | |
| Median | 3.0000 | 2.0000 | 3.0000 | 3.0000 | 3.0000 | 2.0000 | 3.0000 | |
| Mode | 2.00 | 3.00 | 2.00 | 2.00 | 3.00 | |||
| Range | 4.00 | 4.00 | 4.00 | 4.00 | 4.00 | 4.00 | 4.00 | |
| Minimum | 1.00 | 1.00 | 1.00 | 1.00 | 1.00 | 1.00 | 1.00 | |
| Maximum | 5.00 | 5.00 | 5.00 | 5.00 | 5.00 | 5.00 | 5.00 | |
| Percentiles | 25 | 2.5000 | 2.0000 | 2.0000 | 2.0000 | 3.0000 | 2.0000 | 3.0000 |
| 50 | 3.0000 | 2.0000 | 3.0000 | 3.0000 | 3.0000 | 2.0000 | 3.0000 | |
| 75 | 4.0000 | 3.0000 | 3.5000 | 3.5000 | 4.0000 | 3.5000 | 4.0000 | |
Statistics
| S6 | S7 | S8 | S9 | ET1 | ET2 | ET3 | ||
| N | Valid | 39 | 37 | 36 | 37 | 37 | 36 | 36 |
| Missing | 0 | 2 | 3 | 2 | 2 | 3 | 3 | |
| Median | 4.0000 | 3.0000 | 2.0000 | 3.0000 | 4.0000 | 4.0000 | 3.0000 | |
| Mode | 4.00 | 3.00 | 2.00 | 3.00 | 4.00 | 4.00 | 4.00 | |
| Range | 4.00 | 4.00 | 4.00 | 4.00 | 4.00 | 4.00 | 4.00 | |
| Minimum | 1.00 | 1.00 | 1.00 | 1.00 | 1.00 | 1.00 | 1.00 | |
| Maximum | 5.00 | 5.00 | 5.00 | 5.00 | 5.00 | 5.00 | 5.00 | |
| Percentiles | 25 | 3.0000 | 2.5000 | 2.0000 | 2.0000 | 3.0000 | 3.0000 | 2.0000 |
| 50 | 4.0000 | 3.0000 | 2.0000 | 3.0000 | 4.0000 | 4.0000 | 3.0000 | |
| 75 | 4.0000 | 4.0000 | 3.0000 | 4.0000 | 4.0000 | 4.0000 | 4.0000 | |
Statistics
| ET4 | ET5 | ET6 | ET7 | ET8 | ET9 | ||
| N | Valid | 36 | 36 | 36 | 35 | 36 | 36 |
| Missing | 3 | 3 | 3 | 4 | 3 | 3 | |
| Median | 3.0000 | 3.0000 | 4.0000 | 4.0000 | 4.0000 | 3.0000 | |
| Mode | 3.00 | 3.00 | 4.00 | 4.00 | 4.00 | 3.00 | |
| Range | 4.00 | 4.00 | 4.00 | 4.00 | 4.00 | 4.00 | |
| Minimum | 1.00 | 1.00 | 1.00 | 1.00 | 1.00 | 1.00 | |
| Maximum | 5.00 | 5.00 | 5.00 | 5.00 | 5.00 | 5.00 | |
| Percentiles | 25 | 2.0000 | 2.0000 | 2.2500 | 4.0000 | 3.0000 | 2.0000 |
| 50 | 3.0000 | 3.0000 | 4.0000 | 4.0000 | 4.0000 | 3.0000 | |
| 75 | 4.0000 | 3.7500 | 4.0000 | 5.0000 | 4.0000 | 3.0000 | |
The data in the tables allows for a more straightforward interpretation of the survey results. The mode is valuable because it tells the researcher which response was the most common and indicates how most participants felt toward the question. The median is also helpful because it means the researcher is where the middle of the distribution lies. The range for all variables will be four due to the five total response choices. Therefore, the interquartile range will provide a more accurate measure of dispersion. The interquartile content can be calculated by subtracting the and percentile. A minor difference between the first and third quartiles indicates consensus among the participants.
Due to this being ordinal data, the uncertainty of the distance between responses means some statistical
functions will be less accurate. Therefore, other data types will find other interpretation methods valid. This will include the measure of central tendency, mean, which indicates the statistical average of the data results. In addition, different kinds of data will utilize the methods of dispersion, standard deviation, and variance. Standard deviation indicates the average distance between the response from the mean. Variance is equal to standard deviation squared and is only used when standard deviation cannot be used. Although this information is regarded as less suitable for ordinal data, some statisticians support this data's significance, so it may be beneficial to consider this information if it is not the sole basis for decision-making.
| Explore Data - Column 1 | |
| Sample Size, n: 37 | |
| Mean: 2.45946 | |
| Median: 2.00000 | |
| Midrange: 3.00000 | |
| RMS: 2.67622 | |
| Variance, s^2: 1.14414 | |
| Standard Deviation, s: 1.06965 | |
| Mean Absolute Deviation: 0.86633 | |
| Range: 4.00000 | |
| Coefficient of Variance: 43.49113% | |
| Minimum: 1 | |
| 1st Quartile: 2.00000 | |
| 2nd Quartile: 2.00000 | |
| 3rd Quartile: 3.00000 | |
| Maximum: 5 | |
| Sum: 91.00000 | |
| Sum of Squares: 265.00000 | |
| 95% CI for the Mean: 2.10282 < mean < 2.81610 | |
| 95% CI for the Standard Deviation: 0.86985 < SD < 1.38943 | |
| 95% CI for the Variance: 0.75663 < VAR < 1.93051 |
| Explore Data - Column 2 Sample Size, n: 37 Mean: 2.62162 Median: 3.00000 Midrange: 3.00000 RMS: 2.85222 Variance, s^2: 1.29730 Standard Deviation, s: 1.13899 Mean Absolute Deviation: 0.97005 Range: 4.00000 Coefficient of Variance: 43.44599% Minimum: 1 1st Quartile: 2.00000 2nd Quartile: 3.00000 3rd Quartile: 3.00000 Maximum: 5 Sum: 97.00000 Sum of Squares: 301.00000 95% CI for the Mean: 2.24186 < mean < 3.00138 95% CI for the Standard Deviation: 0.92624 < SD < 1.47950 95% CI for the Variance: 0.85792 < VAR < 2.18893 | Histogram of I would consider choosing a career that uses math (n=37) Y Values 14 12 10 8 8 8 8 1 X Values |
| Explore Data - Column 9 Sample Size, n: 37 Mean: 3.13514 Median: 3.00000 Midrange: 3.00000 RMS: 3.29619 Variance, s^2: 1.06456 Standard Deviation, s: 1.03178 Mean Absolute Deviation: 0.76991 Range: 4.00000 Coefficient of Variance: 32.91014% Minimum: 1 1st Quartile: 3.00000 2nd Quartile: 3.00000 3rd Quartile: 4.00000 Maximum: 5 Sum: 116.00000 Sum of Squares: 402.00000 95% CI for the Mean: 2.79112 < mean < 3.47915 95% CI for the Standard Deviation: 0.83905 < SD < 1.34024 95% CI for the Variance: 0.70401 < VAR < 1.79624 | Histogram of I am sure of myself when I do science (n=37) X Values Y Values 15 5 3 2 1 16 10 3 3 6 X Values |
| Explore Data - Column 26 Sample Size, n: 36 Mean: 2.86111 Median: 3.00000 Midrange: 3.00000 RMS: 3.04138 Variance, s^2: 1.09444 Standard Deviation, s: 1.04616 Mean Absolute Deviation: 0.74846 Range: 4.00000 Coefficient of Variance: 36.56471% Minimum: 1 1st Quartile: 2.00000 2nd Quartile: 3.00000 3rd Quartile: 3.00000 Maximum: 5 Sum: 103.00000 Sum of Squares: 333.00000 95% CI for the Mean: 2.50714 < mean < 3.21508 95% CI for the Standard Deviation: 0.84852 < SD < 1.36465 95% CI for the Variance: 0.71998 < VAR < 1.86226 | Histogram of I believe I can be success in a career in engineering (n=36) |
Figure 4: Samples of Explore Data
c) Inferential Statistics Analysis
Inferential statistics are used to make assumptions about an entire population based on sample data. For example, using the preliminary data from the survey of 9th-grade female students, we can conclude about the whole 9th-grade female population. Comparing the data to the post-survey data can clarify the hypotheses' validity. To interpret ordinal data, it is best to utilize non-parametric procedures. Non-
parametric tests are performed using the median, making them ideal for ordinal data. Non-parametric analysis can be conducted using the Mann-Whitney, Wilcoxon, Kruskal Wallis, and Friedman tests.
The survey's preliminary data is summarized in the chart following the intervention. It is important to note that the data is obtained from a smaller sample size. However, the participants remain 9th-grade female students.
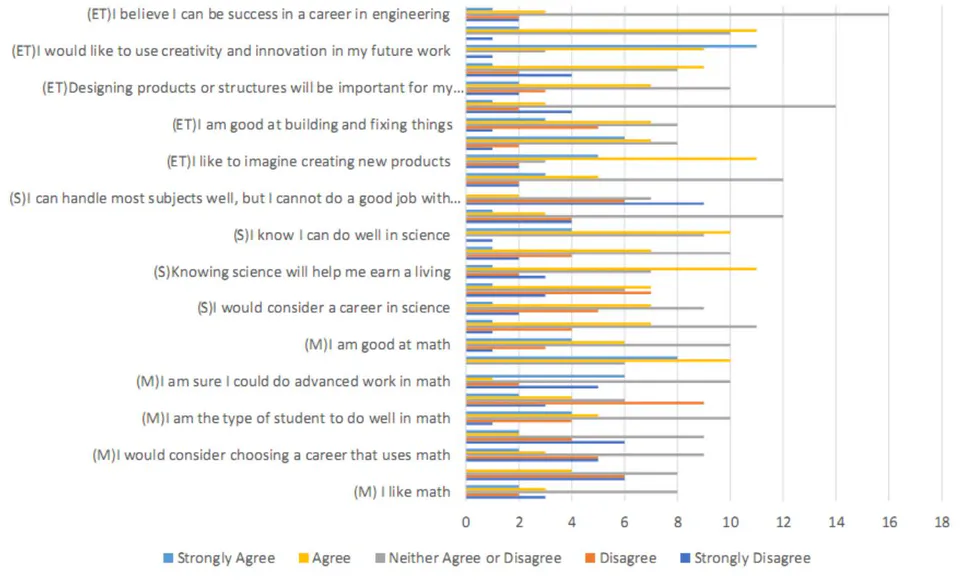
The corresponding descriptive statistics are compiled into the following tables for secondary visual analysis. The preliminary data also uses ordinal data
descriptive statistics such as median, mode, range, and interquartile range.
Statistics
| M1 | M2 | M3 | M4 | M5 | M6 | M7 | ||
| N | Valid | 18 | 24 | 24 | 24 | 24 | 24 | 24 |
| Missing | 10 | 4 | 4 | 4 | 4 | 4 | 4 | |
| Median | 3.0000 | 2.5000 | 3.0000 | 3.0000 | 3.0000 | 2.5000 | 3.0000 | |
| Mode | 3.00 | 3.00 | 3.00 | 3.00 | 3.00 | 2.00 | 3.00 | |
| Range | 4.00 | 3.00 | 4.00 | 4.00 | 4.00 | 4.00 | 4.00 | |
| Minimum | 1.00 | 1.00 | 1.00 | 1.00 | 1.00 | 1.00 | 1.00 | |
| Maximum | 5.00 | 4.00 | 5.00 | 5.00 | 5.00 | 5.00 | 5.00 | |
| Percentiles | 25 | 2.0000 | 1.2500 | 2.0000 | 1.2500 | 3.0000 | 2.0000 | 2.0000 |
| 50 | 3.0000 | 2.5000 | 3.0000 | 3.0000 | 3.0000 | 2.5000 | 3.0000 | |
| 75 | 4.0000 | 3.0000 | 3.0000 | 3.0000 | 4.0000 | 3.7500 | 4.7500 | |
| M8 | M9 | S1 | S2 | S3 | S4 | S5 | ||
| N | Valid | 24 | 24 | 24 | 24 | 24 | 24 | 24 |
| Missing | 4 | 4 | 4 | 4 | 4 | 4 | 4 | |
| Median | 4.0000 | 3.0000 | 3.0000 | 3.0000 | 3.0000 | 3.5000 | 3.0000 | |
| Mode | 4.00 | 3.00 | 3.00 | 3.00 | 4.00 | 3.00 | ||
| Range | 2.00 | 4.00 | 4.00 | 4.00 | 4.00 | 4.00 | 4.00 | |
| Minimum | 3.00 | 1.00 | 1.00 | 1.00 | 1.00 | 1.00 | 1.00 | |
| Maximum | 5.00 | 5.00 | 5.00 | 5.00 | 5.00 | 5.00 | 5.00 | |
| Percentiles | 25 | 3.2500 | 3.0000 | 3.0000 | 2.0000 | 2.0000 | 3.0000 | 2.2500 |
| 50 | 4.0000 | 3.0000 | 3.0000 | 3.0000 | 3.0000 | 3.5000 | 3.0000 | |
| 75 | 5.0000 | 4.0000 | 4.0000 | 4.0000 | 4.0000 | 4.0000 | 4.0000 | |
Statistics
| S6 | S7 | S8 | S9 | ET1 | ET2 | ET3 | ||
| N | Valid | 24 | 24 | 24 | 24 | 23 | 24 | 24 |
| Missing | 4 | 4 | 4 | 4 | 5 | 4 | 4 | |
| Median | 4.0000 | 3.0000 | 2.0000 | 3.0000 | 4.0000 | 4.0000 | 3.0000 | |
| Mode | 4.00 | 3.00 | 1.00 | 3.00 | 4.00 | 3.00 | 3.00 | |
| Range | 4.00 | 4.00 | 3.00 | 4.00 | 4.00 | 4.00 | 4.00 | |
| Minimum | 1.00 | 1.00 | 1.00 | 1.00 | 1.00 | 1.00 | 1.00 | |
| Maximum | 5.00 | 5.00 | 4.00 | 5.00 | 5.00 | 5.00 | 5.00 | |
| Percentiles | 25 | 3.0000 | 2.0000 | 1.0000 | 3.0000 | 3.0000 | 3.0000 | 2.2500 |
| 50 | 4.0000 | 3.0000 | 2.0000 | 3.0000 | 4.0000 | 4.0000 | 3.0000 | |
| 75 | 4.0000 | 3.0000 | 3.0000 | 4.0000 | 4.0000 | 4.7500 | 4.0000 | |
Statistics
| ET4 | ET5 | ET6 | ET7 | ET8 | ET9 | ||
| N | Valid | 24 | 24 | 24 | 24 | 24 | 24 |
| Missing | 4 | 4 | 4 | 4 | 4 | 4 | |
| Median | 3.0000 | 3.0000 | 3.0000 | 4.0000 | 4.0000 | 3.0000 | |
| Mode | 3.00 | 3.00 | 4.00 | 5.00 | 4.00 | 3.00 | |
| Range | 4.00 | 4.00 | 4.00 | 4.00 | 4.00 | 4.00 | |
| Minimum | 1.00 | 1.00 | 1.00 | 1.00 | 1.00 | 1.00 | |
| Maximum | 5.00 | 5.00 | 5.00 | 5.00 | 5.00 | 5.00 | |
| Percentiles | 25 | 2.2500 | 3.0000 | 2.2500 | 4.0000 | 3.0000 | 3.0000 |
| 50 | 3.0000 | 3.0000 | 3.0000 | 4.0000 | 4.0000 | 3.0000 | |
| 75 | 3.0000 | 4.0000 | 4.0000 | 5.0000 | 4.0000 | 3.0000 | |
Figures 6, 7, 8, & 9: The use of Descriptive Statistics from Raw Data
The Kruskal-Wallis test best analyzes the survey data from both samples. This test is the non-parametric equivalent of the ANOVA (analysis of variance) test (Lomuscio, 2021). It determines if the initial and post-preliminary data responses reflect the same frequencies or have identical medians. In addition, the test considers the following:
Null hypothesis : There is no statistical difference between the medians of responses regarding 9th-grade female student attitudes and abilities in the four areas of STEM before and after the intervention.
Alternative hypothesis : The preliminary data differs from the primary data from 9th-grade female students in the four areas of STEM.
| Test Statisticsa,b | |||||||
| M1 | M2 | M3 | M4 | M5 | M6 | M7 | |
| Kruskal-Wallis H | .431 | .004 | .002 | .129 | .363 | .309 | .735 |
| df | 1 | 1 | 1 | 1 | 1 | 1 | 1 |
| Asymp. Sig. | .512 | .951 | .963 | .719 | .547 | .579 | .391 |
| Test Statisticsa,b | |||||||
| M8 | M9 | S1 | S2 | S3 | S4 | S5 | |
| Kruskal-Wallis H | .173 | .219 | .009 | .357 | 1.123 | .216 | .004 |
| df | 1 | 1 | 1 | 1 | 1 | 1 | 1 |
| Asymp. Sig. | .678 | .640 | .925 | .550 | .289 | .642 | .949 |
| Test Statisticsa,b | |||||||
| S6 | S7 | S8 | S9 | ET1 | ET2 | ET3 | |
| Kruskal-Wallis H | .045 | 1.370 | 1.203 | .768 | 1.486 | .848 | .084 |
| df | 1 | 1 | 1 | 1 | 1 | 1 | 1 |
| Asymp. Sig. | .832 | .242 | .273 | .381 | .223 | .357 | .772 |
| Test Statisticsa,b | ||||||
| ET4 | ET5 | ET6 | ET7 | ET8 | ET9 | |
| Kruskal-Wallis H | .053 | 2.112 | .642 | .308 | .076 | .334 |
| df | 1 | 1 | 1 | 1 | 1 | 1 |
| Asymp. Sig. | .818 | .146 | .423 | .579 | .783 | .563 |
Figure 10: Kruskal-Wallis Analysis
For the data produced by the Kruskal Wallis Test, we assume a significance level of.05. If the asymptotic significance is less than or equal to.05, the medians between samples are statistically significant, and the null hypothesis is rejected. However, if the value is more significant than.05, the differences between the medians are not statistically significant (Kruskal-Wallis tests in SPSS). Therefore, the results for each question are interpreted as follows:
M1: H (1) =.431, p =.512 — No statistical significance
M2: H (1) =.004, p =.951 — No statistical significance
M3: H (1) =.002, p =.963 — No statistical significance
M4: H (1) =.129, p =.719 — No statistical significance
M5: H (1) =.363, p =.547 — No statistical significance
M6: H (1) =.309, p =.579 — No statistical significance
M7: H (1) =.735, p =.391 — No statistical significance
M8: H (1) =.173, p =.678 — No statistical significance
M9: H (1) =.219, p =.640 — No statistical significance
S1: H (1) =.009, p =.925 — No statistical significance
S2: H (1) =.357, p =.550 — No statistical significance
S3: H (1) = 1.123, p =.289 — No statistical significance
S4: H (1) =.216, p =.642 — No statistical significance
S5: H (1) =.004, p =.949 — No statistical significance
S6: H (1) =.045, p =.832 — No statistical significance
S7: H (1) = 1.370, p =.242 — No statistical significance
S8: H (1) = 1.203, p =.273 — No statistical significance
S9: H (1) =.768, p =.381 — No statistical significance
ET1: H (1) = 1.486, p =.223 — No statistical significance
ET2: H (1) =.848, p =.357 — No statistical significance
ET3: H (1) =.084, p =.772 — No statistical significance
ET4: H (1) =.053, p =.818 — No statistical significance
ET5: H (1) = 2.112, p =.146 — No statistical significance
ET6: H (1) =.642, p =.423 — No statistical significance
ET7: H (1) =.308, p =.579 — No statistical significance
ET8: H (1) =.076, p =.783 — No statistical significance
ET9: H (1) =.334, p =.563 — No statistical significance
After conducting the Kruskal Wallis Test, it is determined that for all responses, the asymptotic significance is greater than or equal to the significance level,.05. This allows the researchers to know there is no statistical difference between the medians from the survey data before and after the intervention. Therefore, the null hypothesis cannot be rejected. Therefore, conducting inferential statistics analysis is highly beneficial when comparing two datasets.
d) Correlation Analysis
Data gathered from the 9th-grade female students leads us to assume their abilities and feelings toward math, science, engineering, and technology remain the same. This data can further be interpreted with correlation analysis. Correlation analysis measures the strength of the relationship between variables. A high correlation indicates a strong relationship between the variables. The four areas of STEM are categorized into three groups: math, science, engineering, and technology. The results from the study can be used to determine if there is any connection between students' abilities and attitudes throughout each subject. For
instance, does a student who responds positively to "I like math" also react positively to "I am good at math"?
Correlation analysis can be performed through several methods, the most popular being the Pearson and Spearman correlation. Both ways identify a degree of association between variables. However, the Spearman correlation is a non-parametric test suitable for ordinal data. For this analysis, the Spearman correlation is conducted with two questions simultaneously, ensuring one relates to ability and feelings. The questions will also be from the same subject. Finally, the compared questions have the same perspective, meaning they must be either positive or negative.
Two statements from each subject are compared to determine the correlation between students' attitudes and abilities. For mathematics, "I like
math” (M1) and “I can get good grades in math” (M8) are analyzed. The science questions included are “I am sure of myself when I do science” (S1) and “I would consider a career in science” (S2). Lastly, the questions considered for engineering and technology are “I like to imagine creating new products” (ET1) and “I am good at building and fixing things” (ET3).
Several aspects of the resulting analysis can be used to determine the strength of the association between variables. A correlation coefficient is a number that lies between -1 and +1. A positive correlation coefficient indicates a positive relationship, while a negative correlation coefficient signifies a negative relationship. A value of 0 allows the researchers to know that no connection exists. The significance value is another important attribute, enabling one to understand if the result is statistically significant.
Correlations
Figure 11: Spearman's Correlations for Math
| M1 | M8 | |||
| Spearman's rho | M1 | Correlation Coefficient | 1.000 | .865** |
| Sig. (2-tailed) | . | <.001 | ||
| N | 55 | 55 | ||
| M8 | Correlation Coefficient | .865** | 1.000 | |
| Sig. (2-tailed) | <.001 | . | ||
| N | 55 | 61 |
The correlation coefficient at the cross-sections of the questions,.865, is essential to note. This denotes a positive relationship between people who like math
and people who can achieve good grades in math. The significance level of further supports this result.
Correlations
Figure 12: Spearman's Correlations for Science
| S1 | S2 | ||
| Spearman's rho | S1 | Correlation Coefficient | 1.000 |
| Sig. (2-tailed) | . | ||
| N | 61 | ||
| S2 | Correlation Coefficient | .926** | |
| Sig. (2-tailed) | <.001 | ||
| N | 61 |
The coefficient of.926 indicates a high positive correlation between students who are sure of themselves in science and would consider a career in science. Once again, the significance level, , supports the correlation.
Correlations
| ET1 | ET3 | |||
| Spearman's rho | ET1 | Correlation Coefficient | 1.000 | .884** |
| Sig. (2-tailed) | . | <.001 | ||
| N | 60 | 59 | ||
| ET3 | Correlation Coefficient | .884** | 1.000 | |
| Sig. (2-tailed) | <.001 | . | ||
| N | 59 | 60 |
Figure 13: Spearman's Correlations in Engineering
The correlation coefficient,.884, reveals a positive relationship between students who like to imagine creating new products and those who are good at building and fixing things. Once more, the significance level of agrees with this correlation.
Identifying correlations between variables is crucial for many research problems. For example, assessing this data for correlation allows us to know if a positive relationship exists between the sample students' feelings toward a particular subject and their ability. This leads us to assume that one with positive feelings toward an issue will likely perform well, and students with negative feelings toward a matter presumably do not perform well.
IV. CONCLUSION
This study aimed to introduce various science-related topics to young, primarily Hispanic female students in a Title I high school. This was accomplished through weekly STEM workshops with the faculty presenters from the College of Education and the College of Arts and Sciences.
Specific steps included:
- The principal and his leadership team identified a purposive sample of 37 9th-grade female students meeting the required demographic characteristics to participate in the study.
- At the first meeting, students completed the S-STEM. The survey was also conducted at the end of the 15th-week workshop.
Fifteen weekly STEM lessons were scheduled with the ninth-grade female students. Since the ongoing study, researchers have limited S-STEM data and no data from students involved in the project management classes. To analyze the S-STEM data in the most meaningful manner possible, researchers compared the data collected at the beginning of the -grade study to that of the end of the project.
Most researchers will agree that a study's validity lies in identifying an appropriate research problem, developing a robust methodology, strict adherence to the methods during implementation, proper data analysis, and an accurate interpretation of the results. If these guidelines are strictly adhered to, the results of a study are strongly supported.
Studies cannot be invalidated; instead, we must recognize threats to our results' validity and try to control them in the best manner possible. In this case, a sound study was designed and implemented. However, given the ongoing issues in online classrooms and their effect on students, teachers, and administrators, we must continue researching this area.