Ant colony optimization (ACO) algorithm can be used to solve combinatorial optimization problems such as the traveling salesman problem. In this work, an endeavor has been taken in finding the proper algorithm which could be used for routing problems in different real-life situations. Taking into due cognizance of the limitations of the existing routing system, the outcome of this work will facilitate a more convenient way of finding destinations for the users in term of accuracy and time over the existing routing systems. The cost of the program will also be lesser than contemporary systems. To accomplish this, a system has been built that can take a map image with source and destinations denoted; and find an optimal path for them. The work has been concluded with suggestions to future researchers who might look to build a system that can solve any type of routing problems using TSP.
## I. INTRODUCTION
Vehicle routing problems are one of the most basic problems for any traffic control system or delivery system; especially in an overpopulated and traffic congested country like Bangladesh, where traffic jam is a common phenomenon. Bangladesh has a massive population compared to other nations of similar size. Moreover, those populations are not evenly distributed in all parts of the territory. As a developing nation, it is only natural that most people gravitate towards the cities, be it for economic or social reasons. This also creates a demand for mass transportation, since a modern city can't function without it. Unfortunately in the case of Bangladesh, this was done haphazardly and without proper planning. This resulted in huge numbers of private transports and a distinct lack of mass public transit infrastructure. Thus, an application that can help regular people plan their routes more efficiently can mitigate the effect of traffic jam in Bangladeshi cities. Such an application has to be easy to use since it is meant to be used by the general populace, many of whom lack technical literacy.
It also presents a good opportunity for the stakeholders since there is no other alternative solution currently popular in the local market. The use of the application can cut down both time and fuel cost for the users. It is therefore, easy to believe that people will be willing to pay a small fee to access such a service. The users of such an application are most likely to be ordinary drivers and travelling salesmen or delivery boys. Such users tend to be in a hurry when plying their services. They don't tend to plan their routes in any way. They simply take a look at their map, choose the closest destination at hand and repeat the process till they complete their shift. Thus the application needs to be both efficient and simple to use. For that reason, Ant Colony Optimization algorithm has been chosen. As a regular user is unlikely to use more than 15-20 destinations per work shift, it can solve such small sets quickly compared to most other algorithms we tested. Thus, the algorithm should be a great fit for the purpose of this work. This service has been built in the context of Bangladesh, but can be used anywhere with similar problems. Traffic congestion is not only an annoyance. It has economic consequences. Due to sitting in traffic jam, the fuel cost of trips increase. It also wastes a lot of time for every trip. The average commuter in Dhaka city spends about $55\%$ of his time sitting in traffic [1]. This causes a massive loss in working hours. According to a survey in 2018, the traffic congestion in Dhaka is wasting around 3.2 million working hours daily [2]. According to a study conducted in 2016, the total congestion cost for the Dhaka city is 12561.296 million USD. Considering the country's total population, per capita congestion cost is 78.50 USD and if we consider only Dhaka city's population, the per capita congestion cost stands 785.00 USD [3]. Previous work in this sector includes various applications in telecommunication network such as circuit and packet switch networks, mobile networks, industrial scheduling problems and assembly line balancing problems. The proposed work aims to fill the gap that exists here regarding vehicle routing problems in general. Preliminary testing shows that the algorithm can achieve up to $24\%$ efficiency in distance cost. This work provides a framework on how such a service can be provided and some data on how it will help both the users and stakeholders economically. Future researchers can use this work as a template on building the proper digital infrastructure needed to alleviate the congestion from roads, not only in Dhaka but any location that suffers from similar problems.
## II. CONSTRUCTING THE APPLICATION
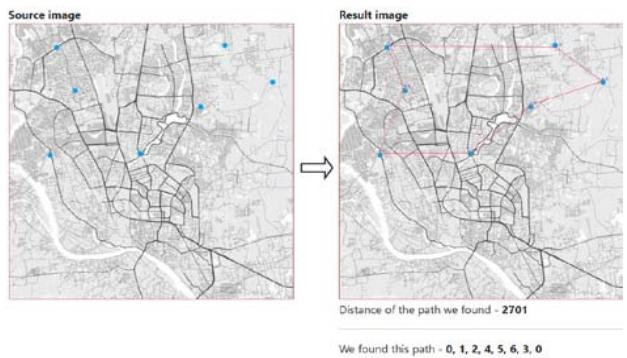
The algorithm needed an interface to be able to solve real life tsp problems. We built a web application by php language for that purpose. The application uses laravel framework. It receives data from an API simulated via another php library [4]. Both applications have to be run simultaneously for the simulation to work. We built up the input to be used for the API application. We first took a map of Dhaka city. The API recognizes nodes to be of a different colour from the map background. Thus, we picked a black and white map. We use the colour blue as the node colour. The specific RGB code for the colour is (0,163,232). This is important because the API has an option for specifying the colour of the nodes. If the colour does not match up, the data does not get properly rendered. A user can change the colour code according to his need. Or they can simply pick the option that says: "The colors of nodes on a graph are different from background color". This forces the API to analyze the image for background colour and any differences in the image. But this process is often not reliable and has been noted to fail during testing. User discretion is advised. The input image is then analyzed by the application. It can accept anywhere from 2 to 500 nodes. An average user is unlikely to need that many destination points. For that and also for the sake of simplicity, we chose 7 nodes over different parts of the map. The image would be used as a template by the algorithm to generate a second image. The newly generated image will have paths denoted between the nodes. The paths also have an approximate weight value calculated by the algorithm. The algorithm uses this new weighted graph format to calculate the most optimal path of travel for the user.
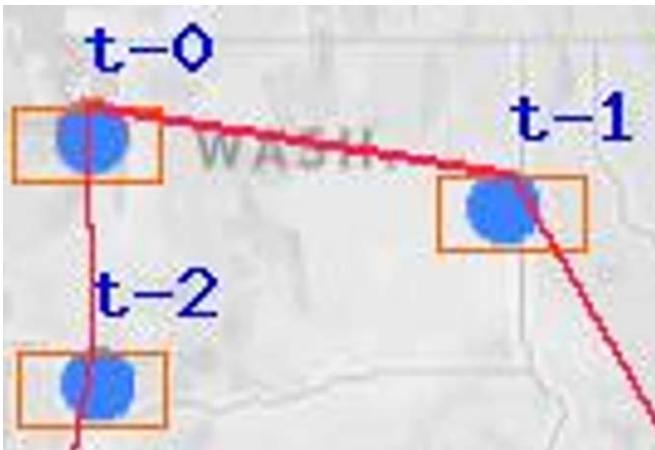 Fig. 1: Nodes and Weight Value Calculation
The starting node is denoted by zero. Each closest node is given a number of its own and denoted in numerical order. Each node represents a destination, with the node t-0 being an exception. It is considered to be the starting point of the journey. Subsequent nodes are denoted as t-1, t-2 etc. based on a rough estimation of the distance between them. As an example, a map with 7 nodes will have the following nodes: t-0, t-1, t-2, t-3, t-4, t-5 and t-6. Once the nodes and weight paths are calculated, the algorithm uses the data to internally construct a data matrix. It uses this data to calculate the most optimal path to travel from node t-0 to all the other nodes and then come back to t-0. It presents us with the result which includes the total distance covered by the vehicle and also which path is optimal to be travelled. The path should always start and end with the node 0. The distance between the nodes is not calculated in any specific unit, but a numerical value. That is because the algorithm does not have a sense of scale and can't find out the distance between two nodes by simply looking at the map. Attempts had been made to specify the distance between the first two nodes and use it as a scale for the rest, albeit unsuccessfully. This is one of the major limitations of the current work. However, it still informs a user which path is the most optimal. A user can compare the value of distance for multiple paths using the same map. It is not the smoothest way to compare routes, but it gets the job done. Another gap in the work is the inability of a user to update his path in the middle of a trip. In real life, the situation of the road changes with time. A road that was open moments ago can be clogged with traffic in minutes. This isn't even taking into accounts events like accidents or temporary closure of a road. In that case, the weight value of a chosen path should also change. But the system lacks any automatic update service that can alter the value of the trip once it has begun. To achieve that we would require a service that provides GPS update to the users in real time. It would also have to be compatible with the web application. We were unable to find such a service. The best way a user can achieve that goal is to manually input an image of the map after reaching every
destination. This is cumbersome for an average user. It would also slow down the trip as the web application would have to calculate the optimal path every time a destination is reached. So this work does not include such a feature. It has been left for future researchers to fill that gap. They can work in conjunction with companies that provide Geolocation service to develop an application that can receive data in real time. Or if they are ambitious enough, they can even develop their own geolocation service that has such a feature. In any case, such an endeavor is beyond the scope of our work. Currently services like google map calculate routes by measuring the shortest distance between two nodes. Any further destinations are measured only after reaching the first destination. Then the shortest distance to the next destination is calculated and thus it goes on and on. This format of travelling is called greedy best first search. And it gives suboptimal results in almost every case, since the user is just travelling without any consideration to future travel. As an example, we can consider the bays29.tsp dataset in order to find the most optimal algorithm for our system [5]. If we simply calculate the closest distance from one node to the next, then we get a distance of 6173 just to travel from the starting node to the final destination. In order to get back to the source, that distance is doubled, so the total distance travelled is 12346. Even if we calculate the total distance randomly from another starting point, the best result we can get is 4955, which if doubled amounts to a distance of 9910.
Table 1: Calculating Distance by Best First Search Method (Bays29.Tsp))
<table><tr><td>Distance</td><td>Distance</td></tr><tr><td>167</td><td>0</td></tr><tr><td>79</td><td>107</td></tr><tr><td>77</td><td>241</td></tr><tr><td>205</td><td>190</td></tr><tr><td>97</td><td>124</td></tr><tr><td>185</td><td>80</td></tr><tr><td>435</td><td>316</td></tr><tr><td>243</td><td>76</td></tr><tr><td>111</td><td>152</td></tr><tr><td>163</td><td>157</td></tr><tr><td>322</td><td>283</td></tr><tr><td>238</td><td>133</td></tr><tr><td>206</td><td>113</td></tr><tr><td>288</td><td>297</td></tr><tr><td>243</td><td>228</td></tr><tr><td>275</td><td>129</td></tr><tr><td>319</td><td>348</td></tr><tr><td>253</td><td>276</td></tr><tr><td>281</td><td>188</td></tr><tr><td>135</td><td>150</td></tr><tr><td>108</td><td>65</td></tr><tr><td>332</td><td>341</td></tr><tr><td>342</td><td>184</td></tr><tr><td>218</td><td>67</td></tr><tr><td>350</td><td>221</td></tr><tr><td>39</td><td>169</td></tr><tr><td>263</td><td>108</td></tr><tr><td>199</td><td>45</td></tr><tr><td>0</td><td>167</td></tr><tr><td>Total: 6173</td><td>Total: 4955</td></tr></table>
On the other hand, the ACO implementation of the same dataset generates a distance between the ranges of 9390 to 9612. These values were found by using a java program that takes a fixed dataset and calculates the shortest path. The program is fairly basic and has no option to process image files. It had been slightly modified to give time and memory cost as parts of the result. The original code can be found in the following link: https://github.com/LazoCoder/Ant-Colony-Optimization-for-the-Traveling-Salesman-Problem [6].
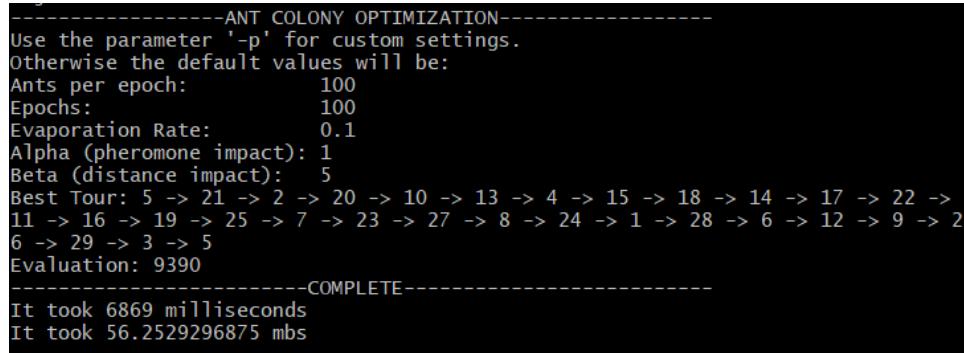
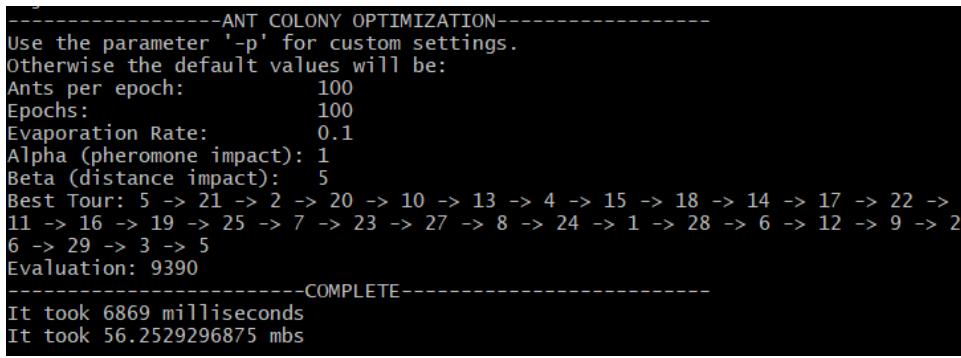 Fig. 2: ACO Run on Bays29.tsp (instance 1) Fig. 3: ACO Run on Bays29.tsp (instance 2)
If we take 12346 as the highest range for greedy search, 9390 is $76.05\%$ of that value. If we take 9910 as the lowest range for greedy search, 9612 is $96.99\%$ of that value. This gives us an efficiency rating anywhere between $3\%$ and $24\%$, depending on the situation. We are using a range instead of a flat number because there is a factor of randomness in ACO iterations. It may not always give the best results. But the risk is acceptable considering the benefits. So we can clearly see that even the worst result from ACO is better than the best result obtained by simply travelling blindly through the nodes. And it is obtained in a very small amount of time, 3-6 seconds. The memory consumption is also low, around 55-56 mbs. Thus, we can achieve an efficiency of $3 - 24\%$, just by spending a little bit of time and memory space. A $24\%$ efficiency rating is unlikely to be replicated in real life due to issues like human error and fuel inefficiency inherent to every vehicle. So we considered $15\%$ as a realistic estimate for calculating fuel cost efficiency in previous sections of the paper. Let the cost of travel for not using an algorithm be A. Let the cost of travel for using ACO be B. Let P be the percentage of reduced cost. Let C be the cost of fuel per unit. Let S be the saved cost in BDT. Thus the final formula for cost efficiency stands at:
$$
((C/100)) \times ((100 \times B) / A)
$$
## III. INTEGRATION WITH THE WEB APPLICATION
The web application would serve as a user friendly interface for our system. Since our focus was on proving the usefulness of the system, the front end of the web application was designed to be fairly basic. A simple login and registration system at the top are the only usable part of the page. A user has to register himself with his name, email and password to access the system.
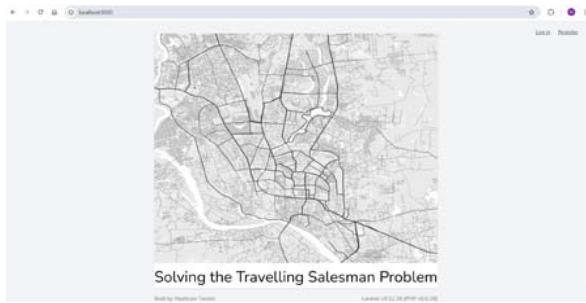 Fig. 4: Landing Page of the Web App
The dashboard page was designed to have only 2 menus; the dashboard itself and the map api. A user could also check his profile by clicking on the ribbon on the top right corner of the screen. He could edit his profile, change his password, log out or even delete his account from there. The map option was designed to take a user to a page with an input form.
The input could accept image files and send it to the api part of the system. Once an image file was selected, a user would press the upload button. The interface would then send that image file to the API and also keep a copy of the file in its own storage. After the file is saved on the map api, the interface would automatically redirect itself to the path finding system.
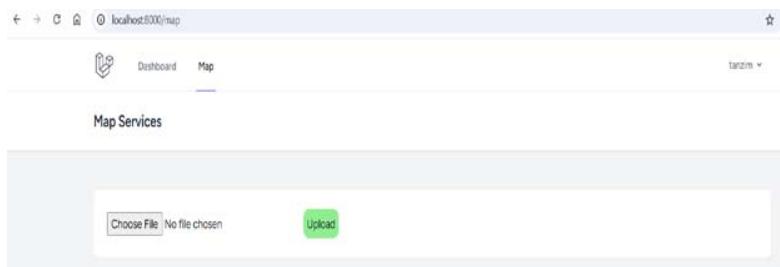 Fig. 5: Map API
Once on the system, a user can check his previously uploaded maps on a list. The maps can be deleted if deemed unnecessary. New image files can also be directly uploaded by an input system on the right side of the page. The users can go back to the interface by clicking on the option "Go back to Main Page". It would take them back to the dashboard page.
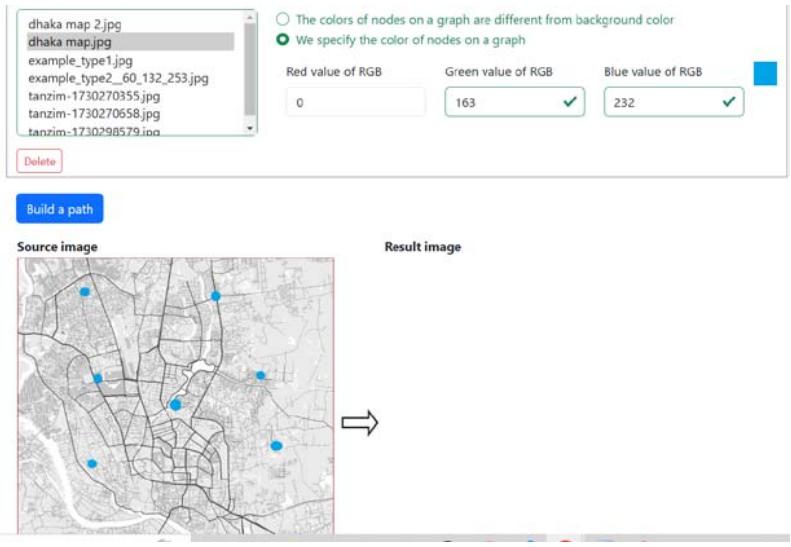 Fig. 6: Building an Optimal Path
The users can select a map from the stored files and specify how nodes would be detected on the image. If a user selects the option to specify the colour of the nodes, three additional input boxes would appear. They would take the RGB value of the colour the nodes are expected to represent. Once that is specified, clicking on the button "Build a path" would activate the algorithm and generate an optimal route through the nodes.
 Fig. 7: Result of Path Calculation
Once the nodes and weight paths are calculated, the algorithm uses the data to internally construct a data matrix. It uses this data to calculate the most optimal path to travel from node t-0 to all the other nodes and then come back to t-0. It presents us with the result which includes the total distance covered by the vehicle and also which path is optimal to be travelled. The path should always start and end with the node 0. The distance between the nodes is not calculated in any specific unit, but a numerical value. That is because the algorithm does not have a sense of scale and can't find out the distance between two nodes by simply looking at the map. Attempts had been made to specify the distance between the first two nodes and use it as a scale for the rest, albeit unsuccessfully. This is one of the major limitations of the current work. However, it still informs a user which path is the most optimal. A user can compare the value of distance for multiple paths using the same map. It is not the smoothest way to compare routes, but it gets the job done. It has been left for future researchers to fill that gap. The interface was published in a public site. It was able to function with data inputs in real time. The codes for all the algorithms used for our testing was also published accordingly.
Web application interface code:
https://github.com/navintanzim/acov1
Map API code:
https://github.com/navintanzim/aco-php
A demonstration video showing the whole process step by step is located at:
https://github.com/navintanzim/acov2/blob/main/demo%20video.wmv
## IV. DISCUSSION AND ANALYSIS OF RESULT
We calculated multiple distances of optimal paths by using ACO. We also calculated multiple distances without using any algorithm. We found that the highest distance measured for solving the bays29.tsp dataset without using any algorithm is 12346. And the lowest cost for the same dataset using ACO is 9390. Thus, the percentage of distance reduced becomes:
$$
Percentage = (100/12346) \times 9390 = 76.0570225174 \%
$$
We then used the lowest distance value calculated with the algorithm and compared it to the highest distance value calculated without any algorithm. Using the same formula to calculate the percentage of reduced path, we got:
$$
\text{Percentage} = (100 / 9910) \times 9612 = 96.9929364279 \%
$$
So, the best efficiency rating we could calculate was: (100 - 76.0570225174) = 23.9429774826%.
And the worst we could find was:
$$
(100 - 96.9929364279) = 3.0070635721%
$$
Since these are fringe values, we consider a middling $15\%$ as a more realistic efficiency rating.
The java implementation of ACO was unsuitable for integration into a web framework. So a new implementation by php was built. This system consisting of a user interface and an API uses an image input to find the optimal path. It gives an optimal path in only a few microseconds. Such as:
Calculation Time (in microseconds) - 0.0024600029
The total time taken to calculate the shortest distance and generate a map for it was found to be anywhere from 4 to 7 seconds. From previous testing, we knew that the efficiency rating of using ACO was 15 on average. Using the formula for cost efficiency equation mentioned in chapter 2, we calculated the cost efficiency of fuel usage per litre of ocane. We used BDT 125 as the price point for a litre of octane according to the latest govt. mandated price [7]. The cost efficiency became:
Cost efficiency $=$ (cost per unit of fuel/100) X efficiency rating $=$ (125/100) x 15 = 18.75 taka/litre
We could safely assume that the measurements taken were mostly correct. While not perfect, the ACO algorithm has been considered to be fairly accurate. It aids in extracting logical information from credit data with over $80\%$ accuracy [8]. We also searched for how much fuel an average travelling salesman might use per day. Unfortunately, we found no available statistics on that. The best information found by visiting online forums was that a sedan running on natural gas might spend 1000 taka per day. But this is not sufficient to calculate a profit margin, simply because octane and natural gas have different mileage and there are all kinds of vehicles on the streets. A motorbike won't have the same fuel cost as a sedan. Without proper survey, it is not possible to calculate this. We leave it for future researchers to do so if they wish.
## V. CONCLUSION
Traveling salesman problem is one of the most important problems faced by vehicle routing procedures. Choosing the appropriate algorithm for a situation is necessary. In real life, the condition on the road can change at any moment due to unforeseen circumstances. In that case, the proper algorithm must be implemented to find the quickest route efficiently. This paper is a step forward in the effort to find the most practical solution to resolve the issue of traffic congestion. It demonstrated a practical implementation of ACO to find the most optimal path for a travelling salesman. It can function as a blueprint for future services that can automatically update the routes based on traffic congestion data received from satellites. However the work has certain limitations as well. The programs used in this work can handle only certain types of datasets. It can't use all forms of data as input. For that reason, the pool of available datasets was very limited and this research was forced to test the programs on only 2 different datasets. It also lacked the ability to update the routes based on traffic congestion automatically. The update had to be done manually by a user. Future researchers can work on these aspects to further improve the usefulness of the system.
Generating HTML Viewer...
References
3 Cites in Article
Khonika Khaled,& Mustafizur,Syed (2012). Possible Causes & Solutions of Traffic Jam and Their Impact on the Economy of Dhaka City.
Moutusi Tanha,Akib Mahumd,Mahfuza Sultana,Tozim Chakma,Emam Hassan,Sajid Mabud,Md. Razon,Sheikh Parvez,Azmol Joy (2016). Self and counterfeit consumption in emerging markets.
Li Cheng (2023). Ant colony optimization algorithm in the design of international trade early warning system.
Explore published articles in an immersive Augmented Reality environment. Our platform converts research papers into interactive 3D books, allowing readers to view and interact with content using AR and VR compatible devices.
Your published article is automatically converted into a realistic 3D book. Flip through pages and read research papers in a more engaging and interactive format.
Ant colony optimization (ACO) algorithm can be used to solve combinatorial optimization problems such as the traveling salesman problem. In this work, an endeavor has been taken in finding the proper algorithm which could be used for routing problems in different real-life situations. Taking into due cognizance of the limitations of the existing routing system, the outcome of this work will facilitate a more convenient way of finding destinations for the users in term of accuracy and time over the existing routing systems. The cost of the program will also be lesser than contemporary systems. To accomplish this, a system has been built that can take a map image with source and destinations denoted; and find an optimal path for them. The work has been concluded with suggestions to future researchers who might look to build a system that can solve any type of routing problems using TSP.
Our website is actively being updated, and changes may occur frequently. Please clear your browser cache if needed. For feedback or error reporting, please email [email protected]
Thank you for connecting with us. We will respond to you shortly.