## I. BACKGROUND
There are numerous definitions of wellbeing, however, Robert Wood Johnson Foundation put forward a compelling definition, thus: "the comprehensive view of how individuals and communities experience and evaluate their lives, including their physical and mental health and having the skills and opportunities to construct meaningful futures" (Robert Wood Johnson Foundation, 2019, para.2). Public health leaders in the United States have placed greater emphasis on well-being as a key indicator of population health (Anderson et al., 2022a) because early childhood care and educational experiences, broader neighborhood educational contextual factors, and local institutions all play a role in shaping a child's educational opportunities that promote positive development, with lasting effects into adulthood (Noelke et al., 2020).
The United Nations Convention on the Rights of the Child (UNCRC) defines a child as "anyone under the age of 18" (United Nations, 2024). Bunting et al. (2022) defined youth as individuals within ages 11 and 19. However, the Youth Progress Index Report (2023) pointed out that no one clear definition of "youth" exists and our society's responsibility to educate, support, and engage youth does not end once they are 18. The challenges facing our youth tend to impact them well into adulthood.
Youth or child wellbeing is a topic that has been researched through many different lenses. According to Cho and Yu (2020), indices are "composites of different indicators or dimensions of children's lives that reveal their overall wellbeing, so that a comparison across time or place can be conducted" (p.3). Child wellbeing can be conceptualized into objective and subjective wellbeing. Objective wellbeing uses statistical indicators to measure external conditions of life such as material resources and living environment. Long and Huebner (2013) highlighted some examples of objective indicators of wellbeing, which include socioeconomic status and neighborhood characteristics. Conversely, subjective wellbeing encompasses the psychological and cognitive elements of an individual (Cho and Yu, 2020).
Additionally, the needs of children are not unidimensional but consist of a range of material and non-material resources across multiple dimensions such as race, economic inequality, housing affordability, family structure, parental social capital, diet quality, and physical activity (Cho and Yu, 2020). However, recent research provides evidence that the effect of neighborhood factors including early childhood educational experiences, depends on a Childs age (Noelke et al., 2020). Hence, our study focus is Elementary schools in the United States, which extends from kindergarten (grade k) through 5th grade (ages 5-10).
Subsequent sections of the background highlight factors that influence child wellbeing, existing tools for measuring Virginia Child Wellbeing Index, validation of existing tools in the literature, geographical level of computing Virginia CWI, assessing the predictive utility of Virginia CWI, and justification for the study.
### a) Factors that Influence Child Wellbeing
Numerous factors impact child wellbeing. First, poverty has a profound impact on youth, including poorer performance in school, increased exposure to crime, and increased likelihood of health problems (Reed, 2020). Families with lower income are not able to put their children in high-quality schools which is problematic because education has proven to be a good predictor of social mobility, employment, and income. In the U.S., public schools are primarily funded through local property taxes. More affluent neighborhoods contribute higher taxes to funding for school systems, and the reverse is true for lower-income neighborhoods. School districts with high levels of poverty spend $15.6\%$ less per student compared to affluent districts (Reed, 2020). Mayer et al., (2000) also described the link between poverty and teacher quality, the authors highlighted that "High-poverty schools and high-minority schools have a disproportionately high share of inexperienced teachers relative to low-poverty and low-minority schools; and high-poverty schools have a disproportionately high share of academically weak teachers relative to low-poverty schools" (p. 14).
Economic status also has an impact on children's school performance. Data from the National Household Education Survey revealed that poor children in grades one through three are nearly three times more likely to repeat a grade (Ritter, 2015). Children from families in the bottom quintile of the income distribution are more than four times as likely as those from families in the top quintile to have dropped out of school in the past year (Ritter, 2015).
Secondly, in order to excel and succeed in later years of education, children need to have good opportunities in elementary school. There are some indicators that can help measure the likelihood of a student graduating on time from high school. According to Ritter's (2015) study of on-time high school graduation, three general factors can be used to collectively predict on-time graduation: 1) Economic, 2) Demographic, and 3) Student Characteristics. Ritter (2015) concluded that ninth grade is the most critical year for determining on-time graduation. Some of the factors that influence on-time graduation include: had a GPA of 2.5 or higher in grade 9, failed one or fewer semester courses, were absent fewer than eight days, were never suspended prior to grade 9, and never moved between schools during middle school. Additionally, Ritter (2015) found that the following factors were weak but statistically significant in decreasing the likelihood of graduating on-time: Free and Reduced-price Meals System (FARMS) status, suspension, number of days absent during grade 9, and school mobility. Another study confirmed that a student's performance in the first semester and first year of high school is key to predicting on-time graduation (Allensworth & Easton, 2005). On-time graduation can be an important measure of a child's well-being and later success.
The strongest indicators of a student's on-time graduation include family socioeconomic status, family structure, family stress (death, divorce, family moves), and the mother's age (Ritter, 2015). Students who come from low-income families, who are the children of single, young, unemployed mothers, or who have experienced high degree of family stress are more likely than other students to drop out of school (Ritter, 2015). Of those characteristics, low socioeconomic status has been shown to bear the strongest relationship to a student's tendency to drop out (Ritter, 2015). When it came to predicting on-time graduation of high school freshmen, researchers found that being on- or off-track at the end of freshman year was a far more reliable indicator of graduation than eighth grade test scores (Allensworth & Easton, 2005). While our study does not deal with on-time graduation rates, our goal was to test if some of the child wellbeing indicators mentioned above could be used to predict SOL scores.
Additionally, disability and special care needs influence children's wellbeing. Children with disabilities represent a diverse group of conditions that range from mental and behavioral diagnosis to special healthcare needs and learning disabilities. The National Survey of Children's Health reported that one in five children in the United States have special health care needs (Annie E. Casey Foundation, 2024). The National Center for Education Statistics reported that $15\%$ of U.S public school students received special education services for disabilities in the year 2022-2023 (Annie E. Casey Foundation, 2024). These children are more likely to experience challenges academically, socially, emotionally and in other areas when compared to children without disabilities or special healthcare needs
(Annie E. Casey Foundation, 2024). Only one in four children with special health needs are consistently engaged in school. (Annie E. Casey Foundation, 2024). In addition to school absences, children with chronic medical illnesses and activity restrictions, may be unable to participate in extra-curricular activities and feel isolated from their peers, which may ultimately affect the emotional /psychological wellbeing of the child (Howard & Latella, 2024). Families of children with disabilities or special care needs have higher rates of household food insufficiency, challenges with paying for the child's medical expenses, and more difficulty meeting basic needs (Annie E. Casey Foundation, 2024).
Furthermore, school climate and structure play a significant role in whether students succeed in high school (Allensworth & Easton, 2005). Ahmmed et al., (2022) argue, as do many other researchers, that teacher quality is tied directly to school quality. They found that a teacher's experience, or lack thereof, is correlated to student learning outcomes. Technology-enhanced education is also a critical factor to student success, as is school leadership, particularly instructional leadership aimed at enhancing the quality of teaching and learning (Ahmmed et al., 2022). Arslan et al. (2022) examined and found that the Subjective Academic Wellbeing Measure (SAWM) was a reliable and valid measure that can be used to assess the positive academic functioning of students within the school context. We chose variables for our index based upon evidence in the literature and the availability of data.
### b) Existing Tools for Measuring Virginia Child Wellbeing Index
In addition to reviewing the general discussion on child wellbeing, we conducted a review of the existing approaches to measuring child wellbeing and examined which indicators are most frequently measured. In addition to various indicators under the economic and academic domains, existing indices typically assign indicators to physical, mental, and social health, quality of environment, and more. For example, under the domain for "Health and Environment", the Child Opportunity Index listed the following indicators: access to healthy food, access to green space, walkability, housing vacancy rate, hazardous waste dump sites, industrial pollutants in air, water or soil, airborne microparticles, ozone concentration, extreme heat exposure, and health insurance coverage (Brandeis University, 2020). Also, cognitive development, social and emotional competence, psychological & behavioral development, and physical health are domains proposed by the Children's Bureau and the U.S. Department of Health and Human Services (Biglan, 2024). Data on global youth mortality and inequality indicated that schools, parents, and communities play a crucial role in promoting the well being of youth because they directly impact youth's physical and social environment (Kassebaum et al., 2017). Similarly, the New Zealand Child and Youth Wellbeing Strategy used an even more extensive list of indicators to measure wellbeing in different areas (New Zealand Ministry of Social Development, n.d).
On the international scale, the 2017 Global Youth Well-being Index, created by the International Youth Foundation, measured successes and gaps for youth in 29 countries (Sharma et al., 2017). The index covered seven domains: gender equality, economic opportunity, education, health, citizen participation, safety and security, and information and communication technology. In this index, the U.S. ranked number five out of 29 countries. The U.S. scored poorly in the safety and security, health, and citizen participation domains (Sharma et al., 2017). The Youth Progress Index (2023) is another international-level measure. It used the methodology of the Social Progress Index and global data to measure the quality of life of young people in 150 countries (Youth Progress Index, 2023).
In the U.S. specifically, Land and Lamb (2014) created the Child and Youth Wellbeing Index (CWI) to measure quality of life of youths in some of the following domains: economic/material well-being, health, safety, productive activity, place in community/community engagement, intimacy, and emotional wellbeing. Many of the variables that we used in our analysis can be found in other studies of U.S. elementary schools and school districts, such as the Nebraska Education Profile created by the Nebraska Department of Education to compare schools and districts (Nebraska Department of Education, 2019). The Wellbeing Indicator Tool for Youth (WIT-Y) was created by Anu Family Services and the University of Minnesota's Center for Advanced Studies in Child Welfare and designed for youths who have been in contact with the child welfare system (Center for Advanced Studies in Child Welfare, 2015). The tool used surveys and questions to assess youth health in eight domains to evaluate wellbeing: safety and security, physical health, cognitive health, mental health, relationships, community, purpose, and environment (Center for Advanced Studies in Child Welfare, 2015). Drawing upon this literature, we chose to organize our indicators into ten domains inspired by the domains used in existing child wellbeing tools.
### c) Validation of Existing Tools in the Literature
Our review of the literature found various approaches to validating wellbeing indices/tools. To test the validity of a state-level Child Wellbeing Index (CWI), Annie E. Casy Foundation (2007) compared two state-level indices (a composite index of 10 indicators and a second index of 25 indicators). The comparison was intended to determine how well the 10-indicator index captured key state-level variations in children's quality of life reflected in the broader 25 indicator index. The second reason for the comparison was to determine why some state rankings showed marked differences between the 10 and 25 indicator child wellbeing indices. The Foundation found both indices were highly correlated $(+0.93)$. However, although the 10-indicator index was a good approximation of children's overall quality of life, two indicators captured in the 25-item index (emotional and spiritual well-being, and safety and behavioral factors) were weakly or negatively correlated with the 10-item index (Annie E. Casy Foundation, 2007).
Another approach to validating a wellbeing index was utilized by Wong et al., (2022) who conducted three different regression analyses with the overall family wellbeing index as the predictor and Q24, Q25, and combined Q24 & Q25 as outcomes. The results showed that the overall index had a significant predictive utility on the gauging items. Additionally, the authors examined the predictive utility of the six-domain version of the index on all three outcomes (Q24, Q25, and combined Q24 & Q25) and found statistically significant relationships (Wong et al., 2022).
Sehgal et al., (2024) created a Child Health Index (CHI) comprising of 16 variables under six domains, to characterize child health and detect child health inequities across 707 districts in India. As a validation step for the new tool, the researchers utilized the CHI to predict child mortality. The authors also examined the internal consistency of the variables (Cronbach alpha=0.7662). To examine the external validity of the CHI, the authors assessed the Pearson's correlation $(r = 0.736)$ between the CHI and "under five child mortality" which was described as a popular state-level indicator for measuring child health (Sehgal et al., 2024).
Riad et al., (2021) validated an educational wellbeing tool among young children ages 4 to 12 years. Similar to previous validation approaches, Riad et al., (2021) reported the psychometric properties of the wellbeing construct measured. For example, the researchers assessed reliability and construct validity and reported a moderate Spearman's correlation $(r_s = 0.62)$ and Cronbach's alpha $(r_a = 0.62)$. The authors concluded that the tool could provide firsthand information about children's wellbeing from the first years of education until elementary school (Riad et al., 2021).
Lastly, to validate the World Health Organization Well-Being Index, Nylen-Eriksen et al., (2022) examined the relationship between well-being, quality of life, social support, self-reported psychological distress, and perceived stress. Specifically, they ran correlation tests between WHO-5 and Oslo Social Support Scale 3 (OSSS-3), Multicultural Quality of Life (MQLI-3), Perceived Stress Scale (PSS-4), and Patient Health Questionnaire for Depression and Anxiety (PHQ-4). The analysis resulted in rejection of the null hypothesis for all four hypotheses (Nylen-Eriksen et al., 2022). The authors concluded that the WHO-5 tool is a psychometrically robust and validated instrument with excellent reliability and construct validity. For example, the authors found a strong negative correlation between perceived stress and psychological stress and wellbeing (spearman's correlation coefficient of -0.706 and -0.736 respectively). The tool was also validated for convergent validity (Nylen-Eriksen et al., 2022).
### d) Geographical level of Computing Virginia CWI
The geographic level at which an index measures wellbeing is an important consideration. As described above, some existing indices measure child wellbeing at the international level, others are measured at the national level. According to a report from the Nebraska Department of Education, elementary schools within the same school district can have varying levels of outcomes amongst their students (Nebraska Department of Education, 2019). To capture these differences, we measured wellbeing at the elementary school attendance boundary level instead of at the census tract or district level. Furthermore, an analysis of eight state-wide studies in South Carolina demonstrated that school size is sometimes correlated to student outcomes and school climate (Stevenson, 2006). If we had conducted our analysis at the district-level, we would have failed to capture differences in individual school size. In England, Gibbons and Silva (2011) used the Longitudinal Survey of Young People in England (LSYPE) to assess student and caregiver attitudes regarding school quality of around 600 schools.
### e) Assessing the Predictive Utility of CWI
To assess the predictive utility of Virginia CWI, we calibrated the tool with Virginia SOL (Standard of Learning) scores. The SOL tests for Virginia public schools is the official accreditation testing program that measures the success of students in meeting the Board of Education's expectations for learning and achievement across the Commonwealth's 132 school divisions (Virginia Department of Education, 2022). The Commonwealth of Virginia SOL testing system is a standardized test on a 200-600-point scale which assesses student academic achievement. Students take SOL tests at the end of core subjects (English, mathematics, science, history/ social sciences) taught in schools (Allen et al., 2015; Virginia Department of Education, 2022).
The SOL counts toward student graduation and teacher evaluation. A teacher evaluation system that is based upon student performance on the SOL assessments is utilized in Virginia (McCarty, 2015). The SOL is also used to determine if schools and school divisions have met federal standards required by the No Child Left Behind legislation (McCarty, 2015).
Evidence has shown that the "reliability" of SOL assessments is typical of a high-quality assessment, with Kuder-Richardson 20(KR-20) coefficient of 0.87 and 0.91 (Allen et al., 2015). Additionally, the test validity of SOL tests is supported by strong uni-dimensionality and observed correlations of between 0.50 to 0.80 with the Stanford 9 achievement tests (Allen et al., 2015). These favorable psychometric properties of the SOL test informed its use as an outcome measure to validate the Virginia CWI.
Additionally, published research by Longwood University Economist reported that a school's SOL pass rates are negatively impacted by having more numbers of students who are Black, Hispanic, and beneficiaries of free and reduced-priced lunch (Sharper, 2013). The authors found that for math and reading, the number of Black students and percentage of children eligible for free and reduced lunch were two best predictors of SOL pass rates. Similarly, large numbers of students who speak English as a second language significantly impacted test scores (Sharper, 2013). Some of the child wellbeing indicators incorporated in our tool are consistent with indicators reported by Sharper (2013) and provides additional support for using the Virginia CWI to predict SOL scores. Similarly, Noelke et al., (2020) reported that $3^{\mathrm{rd}}$ grade reading and math proficiency test scores reflect not only elementary school experiences, but also the broader set of early educational opportunities that children experience through their family settings and through local institutions such as after school programs, libraries, and community programs.
Furthermore, all students in tested grade levels and courses across the Commonwealth are expected to participate in the SOL assessment except exempt by federal law or by Board of Education regulations. Hence, the wide adoption across the Commonwealth favored its utilization as an outcome measure to test the predictive utility of our index.
#### Justification for the Study
Children, or youth, are a heterogenous population with unique, intellectual, emotional, physical, and social needs at different stages of development (Cho and Yu, 2020). The types and extent of resources provided by different systems of society to meet those distinct needs can differ, which may explain the divergence of child wellbeing outcomes. Hence, a knowledge of stage-specific status is particularly important for policymaking and planning (Cho and Yu, 2020).
Studies tend to examine children more broadly as a group and while a substantial number of studies reviewed later childhood, fewer studies reviewed early and middle childhood specifically (Cho and Yu, 2020). The scarcity of stage-specific data on children may explain the lack of published research examining the wellbeing of younger children, including children in elementary schools (Cho and Yu, 2020). We sought to tackle this gap in research by specifically measuring our CWI at the elementary school level. Therefore, we chose elementary schools in Virginia as our study population. Elementary schools in the United States extends from kindergarten (grade k) through 5th grade (ages 5-10).
In the absence of an existing tool that measured child wellbeing of elementary schools across the Commonwealth of Virginia, in 2024 the Office of Health Equity (OHE), Virginia Department of Health (VDH) sought to draw upon existing measures to create a Virginia Child Wellbeing Index (CWBI) for the entire state of Virginia. We utilized elementary school attendance boundaries as the geographic level of measurement, which had never been done in Virginia. We conducted a review of contemporary literature on measuring child wellbeing to determine what indicators would be most relevant.
In 2014, VDH created the Youth wellbeing index (YWBI) in order to measure the overall opportunity that communities provide to young people to live long and healthy lives (VDH Youth wellbeing index, n.d.). VDH's YWBI dashboard reported variables at the census tract level and consisted of 24 variables combined into eight indicators. The eight indicators were: crime, family stability, housing, population density, poverty, pre-K enrollment, primary care access, and psychiatrist access.
Hence, the primary aim of this study is to introduce the newly created CWI as an index for population-level monitoring of well-being among elementary pupils; justify the need for the tool, and highlight the methodology adopted.
The secondary aims are 2-fold: 1) Test the predictive utility of CWI by examining the relationship between indicators of the CWI and SOL scores by elementary school enrollment boundaries across the Commonwealth of Virginia 2) determine which of the CWI indicators are the strongest predictors of SOL scores in elementary schools in Virginia.
## II. METHODOLOGY
### a) Data Sources
We utilized 2017-2023 datasets sourced from the National Center for Education Statistics (NCES), the Virginia Department of Education (VDOE), and the Urban Institute (National Center for Education Statistics, 2023). Indicators in these datasets are currently available by either NCES-assigned school ID, school number, or school name. Prior to selecting the domains and their respective variables for Virginia's updated CWI, extensive research was conducted to determine indicators of child wellbeing, examples of existing wellbeing indices, and challenges to measuring child wellbeing. SOL datasets were also obtained from VDOE (Virginia Department of Education, 2022). We collected data at the elementary school enrollment boundary level for the Commonwealth of Virginia. Because we utilized de-identified datasets, IRB approval was not required for this study.
We employed data cleaning procedures to improve data quality of secondary datasets utilized. We treated missing data by imputing minimum values for each variable, except for variables that involved full time equivalents, in which case we replaced missing FTEs with zeros.
### b) Indicator Selection
For the purpose of developing a tool for monitoring and evaluating wellbeing at the population-level, researchers generally operationalize well-being by first obtaining data across a defined set of component measures and then aggregate the values into a single estimate in the form of an index (Anderson et al., 2022a). Cho and Yu (2020) found that the most frequently used domains were education, economic wellbeing, health, environment, housing, behaviors and risks/safety and socio-emotional wellbeing.
The CWI for elementary schools in Virginia was estimated from 10 domains, as follows: (1) School Climate/Environment (number of events of chronic absenteeism, school suspensions, behavior that presents a safety concern in schools, behavior related to school operations, behavior incidents involving relationships, behavior that impedes academic progress, and behavior that endangers self and others), (2) Student Teacher Ratio, (3) Socioeconomic (number of students eligible for free lunch, reduced lunch, and percent of students living in poverty), (4) Mental Health Support (number of FTE counselors, social workers, and psychologists), (5) Clinical Support (number of FTE nurses), (6) Instructional Support (number of FTE support staff, FTE instructional aides, and FTE administrators), (7) Teacher Quality (number of days that FTE teachers were absent and number of uncertified FTE teachers), (8) Per-Pupil Expenditure, (9) School Safety (number of FTE law enforcement/security guard personnel) and (10) Percent English Learners. It is worth noting that we chose not to include a health domain because our goal was to use the Virginal CWI as a predictor for health outcomes.
To understand the wellbeing of elementary school children within Virginia, we developed a multidimensional tool to assess relevant indicators of CWI across our study population. No single dimension of well-being stands as a reliable proxy for child wellbeing. Therefore, satisfactory measurements must quantify children's well-being as a multifaceted concept that takes into account the many areas that affect their well-being (Prada and Sanchez-Fernandez, 2022). Drawing upon this multi-dimensional perspective, we combined various aspects of child-wellbeing into a single measure.
Biglan (2014) reported that the three most important proximal influences on a child's development are the family, school and peers. Therefore, we considered different aspects of a child's well-being, including quality of education, school climate and socioeconomic proxies. Evidence shows that economic status and poverty, school district quality and area affluence, impact children's education and wellbeing (Biglan, 2014). We included the mental health support domain because early childhood experiences of trauma (emotional response to a terrible event) can predict poor mental health across the lifespan. Hence, the need for adequate access to trauma informed practices provided by mental health practitioners (U.S. Department of Education, 2021). Lerang et al., (2021) highlighted that students in classrooms with high instructional support learn and develop better than students exposed to low instructional support. On this premise, we included the instructional support domain.
We were guided by definitions provided on the Urban Institute data dictionary to operationalize the CWI indicators. For example, percent of students living in poverty is defined as the statistical estimate of the percentage of a school's students living in poverty, modified to align with a measure of the school district's poverty (Urban Institute, 2023). This estimate is the preferred statistic for analysis of large school districts across time or across states (Urban Institute, 2023). Another example is the operational definition for per pupil expenditure. The Virginia Department of Education reports annually on total per-pupil expenditures for public school operations by funding source for each school division and statewide (Virginia Department of Education, 2022).
The selection of domains and indicators was grounded in a comprehensive, cross-disciplinary literature review, and further informed by our local context in Virginia. Indicators were selected based on the following criteria: evidence from the literature, availability of reliable data at the school enrollment boundaries, and a variable's potential to inform public health interventions.
For concerns around ambiguity in directionality of relationships, we adopted contextual measures which are always causal factors (predictors) of wellbeing as opposed to individual-level factors which could be predictors or outcomes. For example, unhealthy behaviors such as smoking, or alcoholism could be an outcome of a child experiencing low subjective wellbeing but can also be a causal factor (Anderson et al., 2022).
Table 1: Child Wellbeing Indicators: Indicators & Domains
<table><tr><td>Indicators</td><td>Domains</td></tr><tr><td>Chronic Absenteeism (%)</td><td></td></tr><tr><td>Suspension Instances (%)</td><td></td></tr><tr><td>Behavior Related to Safety Concerns (%)</td><td></td></tr><tr><td>Behavior Related to School Operation (%)</td><td>School Climate/Environment</td></tr><tr><td>Behavior Incidents Involving Relationships (%)</td><td></td></tr><tr><td>Behavior that Impedes Academic Progress (%)</td><td></td></tr><tr><td>Behavior that Endangers Self and Others (%)</td><td></td></tr><tr><td>Student Teacher Ratio</td><td>Student Teacher Ratio*</td></tr><tr><td>Number eligible for Free Lunch</td><td></td></tr><tr><td>Number eligible for Reduced Lunch</td><td>Socioeconomic</td></tr><tr><td>Students living in Poverty (%)</td><td></td></tr><tr><td>Counselors FTEs</td><td></td></tr><tr><td>Social Workers FTEs</td><td>Mental Health Support</td></tr><tr><td>Psychologists FTEs</td><td></td></tr><tr><td>Nurses FTEs</td><td>Clinical Support</td></tr><tr><td>Academic Support FTEs</td><td></td></tr><tr><td>Instructional Aides FTEs</td><td>Instructional Support</td></tr><tr><td>Administration FTEs</td><td></td></tr><tr><td>Teachers Absent FTEs</td><td></td></tr><tr><td>Teachers Uncertified FTEs</td><td>Teacher Quality</td></tr><tr><td>Per-Pupil Expenditures ($)</td><td>Per-Pupil Expenditures</td></tr><tr><td>Law Enforcement/Security Personnel FTEs</td><td>School Safety Resources</td></tr><tr><td>English Learners (%)</td><td>Percent English Learners</td></tr></table>
### c) Data Analysis
We employed data cleaning procedures to improve data quality of secondary datasets utilized. We treated missing data by imputing minimum values for each variable, except for variables that involved full time equivalents, in which case we replaced missing FTEs with zeros. The statistical analysis was carried out using SPSS version 28.0. Our sample size was 1144 elementary schools in Virginia. We estimated the CWI for all elementary schools in Virginia. Subsequently, we tested the predictive utility of the tool by conducting a multiple regression analysis. We examined the relationship between indicators of the CWI and SOL scores and determined the strongest predictors of SOL scores. The alpha level of significance was set at 0.05.
### d) Computation of Virginia CWI
Our CWI consisted of 23 indicators grouped into 10 domains. Most of the component measures are not direct measures of wellbeing but rather proxy indicators of wellbeing. Indicators with a negative orientation (where a high value indicated a bad outcome) were standardized by transforming each indicator into z-scores. Each z-score was reverse coded by multiplying the z-score by (-1). Dimensional indices were then computed for each z-score. Conversely, an indicator with a positive orientation (where high values indicated a favorable outcome) were transformed directly to dimensional indices (min-max scaling/ normalization) without standardization into z-scores. Subsequently, the average of the dimensional indices
for each domain was calculated. The average dimensional indices for each domain were linked using census tract FIPS.
We adopted the method of adjusting weights utilized by Cho and Yu (2020) to calculate the index, which involved principal component analysis. The authors obtained the weight for a given variable by utilizing the product of the standardized coefficient of the underlying factor multiplied by the relevant proportion of the variance explained (Cho and Yu, 2020).
The average dimensional index for each domain was run in Principal Component Analysis of the SPSS software to obtain weights. We applied 10 varimax rotations, which generated 10 factors. Each of the 10 factors was subsequently weighted. The composite CWI score for each elementary school was estimated as an arithmetic mean of all 10 weighted factors. The composite score had a range of 0 to 1, with 0 indicating minimum and 1 indicating maximum child wellbeing index associated with a lower likelihood of worse mental and physical health in elementary school children.
The schools were subsequently grouped by CWI into 5 quintiles, ranging from very low CWI quintile to very high CWI quintile schools. We calibrated the CWI by SOL Scores and obtained a direct correlation of $36\%$
## III. RESULTS
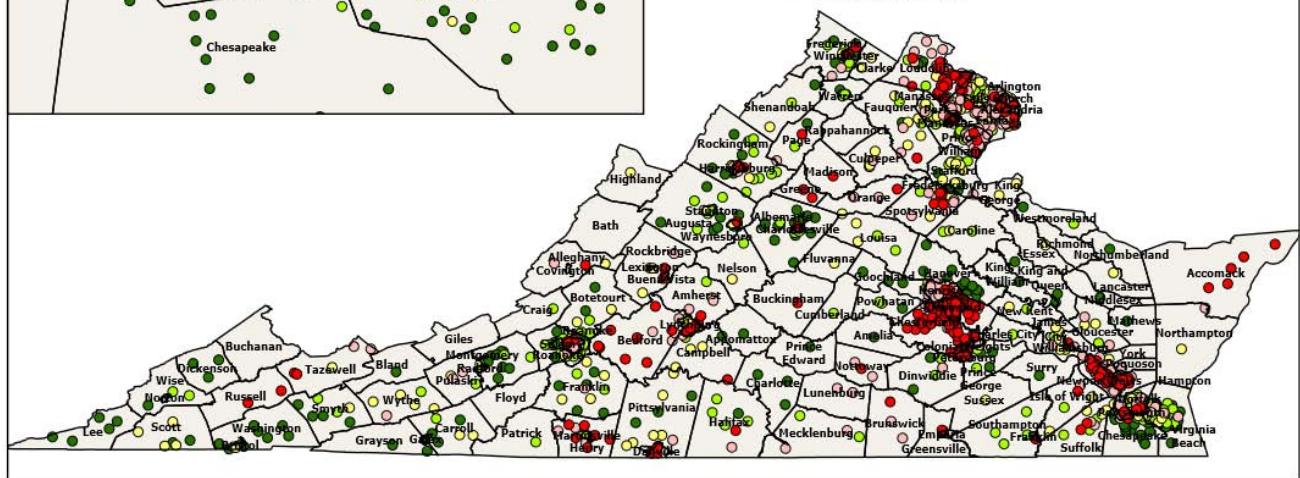
Figure 1 below depicts the spatial variation of CWI across the Commonwealth of Virginia based on the CWI quintiles. Majority of the elementary schools in the Richmond Metro Area and Chesterfield County fall under the very low quintile. In contrast, in the Eastern region of the Commonwealth (such as Virginia Beach, Norfolk, Chesapeake), majority of the elementary schools fall within the "High" and "Very High" Quintiles. A similar situation is seen in Northern Virginia (such as Fairfax). The variation in CWI across counties in Virginia may be related to existing socioeconomic, educational, and structural disparities. For example, median income in Fairfax was reported as $145,165 compared to$ 59,606 in Richmond city (U.S. Census Bureau, 2023). Similarly, the proportion of the population below $100\%$ poverty line was $5.9\%$ in Fairfax, which is significantly less than the proportion in Richmond city ( $19.5\%$ ) (U.S. Census Bureau, 2023). Disparities across education also exist. The U.S. Census Bureau (2023) reported high school graduation rate of $93.5\%$ in Fairfax and $88.8\%$ in Richmond. The on-time graduation rate in Richmond was $72.5\%$, which is much lower than Fairfax ( $93.3\%$ ). Unfortunately, the drop-out rate reported was significantly higher in Richmond ( $23.7\%$ ) compared to $5.4\%$ in Fairfax (U.S. Census Bureau, 2023).
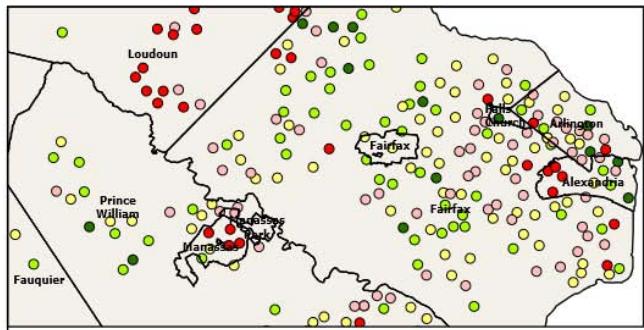
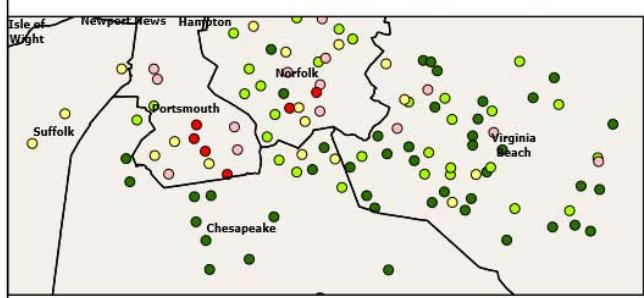
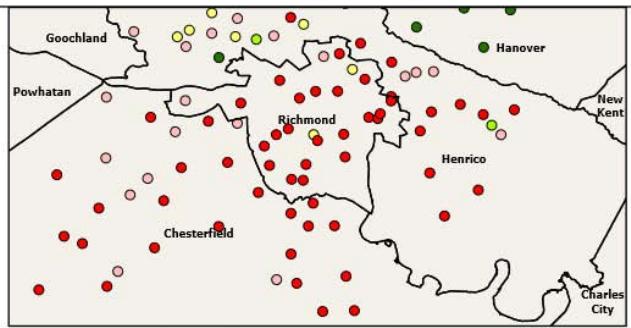
Child Well-Being Index (CWI)
- Very Low CWI
- Low CWI
- Moderate CWI
- High CWI
- Very High CWI

Figure 1: CWI of Elementary Schools Across the Commonwealth of Virginia
Data Source: 2017-2023 datasets sourced from the National Center for Education Statistics (NCES), the Virginia Department of Education (VDOE), and the Urban Institute.
### a) Testing the Predictive Utility of CWI
Prior to testing the multivariate regression analysis model (Table 2 below), assumptions of multiple regression analysis were examined, which included normality, homoscedasticity, multicollinearity, and linearity. We assessed multicollinearity by examining the Pearson correlation between the predictors and the outcome variables, the moderate correlation of $(r = 0.36)$
represents absence of redundancy. Additionally, we plotted the standardized residuals against the standardized predicted values and confirmed that the assumptions of normality, linearity and homoscedasticity were satisfied. A visual inspection of a box plot indicated that the residuals were normally distributed with 2-3 outliers which were not considered influential on the analysis and were retained.
Table 2: Multivariate Regression Analysis: Model Summary
<table><tr><td>Model</td><td>R</td><td>R Square</td><td>Adjusted R Square</td><td>Std. Error of the Estimate</td></tr><tr><td>1</td><td>.809a</td><td>0.654</td><td>0.651</td><td>8.439</td></tr></table>
Table 3: Multivariate Regression Analysis: Coefficients for Domains of the Child Wellbeing Index
<table><tr><td rowspan="2">CWI Domains</td><td colspan="2">Unstandardized Coefficients</td><td rowspan="2">Standardized Coefficients Beta</td><td rowspan="2">t</td><td rowspan="2">Sig.</td></tr><tr><td>B</td><td>Std. Error</td></tr><tr><td>(Constant)</td><td>-43.682</td><td>5.596</td><td></td><td>-7.805</td><td><.001</td></tr><tr><td>School Climate /Environment</td><td>43.54</td><td>4.955</td><td>0.19</td><td>8.788</td><td><.001</td></tr><tr><td>Student Teacher Ratio</td><td>11.108</td><td>4.723</td><td>0.048</td><td>2.352</td><td>0.019</td></tr><tr><td>Socioeconomic Indicator</td><td>53.783</td><td>2.035</td><td>0.632</td><td>26.434</td><td><.001</td></tr><tr><td>Mental Health Support</td><td>22.169</td><td>5.398</td><td>0.09</td><td>4.107</td><td><.001</td></tr><tr><td>Clinical Support</td><td>3.301</td><td>2.127</td><td>0.034</td><td>1.552</td><td>0.121</td></tr><tr><td>Instructional Support</td><td>-12.956</td><td>5.954</td><td>-0.047</td><td>-2.176</td><td>0.03</td></tr><tr><td>Teacher Quality</td><td>17.603</td><td>3.616</td><td>0.101</td><td>4.868</td><td><.001</td></tr><tr><td>Total Per-Pupil Expenditure</td><td>1.587</td><td>2.559</td><td>0.014</td><td>0.62</td><td>0.535</td></tr><tr><td>Law Enforcement/Security Personnel</td><td>3.122</td><td>1.356</td><td>0.044</td><td>2.302</td><td>0.022</td></tr><tr><td>English Learners</td><td>15.745</td><td>1.609</td><td>0.224</td><td>9.787</td><td><.001</td></tr></table>
## IV. DISCUSSION
We bring to the literature, nontraditional variables that measure child wellbeing, which is an improvement in quantitative terms, and allows for the identification of domains for which an elementary school performs better and those for which it does not. This approach facilitates identifying where particular efforts should be made to improve child wellbeing in each elementary school.
Our results showed SOL scores were significantly related to most of the CWI indicators, with the exception of clinical support and total per-pupil expenditure indicators, which both had non-significant associations with SOL scores (table 3 above). In a similar study, Sharper (2013) predicted that changing per pupil expenditure, or percentage of experienced teachers may result in very little change in SOL scores.
To further examine the observed associations in our study, we compared the magnitude and direction of the coefficients. Nine of the ten indicators had a positive direct relationship with the outcome. The model showed that socioeconomic indicator was the strongest predictor of CwI across elementary schools in Virginia. The American Psychological Association (2024) highlighted that socioeconomic status encompasses quality of life attributes, including income, educational attainment, occupational prestige, and the subjective perceptions of social status, and social class.
In our study, a unit increase in favorable socioeconomic conditions in elementary schools resulted in a $53.78\%$ increase in SOL scores $(b = 53.78, p < 0.001)$. Other studies have reported similarly, Munir et al. (2023) reported that students with higher socioeconomic backgrounds performed better academically, however, parental participation and school resources
were important buffers in the association between socioeconomic status (SES) and academic performance. Students with higher SES backgrounds generally have access to educational role models, wide range of learning resources, social ties and experiences that facilitate learning (Munir et al., 2023). Additionally, neighborhoods with high economic resources invest more into amenities that depend on local funding, such as schools, parks, and after school programs, which influence child development and later educational, economic, and health outcomes (Noelke et al., 2020).
Conversely, children from low-SES families scored at least ten percent lower than the national average on national achievement scores in reading and mathematics (American Psychological Association, 2024). Ritter (2015) highlighted increasing disparities in test scores between the poor and wealthier students in the United States. The National Household Education Survey reported that poor children in grades one through three were nearly three times more likely to repeat a grade and poor children in kindergarten through third grade were more than twice as likely to have an individualized education plan for special education needs (Ritter, 2015). Hence, children and students who live in poverty are likely to drop out of schools, continue the poverty cycle and have bleak economic and social prospects (Ritter, 2015).
In addition to academic performance, socioeconomic status impacts on other aspects of a child's wellbeing. Family poverty is associated with food insecurity and hunger, homelessness, parents who are absent (E.g. parents who are incarcerated due to drug use/domestic violence), and other factors such as adverse health outcomes, all of which may negatively impact on a child's wellbeing (Ritter, 2015). Additionally, Poulain et al. (2019) studied 2998 children aged 3-18
years and found that higher SES composite scores were associated with better outcomes and behavior, including higher quality of life, fewer behavioral difficulties, lower BMI, and a healthier lifestyle.
The school climate indicator was the second strongest predictor of SOL scores in our study. A unit increase in positive school climate in elementary public schools across Virginia resulted in a $43.5\%$ increase in SOL scores (Unstandardized $b = 43.54$, $p < 0.001$ ). A study by Belton and Brinkmann (2024) found that school climate had the strongest correlation to SOL scores in elementary public schools in Virginia. The authors also highlighted that although SES is one of the greatest indicators of students' achievement, providing a positive learning environment in schools will enable students to achieve at a higher level than what their socioeconomic background would otherwise predict. Additionally, positive school climate can improve academic achievement, decrease problematic behaviors and decrease high school dropout rates (Belton and Brinkmann, 2024). A study had reported that students from impoverished settings failed to graduate high school at six times the rate of higher income youths and five times the rate of middle-income youths (American Psychological Association, 2024).
The only indicator in our study with a negative inverse relationship with SOL scores is the Instructional support indicator (Unstandardized $b = -12.95$, $p < 0.03$). Lerang et al. (2021) described instructional support as a multifaceted construct that involves teaching practices and instructional strategies that enhance students' cognition and learning. Hence, previous studies reported that instructional support is positively associated with student learning (Lerang et al., 2021). A large-scale randomized trial reported that increasing instruction time (i.e FTEs) in schools increased student learning (Andersen et al., 2016). However, our study findings suggest a statistically significant negative association of increased instructional support FTE's with SOL scores. Nevertheless, some observational studies have suggested that increasing instructional time in schools may have potential negative impact on student achievement, sequel to fatigue and boredom (Andersen et al., 2016).
## V. POLICY IMPLICATION
Public policy has the capacity to promote wellbeing by shaping the contexts in which children live, which includes the family, school, and community (Anderson et al., 2022a). Andersen et al., (2022b) attributed advancements in high school graduation from the year 2000 to 2019 to improvements in quality of elementary school education, improved access to high quality pre-schools, reduction in teenage pregnancies and arrest rates, reduction of class sizes, and incentivizing higher teacher performance.
The CWI can be utilized by policy makers to identify and target elementary schools across the Commonwealth of Virginia that are in need of improvement. The CWI can inform prioritizing resource allocation to schools with low SOL scores and instituting localized support programs. A recognition of the impact of SES on academic achievement as demonstrated by our result findings and the identification of underlying mechanisms can aid educators and policy makers in developing targeted strategies to bridge the academic achievement gap and address educational disparities (see Munir et al., 2023). Such mitigation strategies can include support programs, instructional modifications, curriculum development, facilitating parental involvement and improved access to educational resources that cater to the needs of children from disadvantaged backgrounds, which will ultimately improve outcomes (see Munir et al., 2023).
The results of our study can inform other policy actions such as nutritional assistance programs in economically disadvantaged schools, and financial support for school supplies. Policies should aim to reduce the resource disparities between elementary schools and promote a supportive educational environment (see Munir et al., 2023). Recommendations for elementary schools in the lower quintiles of the CWI include, providing teachers with more opportunities for professional development, developing a comprehensive summer school program that allows elementary school children gain academic credit over the summer, monitoring school performance, discipline, and attendance records (see Ritter, 2015).
Lower CWI quintile schools across the Commonwealth of Virginia should identify evidence-based goals and targets. All staff should be involved and planning teams assigned to different goals. Created teams should meet regularly to assure progress. Obtaining government commitment, engaging non-profit organizations and the general public is paramount for securing funding and implementation of such intervention efforts (see Ritter, 2015). Progress can be measured by adopting evaluation strategies and adjustments can be made each year both to the plan and to the activities around improvement via a continuous quality improvement approach (see Ritter, 2015).
## VI. LIMITATIONS
A few factors may limit the scope of our analysis. Firstly, datasets for some indicators we intended for inclusion were not available at the elementary school attendance boundary level. An example of such indicator is family socioeconomic characteristic which has been reported to significantly impact child wellbeing. Hence, the limitations in data-availability may have caused some disconnect between theory and the quantitative assessment of wellbeing (see Anderson et al., 2022b). Nevertheless, other studies have reported on data unavailability or limited data access as a long-term and persistent challenge in the selection of indicators (Cho and Yu, 2020).
Secondly, we were unable to include data and indicators available at other geographic levels and subsequently map such datasets to our geographic level, because school attendance boundaries are constantly changing and redrawn. Erbsterin et al.(2013) argue that youth well-being in the United States should be measured at the school district level because school district boundaries "often reflect municipal boundaries... and therefore present a policy-relevant geography with respect to youth well-being." (p.268). However, Virginia has no centralized method of redrawing school boundaries and each school district is in charge of drawing its own school boundaries. Hence, we were unable to link geographic levels like census tract to school attendance boundaries.
Similar to limitations highlighted by Anderson et al. (2022b), the indicators of our CWI were not grounded in the subjective experiences of younger children, and objective and subjective experiences are important in providing a holistic picture of a child's wellbeing (Anderson et al., 2022b).
Additionally, our CWI does not capture individual level measures of wellbeing (such as an individual child's academic achievement, health status or health behavior) or contextual determinants of wellbeing (such as an individual child's surrounding environment or parents income) because our sole goal for the index was to understand how systems and policies influence child wellbeing (see Andersen et al., 2022a).
Furthermore, the cohort of elementary school children in this study represent a particular time and period in the United States context that may not adequately translate to measuring well-being in other school context (Andersen et al., 2022a).
We also recognize that vulnerable children like foster children and children experiencing homelessness are likely under-represented in the elementary school population across the Commonwealth of Virginia.
Nevertheless, this study adds to the existing literature, a methodology that could derive a stronger measure of child wellbeing for children in elementary schools in jurisdictions across the United States.
## VII. CONCLUSION
Indepth understanding of children's wellbeing is critical. For the purpose of monitoring and evaluation at the population-level, we operationalized child well-being by gathering data across a defined set of component measures and then aggregated the information into a single index. Subsequently, we examined the predictive utility of the tool in predicting SOL scores and identified socioeconomic factors and positive school climate as two strongest predictors of SOL scores across the Commonwealth of Virginia.
This study presented population level research that holds great promise. Our CWI adopted several methodological improvements to prior indices, such as allocating weights to each CWI domain based on levels of relevance to child wellbeing. Adopting a rigorous approach to measuring child wellbeing in different jurisdictions across the United States is important in making advances to population health of children at the elementary school level. Additionally, inequities across school enrollment boundaries must be addressed with a focus on economic inequality, social and structural inequities, and other systems that shape the contexts in which children learn, play and grow.
Generating HTML Viewer...
References
50 Cites in Article
Suman Ahmmed,Jashodhan Saha,Maruf Tamal (2022). An empirical study for determining the quality indicators for the primary and secondary school of Bangladesh: A structural equation modeling approach.
E Allensworth,J Easton (2005). The On-Track Indicator as a Predictor of High School Graduation.
Joseph Allen,Christopher Hafen,Anne Gregory,Amori Mikami,Robert Pianta (2017). Enhancing Secondary School Instruction and Student Achievement: Replication and Extension of the My Teaching Partner-Secondary Intervention.
(2024). The Committee on Children, Youth, and Families.
Simon Andersen,Maria Humlum,Anne Nandrup (2016). Increasing instruction time in school does increase learning.
Nathaniel Anderson,Anna Markowitz,Daniel Eisenberg,Neal Halfon,Kristin Moore,Frederick Zimmerman (2022). The Child and Adolescent Thriving Index 1.0: Developing a Measure of the Outcome Indicators of Well-Being for Population Health Assessment.
N Anderson,D Eisenberg,N Halfon,A Markowitz,K Moore,Zimmerman (2022). Trends in measures of child and adolescent wellbeing in the United States from 2000 to 2019.
Annie Casey Foundation (2007). The state of children with disabilities and special health care needs. Children With Disabilities and Special Health Care Needs -The Annie E.
G Arslan,M Yıldırım,S Albertova (2022). Development and initial validation of the subjective academic wellbeing measure: A new tool of youth wellbeing in schools.
D Belton,J Brinkmann (2024). The relationship between school climate and student achievement in reading in public elementary schools in Virginia, USA.
A Biglan (2014). Healthy marriage matters to ACF.
Jacquelyn Mccroskey (2020). Using Child and Family Indicators to Influence Communities and Policy in Los Angeles County.
Lisa Bunting,Claire Mccartan,Gavin Davidson,Anne Grant,Ciaran Mulholland,Dirk Schubotz,Orla Mcbride,Jamie Murphy,Emma Nolan,Mark Shevlin (2022). Experiences of childhood adversity across generations – Continuity or change? A study from the Northern Ireland youth wellbeing survey.
(2015). Well-being indicator tool for youth (WIT-Y).
Esther Yin-Nei Cho,Fuk-Yuen Yu (2020). A review of measurement tools for child wellbeing.
Elaine Allensworth,John Easton (2005). The On-Track Indicator as a Predictor of High School Graduation.
N Erbstein,C Hartzog,E Geraghty (2013). Putting youth on the map: A pilot instrument for assessing youth well-being.
Francesca Giambona,Erasmo Vassallo (2014). Composite Indicator of Social Inclusion for European Countries.
Stephen Gibbons,Olmo Silva (2011). School quality, child wellbeing and parents’ satisfaction.
J Howard,L Latella (2024). Mind the Kids - Mental Health and Exercise.
N Kassebaum,H Kyu,L Zoeckler,H Olsen,K Thomas,C Pinho (2017). Child and Adolescent Health From 1990 to 2015: Findings from the Global Burden of Diseases, Injuries, and Risk Factors 2015 Study. Global Burden of Disease Child and Adolescent Health Collaboration.
Kenneth Land,Vicki Lamb (2014). Child and Youth Well-Being Index (CWI).
Maren Lerang,Sigrun Ertesvåg,Tuomo Virtanen (2021). Patterns of teachers’ instructional support quality and the association with job satisfaction and collegial collaboration.
R Long,E Huebner (2014). Differential validity of global and domain-specific measures of life satisfaction in the context of schooling.
D Mayer,J Mullens,Moore (2000). National Institute of Statistical Sciences/ Education Statistics Services Institute Task Force on Graduation, Completion, and Dropout Indicators: Final Report.
Javeria Munir,Mehreen Faiza,Bakht Jamal,Sana Daud,Khurshed Iqbal (2023). The Impact of Socio-economic Status on Academic Achievement.
(2023). Data Files: The Common Core of Data.
K Land,V Lamb (2014). Methodology to Compare Districts and Schools: A Technical Report.
(2024). Child and Youth Wellbeing.
Mats Nylén-Eriksen,Ann Bjørnnes,Hege Hafstad,Irene Lie,Ellen Grov,Mariela Lara-Cabrera (2022). Validating the Five-Item World Health Organization Well-Being Index.
Tanja Poulain,Mandy Vogel,Carolin Sobek,Anja Hilbert,Antje Körner,Wieland Kiess (2019). Associations Between Socio-Economic Status and Child Health: Findings of a Large German Cohort Study.
Albino Prada,Patricio Sanchez-Fernandez (2021). World Child Well-Being Index: A Multidimensional Perspective.
K Reed (2020). Chronic poverty among youth in the United States.
Rasmus Riad,Mara Allodi,Eva Siljehag,Carina Wikman,Tamsin Ford,Sven Bölte (2021). How I Feel About My School—Adaptation and Validation of an Educational Well-Being Measure among Young Children in Sweden.
B Ritter (2015). Factors influencing high school graduation:Issue brief prepared for the Washington student achievement Council.
Robert Wood,Johnson Foundation (2019). Advancing Well-Being in an Inequitable World: Moving from Measurement to Action. Advancing Well-Being in an Inequitable World: Insights from Global Thought Leaders.
Meena Sehgal,Santosh Jatrana,Louise Johnson,Sujit Ghosh (2024). Assessing Child Health in India: Development and Validation of a Comprehensive Child Health Index.
R Sharma,L Henneman,A Qadri,L Vignoles (2017). Global Youth Wellbeing Index.
E Sharper (2013). Faculty research on predicting SOL scores featured in newspaper.
K Stevenson (2006). School Size and Its Relationship to Student Outcomes and School Climate: A Review and Analysis of Eight South Carolina State-Wide Studies.
(2024). Convention on the Rights of the Child.
(2021). Description and Prevalence of Mental, Emotional, and Behavioral Needs Among Students.
(2023). American Time Use Survey, 2005.
U (2004). Census of Population and Housing, 2000 [United States]: Summary File 4, Virginia.
Kyle Ueyama (2023). educationdata: Retrieve Records from the Urban Institute's Education Data Portal API.
(2022). Table 4: Learning parameters to build a regression model..
(2022). Scoring Guides, aka Rubrics.
Archana Chaudhari (2003). 2002 West Virginia Youth Tobacco Survey.
Mooly Wong,Joyce Ma,P Wan,Lily Xia,Michael Fok (2022). The Development and Validation of a Family Wellbeing Index for Hong Kong Chinese Families.
(2023). What is our methodology? European Youth Forum.
No ethics committee approval was required for this article type.
Data Availability
Not applicable for this article.
How to Cite This Article
Wanderimam Tuktur. 2026. \u201cVirginia Child Wellbeing Index: Measuring Wellbeing and School Success Among Elementary School Students in Virginia\u201d. Global Journal of Human-Social Science - H: Interdisciplinary GJHSS-H Volume 24 (GJHSS Volume 24 Issue H6): .
Explore published articles in an immersive Augmented Reality environment. Our platform converts research papers into interactive 3D books, allowing readers to view and interact with content using AR and VR compatible devices.
Your published article is automatically converted into a realistic 3D book. Flip through pages and read research papers in a more engaging and interactive format.
Our website is actively being updated, and changes may occur frequently. Please clear your browser cache if needed. For feedback or error reporting, please email [email protected]
Thank you for connecting with us. We will respond to you shortly.