This study investigates the influence of social media usage on the food choices and nutritional status of school-going adolescent girls in Punjab. A total of 520 subjects, aged 16-18 years, were selected from rural and urban schools across Punjab. The sample was divided into social media users and non-users based on daily usage duration, with further subdivision into rural and urban categories. Comprehensive data was collected on socio-economic status, dietary habits, physical activity and anthropometric parameters. Dietary intake was assessed using the 24-hour recall method and compared with the Recommended Dietary Allowances (RDA). Nutrient adequacy and dietary diversity scores were calculated, while body composition was analyzed using advanced tools. Results revealed significant differences in dietary patterns, nutrient intake, and body composition between users and non-users of social media. Rural nonusers displayed healthier eating habits, including higher fruit consumption and lower fat intake, while urban users reported greater consumption of processed and junk foods.
## I. INTRODUCTION
The word adolescence originated from the Latin term 'adolescere', which means to mature. Adolescence is defined as the age between 10 to 19 (WHO 2019). After infancy, adolescence is the only another time where rapid growth and development along with significant biological and psychological changes occur and these changes are greatly influenced by sociocultural factors. The two typical stages include early adolescence (10-14 years) and late adolescence (15-19 years). From a physiological perspective, pubertal changes rule the early years whereas sexual maturation and establishment of adult roles and responsibilities rule the later years (Patton et al 2016). Adolescents make about 16 percent of the world's population (Bhargava et al 2020). Asia is home to more than half of the world's adolescents, while India has 20 percent of its people under the age of 18 (UNICEF 2016).
There is a link between adult comprehension of dietary guidelines and healthy eating behaviors. Nutritional knowledge is crucial for promoting healthy eating patterns and maintaining a healthy body weight. Relation among nutrition knowledge and food nutrient consumption as well as the positive effects of nutrition knowledge in adolescents cannot be ignored. Adolescence is a critical period of rapid growth requiring increased nutrients, such as amino acids for muscle development and calcium and vitamin D for bone growth. Adolescents, often engaged in physical activities, have higher energy needs, but those who are sedentary may accumulate fat, contributing to global adolescent obesity. According to WHO, about 1/5th of the world consist of adolescents, during this period good nutrition is very important for the growth and development. Inadequate nutrition during adolescence can have serious consequences throughout the reproductive years and beyond. Under-nutrition in adolescent girls is a major public health problem in developing countries (Das et al 2017).
Dietary problems among adolescent girls must be addressed as they can bring a negative effect on future generations if right information is not given at right time (Choudhary et al 2010). Each year, 16 million babies are born to girls aged 15-19, with adolescent fertility rates much higher in low-and middle-income countries (LMICs) due to factors like poverty, lack of education and limited healthcare access. Adolescent pregnancies pose significant risks, including competition for nutrients between mother and fetus, leading to stunted growth, low birth weight, preterm delivery and higher maternal mortality. Young mothers are also at increased risk for neonatal complications. During lactation, a mother's micronutrient status is vital for her infant's health, especially in the first six months. Nutrient needs during pregnancy and lactation are significantly higher compared to other stages of life (Das et al 2017).
Globally, the prevalence of overweight and obesity in children aged 5-19 has grown from 4 to 18 per cent since 1975 to 2016 (Abarca-Gomez et al 2017). Due to eating patterns influenced by obesogenic environments, such as the broad availability, high cost and promotion of foods with a high energy density, particularly in the digital era, health status of children and adolescents is deteriorating. Obesity has been related to prolonged television viewing (Olafsdottir et al 2014), primarily because it is associated with unfavourable eating habits such as skipping breakfast (Lipsky et al 2012) and consuming unhealthy foods more frequently (Lissner et al 2012) as well as fewer vegetables and fruits (Bornhorst et al 2015).
'Social Media' is a broad term used to describe online technical solutions that make it simple for users to communicate with one another and the online community by sharing and exchanging information online. There are a few examples of these technological tools such as social networking sites (SNS), video-sharing websites, virtual worlds, blogs, group projects etc (Mangold and Faulds 2009; Kaplan and Haenlein 2010). SNS have shown the fastest and most steady growth of any of these social media tools (Chang et al 2015). Social networking sites (SNS) have become a crucial source of information for customers, significantly influencing their choices and purchase intentions (Li and Chang 2016, Wang et al 2012). This impact encourages continued engagement with these platforms (Chang et al 2015). Over the past decade, the use of Facebook has surged from about $2\%$ to nearly $30\%$ of the global population by 2019, highlighting the growing importance of SNS in daily life, especially among adolescents (Ortiz-Ospina 2019). Children's and adolescents attention spans can be impacted by the need to often check highly engaging online content and incoming notifications from SM applications (Reid et al 2016). This effect is particularly concerning when people are eating thoughtlessly in front of screens which may lead to overeating, consequently resulting in overweight and obesity (Robinson et al 2017). Food communications have permeated our surroundings in the form of social media photos, videos, advertisements and posts from food influencers, cookery shows and peer-to-peer messages. These signals can be virtual or nonvirtual and frequently support unhealthy non-core eating norms while glorifying non-core food consumption and enticing excessive energy consumption (Qutteinaet al 2021).
Social media influencers, defined as individuals who cultivate their own audiences on these platforms, significantly affect the attitudes and behaviors of their followers (Gross and Wangenheim 2018, Freberg et al 2011). Often referred to as "cyber celebrities," these influencers gain fame through sharing personal narratives, similar to traditional celebrities and leverage their social influence to promote branded products (De Veirman et al 2017, Chatterjee 2011). Their promotional strategies can range from subtle integrations of branded content to more explicit calls for followers to engage with their posts (Abidin, 2016). Research indicates that such marketing can notably impact food preferences; for instance, exposure to influencers promoting unhealthy snacks has been linked to increased consumption of non-core foods and preferences for branded over non-branded options among preadolescents (Coates et al 2019b, Coates et al 2019c). Thus, food marketing by social media influencers plays a significant role in shaping dietary choices and behaviors.
Adolescents are heavily influenced by food-related posts from peers and influencers on social media, which often highlight non-core foods, such as soft drinks and fast food. This exposure shapes their perceptions of food norms, leading them to believe that overconsumption of non-core foods is typical, while underestimating the popularity of healthier options. This misperception is concerning, as food norm perceptions significantly affect eating behaviors. The constant portrayal of non-core foods may create a feedback loop where adolescents internalize these norms, increasing their consumption of unhealthy foods. Thus, social media not only reflects but also reinforces eating behaviors, making it crucial to understand how these online food messages impact adolescents' food choices (Quitteinaet al 2021).
Punjab is an economically successful state with a high per capita income. Punjab has always been known for its delectable cuisine and adolescents in particular have exceptional taste preferences. Because of industrialization, urbanization and increased spending power in this century, lifestyle and eating habits have altered. Adolescence is seen as a crucial period for establishing dietary habits since it affects the likelihood of developing a variety of ailments later in life. Foods that provide enough energy and nutrients to sustain physical health, cognitive development and social growth are the foundation of children's and teenagers health. The consumption of a balanced diet is essential for children's growth and development and is also responsible for preventing non-communicable diseases. During this time, family plays a crucial role.
In light of these ambiguities, it is crucial to appreciate and incorporate the body of research that can analyze the positive or negative use of online social networking as a component intervention to promote health in order to strengthen future research and practices. The purpose of the present research study is to look into how adolescent girls use social media in terms of food information in relation to nutritional status of rural and urban girls, particularly belonging to Punjab.
## II. MATERIAL AND METHODS
The purpose of the present study was to investigate Influence of Social Media Usage on Food Choices and Nutritional Status of School Going Adolescent Girls Residing in Punjab. This research encompassed investigations from the selected district city will be considered as urban sample whereas the samples from the selected villages will constitute rural sample and further categorized into users and non-users of social media, employing the methodologies outlined below:
### a) Location/place of Work
In order to identify social media users and non-users, the research was carried out in the private and government schools of urban and rural areas of Punjab.
### b) Selection of Subjects
A total sample of 520 girls in the age group of 16-18 years was selected from private and government schools of Punjab. There were a total of 23 districts in Punjab, with the Malwa region occupying the largest part of the state, comprising 15 districts. The remaining districts were located in the Majha and Doaba regions, with an equal number in each. For this study, districts from each region were selected using a proportionate sampling technique, applying a 1:1:3 ratio. Thus, two districts each from Majha and Doaba and six districts from the Malwa region were selected to ensure coverage of the entire state. In the chosen villages and district cities, government and private schools were selected for the subject sample. The samples from the selected district cities were considered urban, while those from the selected villages constituted the rural sample. The subjects were divided into the following groups, with an equal number of subjects in each:
Control: Subjects who used social media for 1-1.5 hours were categorized as non-users or classified according to the data obtained from the subjects.
Experimental: Subjects who used social media for more than 1-1.5 hours were categorized as users.
 Figure 3.1: Areas of Three Regions of Punjab
### c) Drafting a Questionnaire
The questionnaire was thoughtfully created to gather comprehensive information from the chosen participants in a systematic way. A wide range of information was covered in the survey, such as age, caste, family type, income and dietary habits assessed through a structured dietary survey, 24-hour recall technique was applied and questions about food and nutrient intake, anthropometric measurements, body composition and social media platform use were asked.
### d) Data Collected from 520 Subjects
A well-constructed and pretested interview schedule was used to look into a number of topics related to the study's goals throughout the data gathering phase. The interview schedule included inquiries regarding topics like socio-economic and demographic profile, the influence of social media on food information, dietary habits, physical activity, anthropometric parameters and body composition.
## i. Socio-Economic and Demographic Profile
The information related to the subject's age, caste, type of family, family composition, educational and occupational status of parents and total monthly income of the family were collected using pretested interview schedule. The per capita monthly income of the individual family members was calculated by dividing the total income of the family by the number of members. Modified Kuppuswamy's socio economic status scale was used to know the socio economic class of the subjects. Education, occupation and per capita income were considered to socio-economic status (Wani 2019).
Table 3.1: Modified Kuppuswamy's Socio Economic Status Scale
<table><tr><td>Socio-Economic Class</td><td>Total Score</td></tr><tr><td>Upper Class</td><td>26-29</td></tr><tr><td>Upper Middle</td><td>16-25</td></tr><tr><td>Lower Middle</td><td>11-15</td></tr><tr><td>Upper Lower</td><td>5-10</td></tr><tr><td>Lower</td><td>Below 5</td></tr></table>
## ii. Influence of Social Media on Food Information
The data pertaining to the type of social media platform used, duration of usage, frequency of usage, purpose and attributes given importance, as well as the food brands and type of food influencer followed by the subjects was recorded.
## iii. Dietary Information
### a. Dietary Pattern
A general dietary assessment include dietary habits, meal frequency and the consumption of water, beverages, green leafy vegetables, fruits and meat products.
The frequency of common food items, especially those popular among children, was recorded.
### b. Food Intake
Data on the dietary intake of adolescents was collected using the 24-hour recall method over three consecutive days, including one Sunday or holiday. Days selected were not fasting or feasting days to ensure typical dietary patterns.
Standardized cups, glasses and spoons, which had been previously calibrated, were used as aids to assist participants in recalling the quantities of food consumed during the 24-hour period prior to the investigation.
## c. Nutrient Intake
The daily nutrient intake was determined using DIETCAL software (Kaur, 2017), and the results were compared with the recommended dietary allowances to evaluate nutrient adequacy.
## d. Nutrient Adequacy Ratio (NAR)
The average amount of each food ingested by each subject over the course of three days was entered into the software, and the software then estimated the subject's nutritional intake and compared it to the RDA (ICMR 2020).
$$
N A R \% = (\text{Intake of nutrient / Recommended intake of nutrient}) * 100
$$
Table 3.2: Categorization of Nutrient adequacy ratio (NAR%) using a classification given by (Rani and Rani 2016)
<table><tr><td>Adequate</td><td>100% and above</td></tr><tr><td>Marginally adequate</td><td>75% and above</td></tr><tr><td>Marginally inadequate</td><td>50 to 74.9%</td></tr><tr><td>Inadequate</td><td>Below 50%</td></tr></table>
### e. Dietary Diversity Score (DDS)
The Dietary Diversity Score (DDS) was measured by categorizing the food items consumed in a day into 14 groups. The participants were categorized into three classes according to their scores, using the classification given by Nithya and Bhavani (2018).
Table 3.3: Categorization of Dietary Diversity Score (DDS) using a Classification given by Classification by Nithya and Bhavani (2018)
<table><tr><td>Low Dietary Diversity</td><td>DDS of 1-4</td></tr><tr><td>Moderate Dietary Diversity</td><td>DDS of 5-9</td></tr><tr><td>High Dietary Diversity</td><td>DDS of 10-14</td></tr></table>
### f. Height and Weight
For height measurement, a stadiometer or measuring tape was used. The measuring area was ensured to be flat and well-lit and participants were asked to remove shoes and hats. They stood straight against the measuring device, making sure their heels, buttocks, shoulders and heads were in contact with the surface. Participants looked straight ahead, with their eyes level to the horizon, while the horizontal headpiece of the stadiometer was gently lowered onto their heads.
The height was recorded in centimeters, accurate to the nearest $0.1\mathrm{cm}$.
For weight measurement, a calibrated weighing scale was utilized. The scale was placed on a flat, hard surface to ensure accuracy and it was zeroed before use. Participants were asked to remove shoes and heavy clothing and to stand still in the center of the scale, with feet evenly spaced. The weight was recorded in kilograms, accurate to the nearest $0.1\mathrm{kg}$. All measurements were taken under consistent conditions to effectively assess growth and nutritional status, following the guidelines established by Jelliffe.
### g. Waist and Hip Circumference
The waist and hip circumferences were measured using a non-stretchable measuring tape. The participant was instructed to stand upright with their feet together and arms relaxed at their sides, wearing light clothing. For the waist circumference measurement, the midpoint between the lower rib and the top of the hip bone (iliac crest) was located. The measuring tape was wrapped around the waist at this midpoint, ensuring it was parallel to the ground and snug but not compressing the skin. The participant was asked to breathe normally, and the waist circumference was recorded at the end of a normal expiration in centimeters.
For the hip circumference measurement, the widest part of the hips or buttocks was identified. The measuring tape was then wrapped around this area, ensuring it remained parallel to the ground. The hip circumference was also recorded in centimeters. Both measurements were accurately documented for further analysis, aiding in the assessment of body fat distribution and the associated risk of noncommunicable diseases.
Table 3.4: Waist and Hip Circumference Classification as Outlined by the WHO (2008)
<table><tr><td>Classification</td><td>Waist Circumference (Inches)</td><td>Hip Circumference (Inches)</td></tr><tr><td>Normal</td><td>Women: < 31.5</td><td>Women: < 34.5</td></tr><tr><td>Increased Risk</td><td>Women: 31.5 - 34.5</td><td>Women: 34.5 - 37</td></tr><tr><td>High Risk</td><td>Women: > 34.5</td><td>Women: > 37</td></tr></table>
### h. Body Mass Index (BMI)
Using the following formulas, BMI was computed from weight and height records (WHO, 2004):
$$
\text{BodyMassIndex (BMI)} = \frac{\text{Weight (k g)}}{(\text{Height}) (\mathrm{m} ^ {2})}
$$
Asian-Pacific BMI Classification
<table><tr><td>BMI Category</td><td>BMI Range (kg/m2)</td></tr><tr><td>Underweight</td><td>< 18.50</td></tr><tr><td>Normal range</td><td>18.5 - 22.99</td></tr><tr><td>Overweight</td><td>23- 24.99</td></tr><tr><td>Pre-obese</td><td>25- 29.99</td></tr><tr><td>Obese</td><td>>30.0</td></tr><tr><td>Grade I</td><td>30-40</td></tr><tr><td>Grade II</td><td>40.1-50</td></tr><tr><td>Grade III</td><td>>50</td></tr></table>
## i. Waist to Hip Ratio (WHR)
A continuous tension tape was used to measure the circumference of the waist and hip in centimeters. Measurements were taken after wrapping the tape around the hip. The waist-hip ratio (WHO 2008) was calculated. Additionally, the waist to hip ratio was computed by entering the appropriate values into the procedure below.
$$
\text{WaistHipRatio} = \frac{\text{Hipcircumference}}{\text{Waistcircumference}}
$$
According to WHO, abdominal obesity is indicated by a waist-hip ratio more than 0.85 for women (WHO2008).
### j. Waist to Height Ratio
This helped in assessing health risks related to central obesity
$$
\mathrm{W H t R} = \frac{\text{Waistcircumference}}{\text{Height}}
$$
Table 3.5: Categorization of Waist to Height Ratio (Ashwell and Hsieh 2005)
<table><tr><td>WHtR</td><td>Risk</td></tr><tr><td>< 0.40</td><td>Low (Underweight)</td></tr><tr><td>0.40 - 0.49</td><td>Healthy (Low Risk)</td></tr><tr><td>0.50 - 0.59</td><td>Increased Risk</td></tr><tr><td>≥ 0.60</td><td>High Risk (Obesity)</td></tr></table>
The health risks related to obesity affected both men and women, but evidence suggested that women faced greater health risks due to obesity compared to men in some areas. However, the distribution and type of health risks varied by gender due to biological, hormonal and behavioral differences (WHO 2004).
### e) Statistical Analysis
A variety of statistical analyses were performed on the data to ascertain various parameters.
- Calculating certain descriptive statistical metrics for every research variable, including the mean, standard deviation and percentage distribution.
- An independent t-test was applied to test the difference between parameters.
- Pearson's correlation coefficient is evaluated with respect to other variables.
## III. RESULTS
### a) Socio-Demographic Profile of Participants
The study sample (Table 4.1) included adolescent girls from rural and urban areas, predominantly aged between 16 and 18. The 16-17-year-old age group had a higher percentage in rural areas $(87.69\%)$ compared to urban areas $(86.93\%)$, while 18-year-olds constituted a small proportion across both groups. A majority of participants in rural areas were Sikh $(72.31\%)$, with a slightly higher prevalence than in urban areas $(60.77\%)$. Hindu participants formed $25.77\%$ of the rural and $37.69\%$ of the urban sample. Minority religious groups included Muslims $(1.54\%$ in rural, $0.77\%$ in urban) and Christians $(0.38\%$ in rural, $0.77\%$ in urban). Participants' caste affiliations varied, with the scheduled caste comprising $58.85\%$ of rural participants and $29.62\%$ of urban participants. The general caste was more prevalent in urban areas $(44.61\%)$ compared to rural areas $(20.77\%)$. Other caste groups included the backward class $(4.62\%$ rural, $11.54\%$ urban) and other backward classes $(15.77\%$ rural, $14.23\%$ urban). Nuclear families were more common, with $70.38\%$ in rural and $64.62\%$ in urban areas. Joint family structures were also present but less predominant, representing $29.62\%$ of rural and $35.38\%$ of urban participants.
Most participants came from medium-sized families (5 to 8 members), accounting for $59.23\%$ in rural and $54.23\%$ in urban areas. Large families (more than 8 members) were less common, while small families (less than 4 members) were represented by $27.31\%$ in rural and $26.54\%$ in urban areas.
Income distribution showed that most families earned between 2.5 to 5 lakhs annually, with $48.56\%$ of rural and $43.85\%$ of urban participants falling into this income bracket. A smaller percentage reported incomes over 5 lakhs, and only a minimal proportion of families earned above 10 lakhs. The majority of participants were from the lower-middle and upper-lower socioeconomic classes.
### b) Medical Background of Adolescent Participants
Among the adolescent girls surveyed (Table 4.2), the prevalence of major health disorders such as diabetes was absent in both rural and urban groups, with all participants reported as non-diabetic. A small percentage reported hypertension, with $1.53\%$ of rural and $0.38\%$ of urban participants diagnosed with the condition. Depression was identified in only one participant $(0.38\%)$ in rural areas, reflecting a low incidence across the sample. Allergic reactions were reported more frequently in urban participants, where $7.30\%$ reported allergies, compared to $2.69\%$ in rural areas. The majority of participants across both locations did not report any allergies. Medical check-up attendance showed significant variation; $42.31\%$ of rural and $48.08\%$ of urban participants had undergone recent check-ups. However, a larger portion, especially in rural areas $(57.69\%)$, did not attend regular medical evaluations. Medication usage was relatively low among participants, with only $5.77\%$ in rural and $6.15\%$ in urban areas actively using prescribed medications. Among these, the types of medication varied, with some use of homeopathic $(3.07\%$ rural, $1.54\%$ urban), Ayurvedic $(1.54\%$ urban only) and allopathic medications $(2.69\%$ rural, $3.08\%$ urban). The usage of corrective eyewear, such as spectacles during device usage, was more common among urban participants $(29.62\%)$ compared to those in rural areas $(15.77\%)$. These findings provide a comprehensive insight into the medical background of adolescent girls in rural and urban settings, highlighting both health conditions and medical practices across different demographic groups.
### c) Menarche Status of Adolescent Participants
The distribution of menarche age among adolescent participants varied, with the majority experiencing menarche between ages 12 and 14 (Table 4.3). Specifically, $31.15\%$ of rural and $34.62\%$ of urban participants reported menarche at age 13, making it the most common age of onset. Menarche at age 12 was also prevalent, with $27.31\%$ in rural and $21.92\%$ in urban areas, followed by age 14 ( $25\%$ rural, $24.23\%$ urban). Fewer participants reported menarche at ages younger than 11 or older than 15, indicating that the majority reached menarche during early adolescence. Menstrual cycle regularity differed slightly between groups. In rural areas, $75.38\%$ reported regular cycles, compared to $69.23\%$ in urban settings. Irregular cycles were reported by $24.62\%$ of rural and $30.77\%$ of urban participants. Experiences of menstrual pain were common, with variations in pain timing. Pre-menstrual pain affected $47.69\%$ of rural and $45.77\%$ of urban participants, while pain throughout the menstrual period was reported by $42.31\%$ in rural and $46.15\%$ in urban areas. Postmenstrual pain was less frequent but present in $5.77\%$ of rural and $6.54\%$ of urban participants, while only $4.23\%$ of rural and $1.54\%$ of urban participants reported no menstrual pain. A notable portion of participants used medication to manage menstrual discomfort, with $10\%$ of rural and $13.08\%$ of urban participants taking pain relief medications. The remaining participants did not rely on medication for pain management. The volume of menstrual flow was predominantly reported as normal by both rural ( $85.77\%$ ) and urban ( $82.31\%$ ) participants. Heavy flow was less common, observed in $12.69\%$ of rural and $13.46\%$ of urban participants, while low flow was less ( $1.54\%$ rural, $4.23\%$ urban). These findings provide insight into the menstrual health of adolescent girls, highlighting common ages of menarche onset, regularity patterns, pain experiences and variations in menstrual flow across rural and urban populations.
### d) Influence of Social Media on Food Information
Table 4.4 provides a detailed analysis of social media (SM) usage patterns among adolescent participants, revealing significant behavioral differences between SM users and non-users.
Table 4.4: Parameters of Social Media (SM) usage among Respondents
<table><tr><td>Statements</td><td>User (n=260)</td><td>Non user (n=260)</td><td>Total (n=520)</td></tr><tr><td colspan="4">Personal Mobile Phone or any other Device</td></tr><tr><td>1. Yes</td><td>161(61.92)</td><td>126(48.46)</td><td>287</td></tr><tr><td>2. No</td><td>99(38.07)</td><td>134(51.53)</td><td>233</td></tr><tr><td colspan="4">Keep a Check on Screen Time while using SM</td></tr><tr><td>1. Yes</td><td>143(55)</td><td>155(59.61)</td><td>298</td></tr><tr><td>2. No</td><td>117(45)</td><td>105(40.38)</td><td>222</td></tr><tr><td colspan="4">Frequency of Visiting SNS</td></tr><tr><td>1. Everyday</td><td>260(100)</td><td>212(81.53)</td><td>472</td></tr><tr><td>2. Twice a day</td><td>-</td><td>-</td><td>-</td></tr><tr><td>3. Thrice a day</td><td>-</td><td>48(18.46)</td><td>48</td></tr><tr><td colspan="4">Purpose of SM use</td></tr><tr><td>1. Keeping in touch with friends & family</td><td>68(26.15)</td><td>74(28.46)</td><td>142</td></tr><tr><td>2. Just for fun</td><td>8(3.08)</td><td>10(3.84)</td><td>213</td></tr><tr><td>3. For health purpose</td><td>122(46.92)</td><td>91(35)</td><td>18</td></tr><tr><td>4. For updating yourself</td><td>62(23.84)</td><td>85(32.69)</td><td>147</td></tr><tr><td colspan="4">Sites Attracted the Most</td></tr><tr><td>1. Facebook</td><td>-</td><td>14(5.38)</td><td>14</td></tr><tr><td>2. Instagram</td><td>137(52.69)</td><td>92(35.38)</td><td>246</td></tr><tr><td>3. Youtube</td><td>79(30.38)</td><td>109(41.92)</td><td>171</td></tr><tr><td>4. Snapchat</td><td>31(11.92)</td><td>18(6.92)</td><td>49</td></tr><tr><td>5. WhatsApp</td><td>13(5)</td><td>27 (10.38)</td><td>40</td></tr><tr><td colspan="4">Satisfaction from SM apps</td></tr><tr><td>1. Highly satisfied</td><td>31(11.92)</td><td>63(24.23)</td><td>94</td></tr><tr><td>2. Satisfied</td><td>207(79.61)</td><td>187(71.92)</td><td>394</td></tr><tr><td>3. Dissatisfied</td><td>14(5.38)</td><td>7(2.69)</td><td>21</td></tr><tr><td>4. Highly dissatisfied</td><td>8(3.07)</td><td>3(1.15)</td><td>11</td></tr><tr><td colspan="4">Time Spent on SNS</td></tr><tr><td>1. <1.5</td><td>-</td><td>260(100)</td><td>260</td></tr><tr><td>2. 1.5-3</td><td>122(46.92)</td><td>-</td><td>122</td></tr><tr><td>3. 3-6</td><td>98(37.69)</td><td>-</td><td>98</td></tr><tr><td>4. ≥6</td><td>40(15.38)</td><td>-</td><td>40</td></tr><tr><td colspan="4">Emotions Experienced while using SNS</td></tr><tr><td>1. Rejection</td><td>5(1.92)</td><td>1(0.38)</td><td>6</td></tr><tr><td>2. Happiness</td><td>132(50.77)</td><td>80(30.77)</td><td>212</td></tr><tr><td>3. Boost Self Esteem</td><td>27(10.38)</td><td>39(15)</td><td>66</td></tr><tr><td>4. Jealousy</td><td>5(1.92)</td><td>-</td><td>5</td></tr><tr><td>5. Motivation/Inspiration</td><td>81(31.15)</td><td>135(51.92)</td><td>216</td></tr><tr><td>6. Fear Of Missing Out</td><td>9(3.47)</td><td>3(1.15)</td><td>12</td></tr><tr><td>7. Lower Self Esteem</td><td>1(0.38)</td><td>2(0.77)</td><td>3</td></tr><tr><td colspan="4">SM used for Learning and Attract to People towards Healthy Behavior</td></tr><tr><td>1. Yes</td><td>213(81.92)</td><td>239(91.92)</td><td>452</td></tr><tr><td>2. No</td><td>47(18.07)</td><td>21(8.07)</td><td>68</td></tr><tr><td colspan="4">Access of Devices</td></tr><tr><td>1. Mobile</td><td>250(96.15)</td><td>23(8.84)</td><td>273</td></tr><tr><td>2. Laptop</td><td>3(1.15)</td><td>-</td><td>3</td></tr><tr><td>3. Computer</td><td>5(1.92)</td><td>160(61.53)</td><td>165</td></tr><tr><td>4. Tablet</td><td>2(0.77)</td><td>77(29.61)</td><td>79</td></tr><tr><td colspan="4">Mostly used Device</td></tr><tr><td>1. Mobile</td><td>248(95.38)</td><td>27(10.38)</td><td>275</td></tr><tr><td>2. Laptop</td><td>4(1.53)</td><td>-</td><td>4</td></tr><tr><td>3. Computer</td><td>4(1.53)</td><td>153(58.84)</td><td>157</td></tr><tr><td>4. Tablet</td><td>4(1.53)</td><td>80(30.77)</td><td>84</td></tr><tr><td colspan="4">SM Effected your Nutritional and Health Status</td></tr><tr><td>1. Yes</td><td>159(61.15)</td><td>116(44.61)</td><td>275</td></tr><tr><td>2. No</td><td>101(38.84)</td><td>144(55.38)</td><td>245</td></tr><tr><td colspan="4">Use SM for Practical Nutrition Purposes, Including Recipes</td></tr><tr><td>1. Yes</td><td>220(84.61)</td><td>184(70.77)</td><td>404</td></tr><tr><td>2. No</td><td>40(15.38)</td><td>76(29.23)</td><td>116</td></tr><tr><td colspan="4">SM platforms used to access nutrition information</td></tr><tr><td>1. Youtube</td><td>178(68.46)</td><td>210(80.77)</td><td>388</td></tr><tr><td>2. Instagram</td><td>78(30)</td><td>48(18.46)</td><td>126</td></tr><tr><td>3. Facebook</td><td>3(1.15)</td><td>-</td><td>3</td></tr><tr><td>4. Telegram</td><td>1(0.38)</td><td>2(0.77)</td><td>3</td></tr><tr><td colspan="4">Follow any Fitness or Health Professional/Influencer Online</td></tr><tr><td>1. Yes</td><td>154(59.23)</td><td>119(45.77)</td><td>273</td></tr><tr><td>2. No</td><td>106(40.77)</td><td>141(54.23)</td><td>247</td></tr><tr><td colspan="4">Nutrition Information Gained from SM is Reliable in the Real World</td></tr><tr><td>1. Yes</td><td>128(49.23)</td><td>108(41.53)</td><td>236</td></tr><tr><td>2. No</td><td>132(50.77)</td><td>152(58.46)</td><td>284</td></tr><tr><td colspan="4">Influencers have the Power to Influence others by their Lifestyle, Behavior etc</td></tr><tr><td>1. Yes</td><td>222(85.38)</td><td>176(67.69)</td><td>398</td></tr><tr><td>2. No</td><td>38(14.61)</td><td>84(32.30)</td><td>122</td></tr><tr><td colspan="4">Consume/Purchase Food Brand Promoted by an Influencer</td></tr><tr><td>1. Yes</td><td>42(16.15)</td><td>27(10.38)</td><td>69</td></tr><tr><td>2. No</td><td>218(83.85)</td><td>233(89.61)</td><td>451</td></tr><tr><td colspan="4">Type of Influencer Followed</td></tr><tr><td>1. Fashion</td><td>148(56.92)</td><td>121(46.53)</td><td>269</td></tr><tr><td>2. Gaming</td><td>12(4.61)</td><td>36(13.85)</td><td>48</td></tr><tr><td>3. Food</td><td>100(38.46)</td><td>103(39.61)</td><td>203</td></tr><tr><td colspan="4">Interested in Joining Online Nutrition Camps through Any Social Networking Site</td></tr><tr><td>1. Yes</td><td>96(36.92)</td><td>66(25.38)</td><td>162</td></tr><tr><td>2. No</td><td>164(63.07)</td><td>194(74.61)</td><td>358</td></tr><tr><td colspan="4">Diet in Order to Change your Body Image Like your Favourite SM Personality</td></tr><tr><td>1. Yes</td><td>91(35)</td><td>68(26.15)</td><td>159</td></tr><tr><td>2. No</td><td>169(65)</td><td>192(73.85)</td><td>361</td></tr><tr><td colspan="4">Networking Sites Helped you Out in Gaining and Losing Weight</td></tr><tr><td>1. Yes</td><td>96(36.92)</td><td>76(29.23)</td><td>172</td></tr><tr><td>2. No</td><td>164(63.08)</td><td>184(70.77)</td><td>348</td></tr><tr><td colspan="4">Making use of these Apps have Altered Sleeping and Eating Pattern</td></tr><tr><td>1. Yes</td><td>143(55)</td><td>125(48.08)</td><td>268</td></tr><tr><td>2. No</td><td>117(45)</td><td>135(51.92)</td><td>252</td></tr><tr><td colspan="4">Qualities Leading to Follow an Influencer</td></tr><tr><td>1. Professional/qualified</td><td>92(35.38)</td><td>103(39.61)</td><td>191</td></tr><tr><td>2. Funny/interactive</td><td>88(33.85)</td><td>84(32.30)</td><td>176</td></tr><tr><td>3. Evidence based/talented</td><td>17(6.53)</td><td>24(9.23)</td><td>41</td></tr><tr><td>4. Regular posting</td><td>16(6.15)</td><td>11(4.23)</td><td>27</td></tr><tr><td>5. Body image positivity</td><td>15(5.77)</td><td>8(3.07)</td><td>23</td></tr><tr><td>6. Shares personal experiences</td><td>32(12.30)</td><td>30(11.53)</td><td>62</td></tr><tr><td colspan="4">Recipe and Food Purchasing Decision Changes After using SM</td></tr><tr><td>1. Yes</td><td>174(66.92)</td><td>150(57.69)</td><td>324</td></tr><tr><td>2. No</td><td>86(33.07)</td><td>110(42.30)</td><td>196</td></tr><tr><td colspan="4">How useful is SM for Learning</td></tr><tr><td>1. Not useful</td><td>11(4.23)</td><td>-</td><td>11</td></tr><tr><td>2. Somewhat useful</td><td>96(36.92)</td><td>90(34.61)</td><td>186</td></tr><tr><td>3. Very useful</td><td>153(58.84)</td><td>170(65.38)</td><td>323</td></tr><tr><td colspan="4">Search Content Related to Dieting, Fitness and Health</td></tr><tr><td>1. Yes</td><td>93(35.77)</td><td>97(37.31)</td><td>190</td></tr><tr><td>2. No</td><td>41(15.77)</td><td>56(21.54)</td><td>97</td></tr><tr><td>3. Read only when it appears</td><td>126(48.46)</td><td>107(41.15)</td><td>233</td></tr><tr><td colspan="4">Type of Content Like to See on SM</td></tr><tr><td>1. Fitness</td><td>53(20.38)</td><td>61(23.46)</td><td>114</td></tr><tr><td>2. Nutrition</td><td>25(9.61)</td><td>10(3.85)</td><td>35</td></tr><tr><td>3. Health and lifestyle</td><td>182(70)</td><td>189(72.69)</td><td>371</td></tr><tr><td colspan="4">Tried a Diet Promoted by an Social Media Influencer</td></tr><tr><td>1. Very frequently</td><td>27(10.38)</td><td>13(5)</td><td>40</td></tr><tr><td>2. Frequently</td><td>39(15)</td><td>25(9.61)</td><td>64</td></tr><tr><td>3. Occasionally</td><td>25(9.61)</td><td>19(7.31)</td><td>44</td></tr><tr><td>4. Rarely</td><td>71(27.31)</td><td>89(34.23)</td><td>160</td></tr><tr><td>5. Never</td><td>98(37.69)</td><td>114(43.85)</td><td>212</td></tr><tr><td colspan="4">SM Helped in Providing Nutritional knowledge</td></tr><tr><td>1. Yes</td><td>149(57.30)</td><td>112(43.07)</td><td>261</td></tr><tr><td>2. No</td><td>111(42.69)</td><td>148(56.92)</td><td>259</td></tr><tr><td colspan="4">SM Platforms used to Access Nutrition Information</td></tr><tr><td>1. Youtube</td><td>192(73.84)</td><td>228(87.69)</td><td>42</td></tr><tr><td>2. Instagram</td><td>65(25)</td><td>30(11.54)</td><td>95</td></tr><tr><td>3. Facebook</td><td>2(0.77)</td><td>-</td><td>2</td></tr><tr><td>4. Telegram</td><td>1(0.38)</td><td>2(0.77)</td><td>3</td></tr><tr><td colspan="4">SM Leads to Opt more of</td></tr><tr><td>1. Healthy foods</td><td>128(49.23)</td><td>163(62.69)</td><td>291</td></tr><tr><td>2. Junk foods</td><td>132(50.77)</td><td>97(37.31)</td><td>229</td></tr><tr><td colspan="4">Make use of Any Health-App to Stay Healthy</td></tr><tr><td>1. Yes</td><td>66(25.38)</td><td>53(20.38)</td><td>119</td></tr><tr><td>2. No</td><td>194(74.62)</td><td>207(79.62)</td><td>401</td></tr><tr><td colspan="4">Heard about Different Types of Diets among the Options</td></tr><tr><td>1. Mediterranean diet</td><td>19(7.31)</td><td>17(6.54)</td><td>39</td></tr><tr><td>2. Intermittent fasting</td><td>11(4.23)</td><td>2(0.77)</td><td>13</td></tr><tr><td>3. Vegan diet</td><td>45(17.31)</td><td>23(8.85)</td><td>68</td></tr><tr><td>4. Low carb diet</td><td>21(8.08)</td><td>7(2.69)</td><td>28</td></tr><tr><td>5. Ketogenic diet</td><td>3(1.15)</td><td>12(4.62)</td><td>15</td></tr><tr><td>6. None of the above</td><td>161(61.92)</td><td>199(76.54)</td><td>360</td></tr><tr><td colspan="4">Change in Existing Diet and Physical Activity Patterns After using SM Platforms</td></tr><tr><td>1. Yes</td><td>73(28.08)</td><td>62(23.85)</td><td>135</td></tr><tr><td>2. No</td><td>187(71.92)</td><td>198(76.15)</td><td>385</td></tr><tr><td colspan="4">Like to Entertain the Nutritional Advice</td></tr><tr><td>1. SM influencers</td><td>121(46.54)</td><td>91(35)</td><td>212</td></tr><tr><td>2. Qualified expert</td><td>139(53.46)</td><td>169(65)</td><td>308</td></tr><tr><td colspan="4">Prefer while Choosing Food</td></tr><tr><td>1. Taste of food</td><td>185(71.15)</td><td>188(72.31)</td><td>373</td></tr><tr><td>2. Nutrition content</td><td>52(20)</td><td>56(21.53)</td><td>108</td></tr><tr><td>3. Colour of food</td><td>5(1.92)</td><td>5(1.92)</td><td>10</td></tr><tr><td>4. Aroma of food</td><td>18(6.92)</td><td>11(4.23)</td><td>29</td></tr><tr><td colspan="4">Prefer the Most</td></tr><tr><td>1. Ordering online</td><td>82(31.54)</td><td>63(24.23)</td><td>145</td></tr><tr><td>2. Visiting store</td><td>178(68.46)</td><td>197(75.77)</td><td>375</td></tr><tr><td colspan="4">Sleeping Hours</td></tr><tr><td>1. 4-6 hours</td><td>71(27.31)</td><td>121(46.54)</td><td>192</td></tr><tr><td>2. 6-8 hours</td><td>144(55.38)</td><td>122(46.92)</td><td>266</td></tr><tr><td>3. More than 8 hour</td><td>45(17.31)</td><td>17(6.54)</td><td>62</td></tr><tr><td colspan="4">Posts on SM Leads to Cravings</td></tr><tr><td>1. Yes</td><td>187(71.92)</td><td>162(62.31)</td><td>349</td></tr><tr><td>2. No</td><td>73(28.08)</td><td>98(37.69)</td><td>171</td></tr><tr><td colspan="4">Usage of SM Affected your Food Consumption</td></tr><tr><td>1. Yes</td><td>114(43.85)</td><td>78(30)</td><td>192</td></tr><tr><td>2. No</td><td>146(56.15)</td><td>182(70)</td><td>328</td></tr><tr><td colspan="4">Use SM to Receive Information about Healthy Eating</td></tr><tr><td>1. Yes</td><td>162(62.31)</td><td>179(68.85)</td><td>341</td></tr><tr><td>2. No</td><td>98(37.69)</td><td>81(31.15)</td><td>179</td></tr><tr><td colspan="4">Check out the Nutritional Quality of Food Product before Consuming</td></tr><tr><td>1. Yes</td><td>159(61.15)</td><td>196(75.38)</td><td>355</td></tr><tr><td>2. No</td><td>101(38.85)</td><td>64(24.62)</td><td>165</td></tr><tr><td colspan="4">Make Food Choices According the Healthiness of Food</td></tr><tr><td>1. Yes</td><td>130(50)</td><td>162(62.31)</td><td>292</td></tr><tr><td>2. No</td><td>130(50)</td><td>98(37.69)</td><td>228</td></tr><tr><td colspan="4">Utilize SM while Making Decisions in Regards to the Food you Eat at Restaurants</td></tr><tr><td>1. Yes</td><td>68(26.15)</td><td>62(23.85)</td><td>130</td></tr><tr><td>2. No</td><td>192(73.85)</td><td>198(76.15)</td><td>390</td></tr><tr><td colspan="4">Skip Meals While using SM Platforms</td></tr><tr><td>1. Yes</td><td>98(37.69)</td><td>74(28.46)</td><td>172</td></tr><tr><td>2. No</td><td>162(62.31)</td><td>186(71.54)</td><td>348</td></tr><tr><td colspan="4">More Prone to Eating While using SM Platforms</td></tr><tr><td>1. Yes</td><td>135(51.92)</td><td>92(35.38)</td><td>227</td></tr><tr><td>2. No</td><td>125(48.07)</td><td>168(64.62)</td><td>293</td></tr><tr><td colspan="4">Ever Shared Information or Advice Related to Nutrition with Friends and Family</td></tr><tr><td>1. Yes</td><td>167(64.23)</td><td>164(63.07)</td><td>331</td></tr><tr><td>2. No</td><td>93(35.77)</td><td>96(36.92)</td><td>189</td></tr><tr><td colspan="4">Skip any Outdoor Activity to Watch SM</td></tr><tr><td>1. Yes</td><td>118(45.38)</td><td>102(39.23)</td><td>220</td></tr><tr><td>2. No</td><td>142(54.62)</td><td>158(60.77)</td><td>300</td></tr><tr><td colspan="4">SNS Affected Mental Health and Overall Wellbeing</td></tr><tr><td>1. Yes</td><td>151(58.08)</td><td>148(56.92)</td><td>299</td></tr><tr><td>2. No</td><td>109(41.92)</td><td>112(43.08)</td><td>221</td></tr></table>
Figures in parenthesis indicate percentages
SM (Social Media)
SNS (Social Networking Sites)
### e) Dietary Information
## i. Dietary Pattern
The study evaluated food preferences and dietary behaviors among rural and urban populations, each consisting of 260 participants divided equally into users and non-users (n=130 in each group). In terms of food habits, $51.92\%$ of the total sample (n=270) identified as vegetarians, with rural users $(59.23\%)$ having the highest proportion, followed by urban non-users $(55.38\%)$. Non-vegetarians accounted for $30.77\%$ (n=160) of the participants, with similar proportions across all subgroups. Ova-vegetarians, making up $17.31\%$ (n=90) of the sample, were most common among rural non-users $(24.62\%)$.
Regarding meal frequency, the majority of respondents (71.15%, n=370) reported consuming three meals per day, with urban non-users (91.54%) being the most consistent in this pattern. A smaller group (19.23%, n=100) reported having four meals daily, particularly among rural users (27.69%). Only 9.62% (n=50) reported eating two meals, mostly rural users (26.15%).
Water intake varied across the sample, with $47\%$ $(n = 244)$ consuming 4-6 glasses daily and $37.88\%$ $(n = 197)$ reporting drinking more than six glasses, with non-users generally exhibiting higher water consumption. A small percentage $(15.19\%, n = 79)$ drank less than four glasses of water, more notably among rural users $(24.62\%)$. Snacking behavior was prevalent, with $92.12\%$ $(n = 479)$ of participants reporting a preference for snacking or munching. This behavior was especially prominent among rural users $(96.15\%)$ and urban users $(94.62\%)$, indicating that both populations strongly favored between-meal snacks.
## ii. Food Intake
### 1. Cereals and Millets
Rural participants showed slightly higher cereal and millet intake overall, with users averaging $137.88 \pm 47.82$ grams compared to non-users at $129.47 \pm 38.83$ grams. Interestingly, urban non-users reported consuming more $(131.19 \pm 39.86$ grams) than users $(125.60 \pm 54.30$ grams). These differences, however, were statistically non-significant, suggesting that cereal consumption was fairly consistent across both settings, possibly reflecting the staple nature of these foods in both rural and urban diets. Vegetarian as well as non-vegetarian dietary pattern of Indians include consumption of cereals as staple and rice remains priority.
#### 2. Pulses and Legumes
Consumption of pulses and legumes varied slightly. In rural areas, non-users reported a higher intake $(75.25 \pm 47.27$ grams) than users $(67.45 \pm 51.84$ grams). Similarly, in urban settings, non-users consumed more $(70.75 \pm 51.98$ grams) than users $(60.11 \pm 37.03$ grams). While pulses are excellent, inexpensive sources of protein, the non-significant differences suggest that both users and non-users, irrespective of setting, access these foods to meet their nutritional needs.
#### 3. Green Leafy Vegetables (GLV)
Green leafy vegetables (GLV) intake was generally higher in urban areas compared to rural ones. Urban users consumed $48.56 \pm 19.22$ grams, while non-users averaged $45.45 \pm 16.21$ grams. Conversely, rural participants reported a lower intake, with users consuming $42.05 \pm 15.97$ grams and non-users $44.22 \pm 12.10$ grams. The lack of significant differences indicates that GLV consumption is maintained at comparable levels across all groups, though slightly elevated among urban participants, possibly due to better availability or awareness.
#### 4. Other Vegetables
The intake of other vegetables also varied between groups. Rural users consumed an average of $105.90 \pm 63.21$ grams, slightly more than non-users at $94.91 \pm 59.59$ grams. In urban areas, however, non-users reported slightly higher consumption ( $93.47 \pm 34.41$ grams) compared to users ( $87.70 \pm 57.39$ grams). Despite these minor variations, the differences remained non-significant, suggesting that both rural and urban populations, regardless of social media usage, incorporate a similar amount of vegetables into their diet.
#### 5. Fruits
Fruit consumption displayed a significant difference in rural settings $(p < 0.05)$. Rural non-users consumed more $(92.67 \pm 58.24$ grams) than users $(61.97 \pm 30.85$ grams). This may indicate that rural non-users rely more heavily on fruits as a part of their regular diet. However, in urban areas, no significant difference was observed, with users consuming $47.84 \pm 33.30$ grams and non-users $44.47 \pm 25.26$ grams. The discrepancy in rural fruit intake might reflect lifestyle or economic differences between users and non-users.
Table 4.7: Food Intake of the Selected Subjects
<table><tr><td rowspan="2">Food groups</td><td rowspan="2">SDI(g)#</td><td colspan="3">Rural (n=260)</td><td colspan="3">Urban (n=260)</td></tr><tr><td>User(n=130)</td><td>Non user(n=130)</td><td>t test(p value)</td><td>User(n=130)</td><td>Non user(n=130)</td><td>t test(p value)</td></tr><tr><td>Cereals and millets</td><td>315</td><td>137.88±47.82</td><td>129.47±38.83</td><td>1.556(0.120)NS</td><td>125.60±54.30</td><td>131.19±39.86</td><td>0.947(0.344)NS</td></tr><tr><td>Pulses and legumes</td><td>105</td><td>67.45±51.84</td><td>75.25±47.27</td><td>1.264(0.207)NS</td><td>60.11±37.03</td><td>70.75±51.98</td><td>1.900(0.058)NS</td></tr><tr><td>GLV</td><td>100</td><td>42.05±15.97</td><td>44.22±12.10</td><td>1.234(0.218)NS</td><td>48.56±19.22</td><td>45.45±16.21</td><td>1.410(0.159)NS</td></tr><tr><td>Other vegetables</td><td>200</td><td>105.90±63.21</td><td>94.918±59.59</td><td>1.441(0.150)NS</td><td>87.70±57.39</td><td>93.47±34.41</td><td>0.983(0.326)NS</td></tr><tr><td>Fruits</td><td>150</td><td>61.97±30.85</td><td>92.67±58.24</td><td>4.083(0.000)*</td><td>47.84±33.30</td><td>44.47±25.26</td><td>0.550(0.583)NS</td></tr><tr><td>Roots and tubers</td><td>100</td><td>53.93±39.02</td><td>60.71±50.10</td><td>1.217(0.224)NS</td><td>49.69±26.83</td><td>54.66±37.84</td><td>1.409(0.165)NS</td></tr><tr><td>Milk and milk products</td><td>400</td><td>341.60±135.8</td><td>337.05±140.8</td><td>0.264(0.791)NS</td><td>327.55±129.8</td><td>326.58±160.9</td><td>0.053(0.957)NS</td></tr><tr><td>Edible oils and fats</td><td>40</td><td>30.19±6.92</td><td>21.93±8.67</td><td>8.455(0.000)*</td><td>21.34±10.24</td><td>16.13±11.39</td><td>3.872(0.000)*</td></tr></table>
 Fig. 4.1: Nutrient Adequacy Ratio of Food Groups among Rural user and Non-User Group and Urban User and Non-User Groups
#### 6. Roots and Tubers
Rural users reported a slightly lower intake of roots and tubers $(53.93 \pm 39.02$ grams) compared to non-users $(60.71 \pm 50.10$ grams). Similarly, in urban areas, users consumed $49.69 \pm 26.83$ grams, slightly less than non-users $(54.66 \pm 37.84$ grams). These differences were not statistically significant, indicating that roots and tubers are consumed consistently across different groups.
#### 7. Milk and Milk Products
The intake of milk and milk products was relatively high across all groups, with rural users consuming $341.60 \pm 135.8$ grams and non-users reporting $337.05 \pm 140.8$ grams. In urban areas, users reported a similar intake ( $327.55 \pm 129.8$ grams) compared to non-users ( $326.58 \pm 160.9$ grams). The lack of significant differences suggests that milk is an essential dietary component for both users and non-users, regardless of their geographical location.
#### 8. Edible Oils and Fats
Significant differences in edible oils and fats consumption were observed in both rural and urban areas $(p < 0.05)$. Rural users consumed significantly more $(30.19 \pm 6.92$ grams) compared to non-users $(21.93 \pm 8.67$ grams). Similarly, in urban areas, users reported a higher intake $(21.34 \pm 10.24$ grams) than non-users $(16.13 \pm 11.39$ grams). These findings suggest that social media users may be more inclined to consume higher amounts of fats, potentially influenced by trends in cooking practices or the promotion of specific diets online.
## iii. Nutrient Intake
### 1. Energy
Both rural and urban populations reported average energy intakes below the recommended 2500 kcal per day. Rural users exhibited a mean energy intake of 2083 kcal, compared to 1920.62 kcal in rural non-users, while urban users and non-users reported 1863.55 kcal and 1714.8 kcal, respectively. Despite these differences, no statistical significance was observed $(p > 0.05)$.
#### 2. Protein
Protein intake also remained below the RDA of 46g for all groups. Rural users consumed an average of $31.87 \pm 14.52\mathrm{g}$, while non-users reached $33.65 \pm 12.75\mathrm{g}$. In urban areas, users averaged $27.54 \pm 14.51\mathrm{g}$, with non-users at $28.11 \pm 15.44\mathrm{g}$. Again, differences between groups were not statistically significant ( $p > 0.05$ ).
#### 3. Total Fat
Rural and urban populations consumed levels of fat just under the recommended 25g, with rural users averaging 22.14g compared to 17.92g for non-users, while urban users and non-users consumed 20.34g and 16.83g, respectively. Differences were statistically significant in both settings $(p < 0.05)$, suggesting that users generally had higher fat intakes.
#### 4. Total Dietary Fibre
Dietary fiber intake showed close adherence to the 38g RDA among rural users (32.04g) and non-users (33.20g), while urban users and non-users recorded averages of 27.95g and 29.50g, respectively, with no significant difference between groups $(p > 0.05)$.
#### 5. Calcium
Calcium intake fell short of the 1050mg RDA across all groups. Rural users averaged 1005.6mg, and rural non-users reported 966.52mg, while urban users and non-users had averages of 673.14mg and 714.32mg, respectively, without significant differences $(p > 0.05)$.
#### 6. Iron
Iron intake was markedly lower than the RDA of 32mg for both rural and urban participants. Rural users averaged $11.91 \pm 4.03\mathrm{mg}$, while non-users consumed $14.97 \pm 3.65\mathrm{mg}$, with a significant difference between these groups (p < 0.05). In urban areas, users and non-users reported averages of 10.85mg and 11.64mg, respectively, though this difference was not significant (p > 0.05).
#### 7. Magnesium
With an RDA of 380mg, magnesium intake was reported as lower among all groups, with rural users consuming 288.93mg compared to 302.46mg in non-users. Urban users and non-users reported 221.29mg and 229.32mg, respectively, with no significant differences across groups $(p > 0.05)$.
Table 4.8: Mean Daily Average Consumption of Different Nutrients among Selected Adolescents
<table><tr><td rowspan="2">Nutrients</td><td rowspan="2">RDA#</td><td colspan="3">Rural (n=260)</td><td colspan="3">Urban (n=260)</td></tr><tr><td>User (n=130)</td><td>Non user (n=130)</td><td>t test (p value)</td><td>User (n=130)</td><td>Non user (n=130)</td><td>t test (p value)</td></tr><tr><td>Protein (g)</td><td>46</td><td>31.87±14.52</td><td>33.65±12.75</td><td>1.047(0.295)NS</td><td>27.54±14.51</td><td>28.11±15.44</td><td>0.305(0.760)NS</td></tr><tr><td>Total fat (g)</td><td>25</td><td>22.14±7.08</td><td>17.92±6.00</td><td>5.179(0.000)*</td><td>20.34±8.97</td><td>16.83±11.73</td><td>2.706(0.007)*</td></tr><tr><td>Total dietary fibre (g)</td><td>38</td><td>32.04±9.18</td><td>33.20±8.28</td><td>1.069(0.285)NS</td><td>27.95±8.36</td><td>29.50±9.54</td><td>1.397(0.165)NS</td></tr><tr><td>Energy (kcal)</td><td>2500</td><td>2083±805.96</td><td>1920.62±784.4</td><td>1.563(0.119)NS</td><td>1863.55±903.8</td><td>1714.8±679.9</td><td>1.499(0.135)NS</td></tr><tr><td>Calcium (mg)</td><td>1050</td><td>1005.6±270.7</td><td>966.52±240.46</td><td>1.379(0.168)NS</td><td>673.14±296.27</td><td>714.32±300.7</td><td>1.111(0.267)NS</td></tr><tr><td>Iron (mg)</td><td>32</td><td>11.91±4.03</td><td>14.97±3.65</td><td>4.308(0.000)*</td><td>10.85±4.26</td><td>11.64±4.47</td><td>1.458(0.145)NS</td></tr><tr><td>Magnesium (mg)</td><td>380</td><td>288.93±62.37</td><td>302.46±80.71</td><td>1.511(0.131)NS</td><td>221.29±53.41</td><td>229.32±44.76</td><td>1.314(0.190)NS</td></tr><tr><td>Zinc (mg)</td><td>14.2</td><td>8.63±5.01</td><td>8.99±4.97</td><td>0.578(0.563)NS</td><td>6.37±2.59</td><td>7.06±2.81</td><td>2.059(0.040)**</td></tr></table>
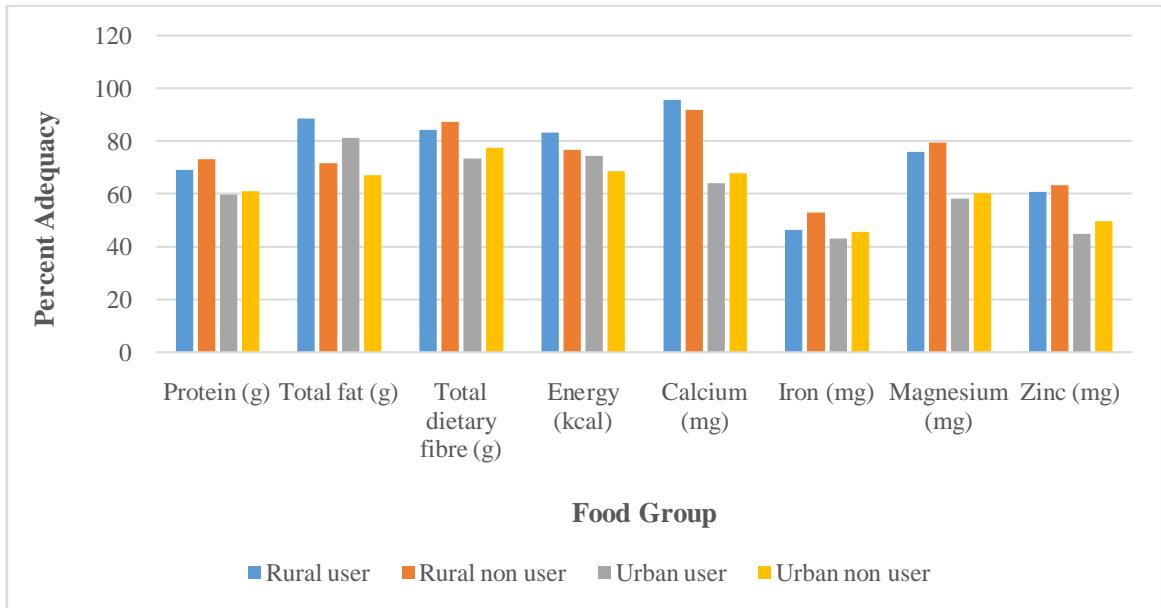 Fig. 4.2: Nutrient Adequacy Ratio of Nutrient Intake among Rural User and Non-User Group And Urban User and Non-User Groups
#### 8. Zinc
Zinc consumption levels were below the RDA of 14.2mg for both rural and urban populations. Rural users consumed 8.63mg, and non-users 8.99mg, while urban users and non-users reported 6.37mg and 7.06mg, respectively. A significant difference was observed among urban participants $(p < 0.05)$, indicating that non-users tend to have a higher zinc adequacy.
## iv. Dietary Diversity Score (DDS)
The Dietary Diversity Score (DDS) among the selected rural and urban subjects revealed notable differences between users and non-users. Table 4.9 presents these findings, where the DDS was classified into three categories: low (1-4), moderate (5-9) and high (10-14).
Rural Users had a mean DDS of $8.94 \pm 1.44$, significantly higher than the Non-users $(7.25 \pm 1.6)$ with a p-value of 0.000, indicating a statistically significant difference. Urban Users presented a mean DDS of $8.76 \pm 1.6$, also higher than Urban Non-users $(8.06 \pm 1.55)$, with a significant p-value of 0.001.
The majority of both rural and urban subjects fell within the moderate DDS category (5-9), with $73.85\%$
of rural users and $91.53\%$ of rural non-users in this range. A smaller but notable portion of the sample achieved a high DDS (10-14), with $26.15\%$ of rural users and $27.7\%$ of urban users meeting this criterion, indicating a higher dietary diversity among users in both settings.
There is a clear trend showing higher dietary diversity scores among users across both rural and urban settings, highlighting the possible influence of certain factors (e.g., socio-economic, education) on dietary choices.
Table 4.9: Dietary Diversity Score (DDS) of Selected Adolescent Girls
<table><tr><td rowspan="2">Dietary Diversity Score</td><td colspan="3">Rural (n=260)</td><td colspan="3">Urban (n=260)</td></tr><tr><td>User (n=130)</td><td>Non-user (n=130)</td><td>t test (p value)</td><td>User (n=130)</td><td>Non-user (n=130)</td><td>t test (p value)</td></tr><tr><td>Mean±SD</td><td>8.94±1.44</td><td>7.25±1.6</td><td>8.92(0.000)*</td><td>8.76±1.6</td><td>8.06±1.55</td><td>3.495(0.001)*</td></tr><tr><td>Low (1-4)</td><td>-</td><td>-</td><td></td><td>-</td><td>-</td><td></td></tr><tr><td>Moderate (5-9)</td><td>96(73.85)</td><td>119(91.53)</td><td></td><td>94(72.3)</td><td>116(89.23)</td><td></td></tr><tr><td>High (10-14)</td><td>34(26.15)</td><td>11(8.46)</td><td></td><td>36(27.7)</td><td>14(10.77)</td><td></td></tr></table>
### f) Anthropometric Measurement of the Selected Subjects
In the rural group, the height for users was recorded at $159.097 \pm 7.00$ cm, closely aligning with non-users at $159.139 \pm 6.85$ cm. The p-value (0.738) indicates no statistically significant difference. In the urban group, users had a height of $159.178 \pm 6.90$ cm compared to non-users at $158.754 \pm 9.35$ cm, also showing no significant variation ( $p = 0.383$ ).
Weight analysis revealed a statistically significant difference in both rural and urban populations. Rural users weighed $44.246 \pm 8.943 \, \mathrm{kg}$ compared to non-users at $47.030 \pm 5.378 \, \mathrm{kg}$, with a p-value of 0.002. Urban users were heavier at $48.920 \pm 10.08 \, \mathrm{kg}$, contrasting with $45.473 \pm 6.503 \, \mathrm{kg}$ for non-users, yielding a significant p-value of 0.001.
BMI showed significant differences within both groups. Rural users had a BMI of $17.620 \pm 3.554 \, \mathrm{kg/m^2}$, whereas non-users recorded $18.769 \pm 2.253 \, \mathrm{kg/m^2}$ ( $p=0.002$ ). Urban users displayed a BMI of $19.274 \pm 4.140 \, \mathrm{kg/m^2}$ compared to $17.897 \pm 2.151 \, \mathrm{kg/m^2}$ in non-users, resulting in a highly significant p-value of 0.000.
The waist-to-hip ratio remained consistent, with rural users having a ratio of $0.79 \pm 0.299$ and non-users at $0.78 \pm 0.283$ ( $p = 0.506$ ). Urban values were similarly close, with users at $0.785 \pm 0.291$ and non-users at $0.783 \pm 0.277$ ( $p = 0.643$ ).
Both rural and urban groups exhibited a waist-to-height ratio of approximately 0.43. Rural users had a mean of $0.43 \pm 0.061$, while non-users presented $0.43 \pm 0.060$. Urban users maintained a ratio of $0.43 \pm 0.0614$, slightly lower than non-users at $0.44 \pm 0.187$. Neither group demonstrated significant differences in this parameter (rural $p = 0.101$, urban $p = 0.571$ ).
Table 4.13: Basic and Derived Anthropometric Parameters of the Subjects
<table><tr><td rowspan="2">Anthropometric parameters</td><td colspan="2">Rural (n=260)</td><td rowspan="2">T test (p value)</td><td colspan="2">Urban (n=260)</td><td rowspan="2">T test (p value)</td></tr><tr><td>User (n=130)</td><td>Non user (n=130)</td><td>User (n=130)</td><td>Non user (n=130)</td></tr><tr><td>Height (cm)</td><td>159.097±7.00</td><td>159.139±6.85</td><td>0.334(0.738)NS</td><td>159.178±6.90</td><td>158.754±9.35</td><td>0.873(0.383)NS</td></tr><tr><td>Weight (kg)</td><td>44.246±8.943</td><td>47.030±5.378</td><td>3.041(0.002)*</td><td>48.920±10.08</td><td>45.473±6.503</td><td>3.275(0.001)*</td></tr><tr><td>BMI (kg/m2)</td><td>17.620±3.554</td><td>18.769±2.253</td><td>3.115(0.002)*</td><td>19.274±4.140</td><td>17.897±2.151</td><td>3.363(0.000)*</td></tr><tr><td>Waist to hip ratio</td><td>0.79±0.299</td><td>0.78±0.283</td><td>0.665(0.506)NS</td><td>0.785±0.291</td><td>0.783±0.277</td><td>0.463(0.643)NS</td></tr><tr><td>Waist height ratio</td><td>0.43±0.061</td><td>0.43±0.060</td><td>1.643(0.101)NS</td><td>0.43±0.0614</td><td>0.44±0.187</td><td>0.567(0.571)NS</td></tr></table>
Classification of Subjects based on BMI
The nutritional status of the selected participants, measured through Body Mass Index (BMI), revealed that under nutrition was prevalent in both rural and urban areas.
Table 4.15: Nutritional Status among Selected Subjects in Reference to Body Mass Index
<table><tr><td>Selected subjects</td><td>Rural(n=260)</td><td>Urban(n=260)</td><td>Total(N=520)</td></tr><tr><td>Underweight(<18.50)</td><td>151(58.07)</td><td>152(58.46)</td><td>303</td></tr><tr><td>Normal(18.5-22.99)</td><td>95(36.53)</td><td>87(33.46)</td><td>182</td></tr><tr><td>Overweight(23-24.99)</td><td>12(4.61)</td><td>9(3.46)</td><td>21</td></tr><tr><td>Pre-obese(25-29.99)</td><td>2(0.77)</td><td>10(3.84)</td><td>12</td></tr><tr><td>Obese(>30)</td><td>-</td><td>-</td><td>-</td></tr><tr><td>Grade I (30-40)</td><td>-</td><td>2(0.77)</td><td>2</td></tr></table>
Figures in parenthesis indicate percentage
### g) Correlation Coefficient
The study evaluated the relationship between dietary intake, food consumption patterns, fast food frequency and anthropometric indices in adolescents $(n = 520)$.
#### 1. Dietary Intake
Protein: Negatively correlated (r = -0.153, p < 0.01), suggesting its potential protective role in managing weight.
Total Fat and Carbohydrates: Positive correlations (r = 0.127 and 0.129, respectively, p < 0.01), indicating their contribution to weight gain.
Dietary Fiber: Showed a protective negative correlation (r = -0.119, p < 0.01).
Energy: Positive correlation (r = 0.140, p < 0.01) reinforces its association with weight increase.
Micronutrients: Magnesium showed a negative correlation $(r = -0.159, p < 0.01)$, while calcium was not significantly related.
#### 2. Food Intake
Cereal and Millets: Positive correlation (r = 0.104, p < 0.01), potentially reflecting refined grain consumption.
Other Vegetables: Negative correlation (r = -0.176, p < 0.05), suggesting protective effects.
Fruits and Pulses: No significant associations.
$$
Edible Fats: Positive correlation (r = 0.116, p < 0.01).
$$
#### 3. Frequency of fast-food consumption
Significant positive correlations were observed for chocolates $(r = 0.182)$, ice creams $(r = 0.32)$, and potato chips $(r = 0.217)$ $(p < 0.01)$, indicating their association with weight gain. Other items like namkeen, French fries, and burgers showed moderate positive correlations.
#### 4. Anthropometric Parameters
Waist-to-Hip Ratio, Waist-to-Height Ratio and BMI: No significant associations, reflecting potential limitations of these measures for assessing adolescent body composition.
Table 4.17: Relationship of Social Media usage with Various Parameters
<table><tr><td>Parameters</td><td>Total (n=520)</td></tr><tr><td></td><td>Correlation coefficient 'r'</td></tr><tr><td colspan="2">Dietary Intake</td></tr><tr><td>Protein</td><td>-0.153**</td></tr><tr><td>Total Fat</td><td>0.127**</td></tr><tr><td>Total Dietary Fiber</td><td>-0.119**</td></tr><tr><td>Carbohydrates</td><td>0.129**</td></tr><tr><td>Energy</td><td>0.140**</td></tr><tr><td>Calcium</td><td>-0.120NS</td></tr><tr><td>Magnesium</td><td>-0.159**</td></tr><tr><td colspan="2">Food Intake</td></tr><tr><td>Cereal and Millets</td><td>0.104**</td></tr><tr><td>Pulses and Legumes</td><td>-0.002NS</td></tr><tr><td>Other Vegetables</td><td>-0.176*</td></tr><tr><td>Fruits</td><td>0.061NS</td></tr><tr><td>Edible Fats and Oils</td><td>0.116**</td></tr><tr><td colspan="2">Frequency Of Fast Food Consumption</td></tr><tr><td>Chocolates</td><td>0.182**</td></tr><tr><td>Maggi</td><td>0.112**</td></tr><tr><td>Ice creams</td><td>0.32*</td></tr><tr><td>Namkeen</td><td>0.132**</td></tr><tr><td>French fries</td><td>0.108**</td></tr><tr><td>Potato chips</td><td>0.217**</td></tr><tr><td>Burger</td><td>0.116**</td></tr><tr><td>Waist to Hip ratio</td><td>0.023 NS</td></tr><tr><td>Waist to Height ratio</td><td>0.010 NS</td></tr><tr><td>Body Mass Index</td><td>0.035 NS</td></tr></table>
## IV. DISCUSSION
The research, titled "Influence of Social Media Usage on Food Choices and Nutritional Status of School-Going Adolescent Girls Residing in Punjab," investigates the intricate relationship between social media engagement and its influence on the nutritional health of adolescent girls. Set against the backdrop of Punjab, a region with diverse socio-cultural influences, the study offers an in-depth look at the impact of social media on the daily lives and nutritional outcomes of young girls. With a substantial sample size of 520 students from government schools in both rural and urban settings, the study ensures a broad and representative perspective, capturing variations across different socioeconomic and geographic contexts.
### a) Comprehensive Parameter Assessment
To capture a holistic view of social media's influence on nutritional status, the study meticulously incorporated a diverse array of parameters. These parameters extend beyond mere social media use to include broader aspects of participants' health, lifestyle, and personal background. First, general demographic information was collected, providing foundational data on age, family background, and educational context, all of which shape an adolescent's access to social media and their perspectives on nutrition. This was complemented by an in-depth exploration of social media habits, where the study examined frequency of usage, preferred platforms, and types of content consumed. By assessing how often participants engage with social media and identifying the specific types of content they gravitate towards (e.g., health tips, influencer recommendations, recipes), the study could map a direct connection between online exposure and offline food choices.
### b) Analyzing Health and Dietary Patterns
To further understand the impact of social media, the study incorporated a thorough examination of the participants' medical history and dietary patterns. Recording any pre-existing health conditions provided insight into how social media may intersect with specific health vulnerabilities, such as predisposing factors for undernutrition or obesity. Dietary patterns, on the other hand, revealed the regular food habits of the participants, documenting meal frequency, types of food typically consumed, and any patterns of meal- skipping. This element of the study was essential to determine if social media influences behaviors such as snack preferences, junk food consumption, or adherence to diets promoted by online influencers. The study also explored whether participants made food choices based on social media content, including health claims from influencers or nutrition tips from popular posts.
## V. ANTHROPOMETRIC MEASUREMENTS AND MENARCHE STATUS
The research utilized anthropometric measurements to establish a baseline for assessing the nutritional status of participants. Measurements such as height, weight, body mass index (BMI), and waist and hip circumference were taken in alignment with WHO (2008) classification standards. These metrics provided objective data to evaluate the physical health and growth of participants, enabling a comparative analysis between those heavily engaged with social media and those with limited or no exposure. Additionally, the inclusion of menarche status- the age at which participants experienced the onset of menstruation offered insight into physical development and its relationship with nutritional intake, as menstruation significantly affects nutrient needs during adolescence. By considering menarche status, the study could explore whether social media's influence on body image and food choices intersected with physical and hormonal changes typical of this age group.
This structured discussion provides a multifaceted understanding of how social media intertwines with various aspects of adolescent life, highlighting both the benefits and challenges it poses to their nutritional well-being. For instance, while social media can serve as a valuable resource for health education, the influence of idealized body standards and the normalization of restrictive diets may also compromise the participants' nutritional status and overall health. The study ultimately underscores the complexity of social media's role in shaping adolescent health behaviors, especially in a culturally diverse region like Punjab, where traditional dietary practices intersect with modern digital influences.
### a) Socio-economic and Demographic Profile
The socio-demographic characteristics outlined in Table 4.1 reflect the diverse cultural, economic, and structural factors influencing adolescent health behaviors across rural and urban settings. While rural adolescents benefit from structured family environments and culturally rooted dietary practices, they often face nutritional limitations due to restricted food variety and lower income levels (Government of India, 2019; Kumar et al., 2020). Urban adolescents, although exposed to a wider range of food choices and greater autonomy, are increasingly susceptible to unhealthy dietary trends driven by convenience and modern lifestyles (Narayan et al., 2021; Gupta & Verma, 2021).
These contrasting realities emphasize the importance of designing context-specific health interventions. For rural areas, strategies should focus on enhancing awareness and access to affordable, nutrient-rich foods within culturally acceptable frameworks (Banerjee & Dey, 2018; Kumar & Kaur, 2020). Urban interventions, on the other hand, must promote mindful eating and reduce dependency on processed foods by leveraging nutrition education and family-based approaches (Sharma et al., 2020; Chaudhary et al., 2017). Tailored public health initiatives that respect socio-demographic nuances will be crucial in fostering sustainable improvements in adolescent nutrition and well-being across both rural and urban populations.
### b) Medical History
The health and medical background (Table 4.2) showcases minimal prevalence of chronic health conditions such as diabetes and hypertension, which are expectedly low in an adolescent population but present notable urban-rural contrasts. Rural subjects exhibited a slightly higher rate of hypertension (1.53% rural vs. 0.38% urban). Although hypertension is generally uncommon in adolescents, those from rural areas might face stressors related to lower socioeconomic status or limited healthcare access, which can increase health risks (Patel et al., 2020).
A greater portion of urban subjects reported regular medical check-ups (48.08%) compared to rural counterparts (42.31%), possibly due to urban areas' greater healthcare accessibility. Regular medical check-ups are vital for early detection of potential health issues, which may otherwise go unnoticed in rural settings where healthcare resources are limited (Sharma et al., 2019). This urban-rural discrepancy is further reflected in the slightly higher usage of medications among urban adolescents (6.15%) versus rural (5.77%).
### c) Menarche Status
In conclusion, the analysis of menstrual health in Table 4.3 underscores the close interplay between age at menarche, menstrual irregularities, and nutritional status among adolescents. The observed differences between rural and urban participants in menstrual patterns and associated symptoms highlight the role of environmental, dietary, and lifestyle factors in shaping reproductive health outcomes (Raj & Sagar, 2019). The higher prevalence of dysmenorrhea and menstrual irregularities among nutritionally compromised adolescents points to a pressing need for integrated health strategies that address both nutrition and menstrual well-being.
Iron, calcium, and vitamin D deficiencies frequently observed among those with irregular or painful cycles- should be a central focus of adolescent health interventions. Efforts to improve awareness through school-based health education, community programs, and adolescent-friendly health services can play a vital role in promoting timely menarche and reducing the burden of menstrual disorders. Incorporating culturally appropriate and practical dietary guidance into routine adolescent health promotion can help ensure that young girls are better equipped to manage their menstrual health and overall development (Raj & Sagar, 2019).
### d) Dietary Information
## i. Dietary Pattern
Urban adolescents showed a greater preference for non-vegetarian diets (31.54%) compared to rural adolescents (29.23%), likely due to better food access in urban areas (Malik et al., 2020). Most adolescents in both areas preferred three meals a day (76.15% rural, 91.54% urban), suggesting structured eating habits (Narang & Mathur, 2018). Water intake was inadequate, with 24.62% of rural adolescents drinking fewer than four glasses daily, highlighting a need for better hydration awareness (Patel et al., 2019).
## ii. Food Intake
Cereals and millets are key to both rural and urban diets. Rural SM users consumed $43.8\%$ of the recommended intake, slightly higher than non-users $(41.1\%)$, but these differences were not significant (FAO, 2021). Pulses were consumed more by non-users in both areas, suggesting a shift towards processed protein sources among SM users (Popkin, 2020). Urban adolescents showed slightly better intake of Green Leafy Vegetables (GLVs), possibly due to health trends on SM platforms (WHO, 2021). However, fruit consumption was notably lower among SM users in rural areas, emphasizing the need for interventions to promote fresh fruit intake (FAO, 2021). Intake of roots, tubers, milk products, and oils showed some regional differences but were not statistically significant.
## iii. Nutrient Intake
Protein intake was lower than recommended in both rural (31.87 g) and urban (27.54 g) adolescents, with rural diets benefiting from pulses and legumes (Reddy & Kumar, 2020). Fat intake exceeded the RDA in both groups, highlighting reliance on oils and fried foods
(Malik et al., 2020). Fiber intake was higher in rural areas (32.04 g) compared to urban (27.95 g), suggesting that rural diets, which include more whole grains, are more fiber-rich (Patel et al., 2019). Both groups had caloric deficiencies, with rural adolescents consuming 2,083 kcal and urban 1,863 kcal, potentially affecting growth and energy levels (Verma & Thomas, 2019). Calcium intake was adequate in rural areas but deficient in urban areas (Gupta et al., 2021). Iron, magnesium, and zinc intakes were below the RDA in both groups, with urban adolescents showing lower intake of these minerals (Banerjee & Dey, 2018).
## iv. Dietary Diversity Score (DDS)
The dietary diversity score (DDS) analysis reveals notable differences in food intake and nutritional status between rural and urban adolescents. Rural adolescents consume more fruits and protein but still fall short of recommended intakes for fruits and micronutrients like iron and calcium, which increases the risk of deficiencies (Patel et al., 2019; Rao et al., 2017; Banerjee & Dey, 2018). Urban adolescents, on the other hand, consume more fats, exceeding the recommended intake, which may contribute to higher BMI and fat percentage due to processed food consumption (Malik et al., 2020; Nelson et al., 2021). Despite this, urban adolescents have higher DDS, indicating a more varied diet, with over $27.7\%$ achieving high diversity scores compared to $26.15\%$ in rural areas (Gupta et al., 2021).
Social media users scored higher on DDS than non-users, suggesting that social media may influence dietary diversity by exposing adolescents to new food trends and recipes (Holmberg et al., 2019). However, higher dietary diversity does not necessarily imply improved nutritional quality, as social media can also promote high-calorie, low-nutrient foods (Dunlop et al., 2016). This emphasizes the need for health education programs that guide adolescents in making nutritious choices amidst diverse food options, combining the benefits of dietary diversity with an emphasis on nutrition (Tatlow-Golden et al., 2017).
### e) Anthropometric Measurements
Anthropometric measurements reveal significant differences between rural and urban adolescents. Urban adolescents have higher mean weight (48.92 kg vs. 44.25 kg) and BMI (19.27 vs. 17.62), with the BMI of rural adolescents falling below the normal threshold (Rao et al., 2017). This reflects urban access to diverse, calorically dense foods (Verma & Thomas, 2019). Rural adolescents have a higher prevalence of underweight (58.07%), linked to limited food variety and economic constraints (Reddy & Kumar, 2020; Bhattacharya et al., 2020). Although waist-to-hip ratios were not significantly different, urban adolescents had a higher ratio (0.785 vs. 0.78), suggesting a risk for central obesity due to sedentary lifestyles and high-calorie diets (Sharma et al., 2019).
The findings highlight the dual burden of malnutrition, with both underweight and overweight trends. Rural areas face undernutrition due to poor dietary intake and limited resources, while urban areas experience rising obesity linked to sedentary behaviors and energy-dense diets (Khadilkar et al., 2021; Narain et al., 2016). Interventions are needed in both settings: rural areas require improved access to nutritious food, while urban areas need initiatives promoting physical activity and reducing processed food consumption (Singh et al., 2018; Gupta et al., 2019; WHO, 2020).
### f) Correlation Coefficient
This study found significant correlations between dietary intake, food patterns, and anthropometric indices in adolescents. Protein intake showed a negative correlation $(r = -0.153$, $p < 0.01)$, highlighting its role in satiety and lean mass maintenance (Smith et al., 2020), while fat $(r = 0.127)$ and carbohydrates $(r = 0.129)$ were positively correlated with weight gain (Johnson & Smith, 2019). Fiber $(r = -0.119)$ and magnesium $(r = -0.159)$ had protective effects against weight gain, supporting their role in digestion and metabolism (Li et al., 2021; Kumar et al., 2018).
Vegetable consumption was negatively correlated with anthropometric indices $(r = -0.176)$, emphasizing its benefits for diet quality (Li et al., 2021), while refined cereals showed a positive correlation $(r = 0.104)$, suggesting over-reliance on low-fiber grains (Chatterjee et al., 2020). Fruits and pulses showed no significant correlations, likely due to inconsistent intake.
Fast-food consumption, especially chocolates (r = 0.182), ice creams (r = 0.32), and chips (r = 0.217), was strongly associated with higher weight measures due to high sugar and fat content (WHO, 2021). Moderate correlations were also noted for items like French fries and burgers, reinforcing global concerns about fast food's role in adolescent obesity (Brown et al., 2022). These results call for targeted nutrition education and policy-level action.
Generating HTML Viewer...
References
59 Cites in Article
(2025). Unknown Title.
Margaret Ashwell,Shiun Hsieh (2005). Six reasons why the waist-to-height ratio is a rapid and effective global indicator for health risks of obesity and how its use could simplify the international public health message on obesity.
M Bhargava,A Bhargava,S Ghate,R S P Rao (2020). Nutritional status of Indian adolescents (15-19 years) from National Family Health Surveys 3 and 4: Revised estimates using WHO 2007 Growth reference.
S Bhattacharya,A Srivastava,R Mohan (2020). Undernutrition and the dual burden of malnutrition in India.
C Bornhorst,T Wijnhoven,M Kunesova,A Yngve,A Rito,L Lissner,V Duleva,A Petrauskiene,J Breda (2015). WHO European Childhood Obesity Surveillance Initiative: associations between sleep duration, screen time and food consumption frequencies.
Patrali Chatterjee (2011). Drivers of new product recommending and referral behaviour on social network sites.
R Chatterjee,A Gupta,P Singh (2020). Refined grains and their impact on adolescent nutrition.
M Chaudhary,P Verma,K Singh (2017). Influence of family structure on eating behaviors among adolescents: A rural-urban comparison.
S Choudhary,C Mishra,K P Shukla (2010). Dietary pattern and nutrition related knowledge of rural adolescent girls.
A Coates,C Hardman,J Halford,G Christiansen,P Boyland,E J (2019). Social media influencer marketing and children's food intake: a randomized trial.
Anna Coates,Charlotte Hardman,Jason Halford,Paul Christiansen,Emma Boyland (2019). The effect of influencer marketing of food and a “protective” advertising disclosure on children's food intake.
Jai Das,Rehana Salam,Kent Thornburg,Andrew Prentice,Susan Campisi,Zohra Lassi,Berthold Koletzko,Zulfiqar Bhutta (2017). Nutrition in adolescents: physiology, metabolism, and nutritional needs.
Marijke De Veirman,Veroline Cauberghe,Liselot Hudders (2017). Marketing through Instagram influencers: the impact of number of followers and product divergence on brand attitude.
S Dunlop,Freeman Jones,S C (2016). Marketing to youth in the digital age: The promotion of unhealthy products and health promotion efforts on social media.
Karen Freberg,Kristin Graham,Karen Mcgaughey,Laura Freberg (2011). Who are the social media influencers? A study of public perceptions of personality.
(2019). Economic Survey of India 2019.
J Gross,F V Wangenheim (2018). Thema der nächsten Ausgabe: Big Data - Chancen und Gefahren.
C Holmberg,J Chaplin,T Hillman,C Berg (2019). Adolescents' presentation of food in social media: An explorative study.
G Balaji,S Sinha,M Surekha,V Kasturi,S Mungamuri,P Shashikala (2017). Correlation studies on pathological changes in brain with neurotransmitters and behavioural changes in Balb/c mice.
D Jelliffe (1966). an Assessment of the Nutritional Status of the Community.
Johnson Smith,T (2019). Dietary fats and carbohydrates: Friend or foe?.
A Kaplan,M Haenlein (2010). Users of the world, unite! The challenges and opportunities of Social Media.
Shekhar Swaroop,Paras Singla,Upendra Baitha,Gaurav Gupta,Amandeep Singh (2017). Extensive Deep Vein Thrombosis: A Rare Manifestation of Disseminated Tuberculosis.
V Khadilkar,S Yadav,K Agrawal,S Tamboli,N Patil (2021). Prevalence of malnutrition among Indian adolescents: National Family Health Survey findings.
A Kumar,K Sharma,P Verma (2018). Micronutrients in adolescent health.
P Kumar,S Kaur (2020). Religious beliefs and dietary patterns in adolescents.
L Lipsky,R J Iannotti (2012). Associations of television viewing with eating behaviors in the 2009 health behaviour in school-aged children study.
Lauren Lissner,Anne Lanfer,Wencke Gwozdz,Steingerdur Olafsdottir,Gabriele Eiben,Luis Moreno,Alba Santaliestra-Pasías,Éva Kovács,Gianvincenzo Barba,Helle-Mai Loit,Yiannis Kourides,Valeria Pala,Hermann Pohlabeln,Stefaan De Henauw,Kirsten Buchecker,Wolfgang Ahrens,Lucia Reisch (2012). Television habits in relation to overweight, diet and taste preferences in European children: the IDEFICS study.
A Malik,J Singh,R Narang (2020). Trends in processed food consumption among urban adolescents in India.
W Mangold,David Faulds (2009). Social media: The new hybrid element of the promotion mix.
R Narain,P Mathur (2018). Obesity and dietary patterns in urban Indian adolescents.
A Narayan,M Gupta,R Sharma (2021). Impact of family dynamics on adolescent autonomy in food choices.
D Nithya,R V Bhavani (2018). DIETARY DIVERSITY AND ITS RELATIONSHIP WITH NUTRITIONAL STATUS AMONG ADOLESCENTS AND ADULTS IN RURAL INDIA.
E Ortiz-Ospina (2019). The rise of social media.
R B Patel,R Joshi,P Mehta (2020). Hypertension in adolescents: A growing concern in rural India.
S Patel,R Shah,A Desai (2019). Hydration and cognitive performance in adolescents: The Indian perspective.
George Patton,Susan Sawyer,John Santelli,David Ross,Rima Afifi,Nicholas Allen,Monika Arora,Peter Azzopardi,Wendy Baldwin,Christopher Bonell,Ritsuko Kakuma,Elissa Kennedy,Jaqueline Mahon,Terry Mcgovern,Ali Mokdad,Vikram Patel,Suzanne Petroni,Nicola Reavley,Kikelomo Taiwo,Jane Waldfogel,Dakshitha Wickremarathne,Carmen Barroso,Zulfiqar Bhutta,Adesegun Fatusi,Amitabh Mattoo,Judith Diers,Jing Fang,Jane Ferguson,Frederick Ssewamala,Russell Viner (2016). Our future: a Lancet commission on adolescent health and wellbeing.
B Popkin (2020). Global trends in obesity.
Yara Qutteina,Lotte Hallez,Maxime Raedschelders,Charlotte De Backer,Tim Smits (2021). Food for teens: how social media is associated with adolescent eating outcomes.
Rani,Rani (2016). Assessment of nutritional status of school going adolescents in Fatehabad district of Haryana research article.
S Reddy,V Kumar (2020). Under-nutrition in rural adolescents: Challenges and interventions.
Reid Chassiakos,Y Radesky,J Christakis,D Moreno,M A Cross,C Hill,D Ameenuddin,N Hutchinson,J Levine,A Boyd,R Mendelson,R (2016). Children and adolescents and digital media.
T N Robinson,J Banda,L Hale,A S Lu,Fleming Milici,F Calvert,S Wartella,E (2017). Screen media exposure and obesity in children and adolescents.
A Sharma,M Bansal,P Singh (2019). Access to healthcare among rural and urban adolescents in India.
M Tatlow-Golden,E Hennessy,Dean Hollywood,L (2017). Young children's food brand knowledge.
(2016). Data sources - The background papers.
Xia Wang,Chunling Yu,Yujie Wei (2012). Social Media Peer Communication and Impacts on Purchase Intentions: A Consumer Socialization Framework.
Yuxi Wang,Martin Mckee,Aleksandra Torbica,David Stuckler (2020). Systematic Literature Review on the Spread of Health-related Misinformation on Social Media.
Rabbanietariq Wani (2019). Socioeconomic status scales-modified Kuppuswamy and Udai Pareekh's scale updated for 2019.
Who (2004). Expert Consultation. Appropriate bodymass index for Asian populations and its implycations for policy and intervention strategies.
Who (2008). Action plan for the global strategy for the prevention and control of noncommunicable diseases, 2008-2013.
(2016). 1.N. Workshop: Regulating Digital Marketing to Children to Prevent Chronic Diseases and Promote Children’s Rights.
(2001). Candau, Marcolino Gomes, (30 May 1911–25 Jan. 1983), Director-General Emeritus, World Health Organization, Geneva, since 1973.
Who (2021). Increasing fruit and vegetable consumption to reduce the risk of noncommunicable diseases.
(2020). Global strategy on diet, physical activity, and health.
Hidde Van Der Ploeg,Fiona Bull (2020). Invest in physical activity to protect and promote health: the 2020 WHO guidelines on physical activity and sedentary behaviour.
Nhu Tran Minh,Qudsia Huda,Humayun Asghar,Dalia Samhouri,Abdinasir Abubakar,Caroline Barwa,Irshad Shaikh,Evans Buliva,Peter Mala,Mamunur Malik (2021). Zika virus: no cases in the Eastern Mediterranean Region but concerns remain.
No ethics committee approval was required for this article type.
Data Availability
Not applicable for this article.
How to Cite This Article
Dr. Simran Kaushal. 2026. \u201cVirtual Influences, Real Consequences: Social Media’s Role in Food Preferences and Nutrition Among Punjab’s Adolescent Girls\u201d. Global Journal of Computer Science and Technology - G: Interdisciplinary GJMBR-G Volume 25 (GJMBR Volume 25 Issue G1).
Explore published articles in an immersive Augmented Reality environment. Our platform converts research papers into interactive 3D books, allowing readers to view and interact with content using AR and VR compatible devices.
Your published article is automatically converted into a realistic 3D book. Flip through pages and read research papers in a more engaging and interactive format.
Our website is actively being updated, and changes may occur frequently. Please clear your browser cache if needed. For feedback or error reporting, please email [email protected]
Thank you for connecting with us. We will respond to you shortly.