Near-infrared spectroscopy is considered the most promising method for measuring blood glucose levels without drawing blood. However, this method alone does not allow the proportion of absorbed light attributable to glucose to be isolated. This paper proposes an improved spectroscopic method with software wavelength tuning that solves this problem.
## I. INTRODUCTION
Currently, the most promising non-invasive methods for determining blood glucose levels are considered to be optical methods based on near-infrared spectroscopy. They allow obtaining certain information about the content of various impurities in the blood, including glucose. Research in this area is quite extensive, and considerable research experience has already been accumulated [1, 2]. The main circumstance that makes it difficult to obtain objective data when implementing the spectroscopic method is that the wavelength band of light absorbed by glucose significantly overlaps with the absorption band characteristic of water and other substances contained in human skin and tissues. As a result, it is difficult to determine the proportion of light absorbed by glucose. This problem can be solved by repeated photometry at many randomly selected points in the spectrum, within which the absorption of light by glucose and other absorbing components overlaps.
An important factor is that the spectral characteristics of all absorbing agents (glucose, water, melanin, and other substances contained in blood and tissues) are generally well known. In some cases, spectral absorption curves require refinement, so when developing a glucometer based on the measurement of absorbed light, it is necessary to perform preliminary calibration measurements of the spectral characteristics of the absorption of certain absorbing components [3].
## II. DESCRIPTION OF THE METHOD
Let us consider light absorption in a human blood-containing organ. The Bouguer-Lambert-Beer law formula is used to describe light absorption.
$$
I (l) = I _ {0} e ^ {- k _ {\lambda} l}, \tag {1}
$$
where $I(I)$ is the intensity of light passing through a layer of material with a thickness of $I$, $I_0$ is the intensity of light at the entrance to the material, and $k_{\lambda}$ is the absorption coefficient of the material.
However, light is absorbed by many substances as it passes through the blood-containing organs of the human body, so it is advisable to consider the following modified formula
$$
I _ {0} = I e ^ {k _ {m} n _ {m} + k _ {p} n _ {p} + \dots + k _ {z} n _ {z}}, \tag {2}
$$
where $k_{m}$ is the absorption coefficient of component m at $i$ -th wavelength in the layer (dimensionless quantity); $n_{m}$ is the concentration of component m distributed over the layer thickness $I_{\mathrm{v}}$. It is assumed that the layer thickness is known and constant.
After some transformations, we obtain a linear equation of the form
$$
k _ {m} n _ {m} + k _ {p} n _ {p} + \dots + k _ {z} n _ {z} = \ln \frac {I _ {0}}{I}. \tag {3}
$$
If measurements are taken at $N$ wavelengths within the spectral range of the device, then for each measurement, an equation with $N$ unknowns can be written. As a result, we can obtain a system of $N$ linear equations with $N$ unknowns, which can be solved using software. One of the solutions to this system of equations will be the concentration of glucose in the blood. An approximate form of this system of linear equations is shown below:
$$
\left\{
\begin{array}{l}
k_{1 m} n_{m} + k_{1 p} n_{p} + \dots + k_{1 z} n_{z} = \ln \frac{I_{1 0}}{I_{1}} \\
k_{2 m} n_{m} + k_{2 p} n_{p} + \dots + k_{2 z} n_{z} = \ln \frac{I_{2 0}}{I_{2}} \\
\vdots \\
k_{a m} n_{m} + k_{a p} n_{p} + \dots + k_{a z} n_{z} = \ln \frac{I_{a 0}}{I_{a}}
\end{array}
\right.
\tag{4}
$$
This system can be solved by applying the Gauss method with sequential elimination of unknown variables. This solution can be obtained using standard software.
## III. FEATURES OF THE INSTRUMENTAL IMPLEMENTATION OF THE METHOD
The most important condition for the instrumental implementation of the method under consideration is the use of a polychromatic light source with a programmatically variable wavelength [4]. The trend toward increasing the performance of biomedical spectrophotometers, including those used to determine blood glucose levels, necessitates the development of light sources that would allow single analyses to be performed in tens to hundreds of microseconds. Obviously, the transition from one wavelength of light to another can only be achieved by software. The required speed of switching the device from one wavelength of light to another can only be achieved if LEDs are used as the physical light source. At the same time, since the radiation band of LEDs is quite narrow (on average 30 nm), a set of LEDs is required whose spectral characteristics would completely cover the entire required wavelength range. The optimal design of a light source with a controllable spectrum for spectrophotometers involves the special localization of LEDs inside the common housing of the light-emitting unit [4].
One of the schemes in accordance with patent [4] is the light source shown in Figure 1. Such a source consists of a computer-controlled power supply unit that supplies current to the LEDs in accordance with signals received from the computer. This makes it possible to control the intensity and spectral composition of the radiation due to the ability to turn on the LEDs in any sequence, change the current supplied to any of the LEDs, and turn on several arbitrary LEDs with a given intensity.
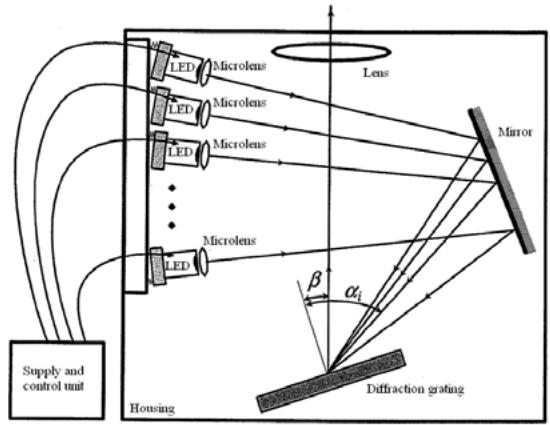 Fig. 1: Configuration of optical elements of a polychromatic light source with software control
The micro-optical assembly allows the radiation from each of the LEDs to be focused onto a mirror, which reflects this radiation onto a diffraction grating. The mirror serves to reduce the size of the device. The radiation from each of the LEDs, reflected from the mirror, hits the diffraction grating in such a way that the following condition is satisfied for each of the rays.
$$
d (\sin \alpha + \sin \beta) = m \lambda , \tag {5}
$$
where $d$ is the period of the diffraction element, $\alpha$ is the angle between the normal to the diffraction grating and the direction of propagation of radiation from the light-emitting element, $\lambda$ is the wavelength of radiation, $\beta$ is the diffraction angle measured relative to the normal to the diffraction element, $m$ is an integer that characterizes the diffraction order.
Thus, at the output of the described device, a beam propagates along a single optical axis, combining the radiation of a set of LEDs with different wavelengths of light.
Light from a polychromatic source is collected in an optical fiber and directed to a blood-containing organ, which in this case is the patient's earlobe. To introduce light into the earlobe and record unabsorbed light, a clip design was developed, which is shown in Figure 2. The input beam of probing light is delivered through the optical fiber, and the unabsorbed light that has passed through the earlobe hits the receiving part of the clip, where the photodiode is located. The signal from the photodiode is sent to a portable computer for software processing.
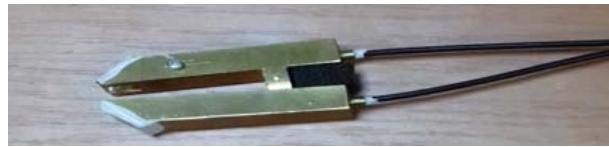 Fig. 2: A clip through which a probing beam of light with an adjustable wavelength passes
## IV. THE INFLUENCE OF THE FINAL BANDWIDTH OF THE LIGHT SOURCE RADIATION BEAM ON THE CONVERGENCE OF THE SOLUTION IN CALCULATIONS
Regardless of how the radiation bandwidth is limited during measurements, this bandwidth is finite and can be approximated by a Gaussian curve with a maximum at the point corresponding to the wavelength of interest. Thus, in general, the spectral absorption curve of both individual components and the entire part of the human body through which the radiation passes is a mathematical convolution of the true spectral absorption curve and the aforementioned approximating Gaussian curve. That is
$$
S_{M} (\lambda) = S_{a} (\lambda) \otimes \mathrm{e}^{-(\lambda - \lambda_{o})^{2} / \sigma^{2}} ,
$$
where $S_{M}(l)$ is the measured spectral absorption curve, $S_{a}$ is the true spectral absorption curve, $l_{0}$ is the wavelength of radiation at the point of maximum transmission bandwidth, and $s$ is the transmission bandwidth. From this, it can be seen that the smaller the radiation passband width, the closer it is to the $d$ -function and the closer the measured spectral absorption curve is to the true one.
Expression (6) is valid for the case when a single-element photodetector (such as a standard photodiode) is used, and a switchable set of physical light sources is used as the emitter, in which the central wavelengths of radiation are specified and the transmission bands have a Gaussian shape. However, if we use the circuit used in most modern spectrophotometers, then a physical light source with a wide spectrum is most often used, but with the help of a spectrally selective element, for example, diffraction grating, to spatially separate radiation with different wavelengths and direct this radiation to a multi-element photodetector, such as a CCD array. In this situation, the signal recorded by a single photosensitive element of the CCD array is described by the integral of all spectral components falling on the area of a given pixel. In this case, we can take as a useful signal that which is described by formula (6), assuming that $I_0$ is the wavelength corresponding to the center of a given pixel. In addition, signals corresponding to the "tails" of the Gaussian distribution from colors corresponding to neighboring pixels fall on this pixel. Thus, the intensity function of light falling on all elements of the CCD array can be described by the following expression:
$$
S _ {M} (\lambda) = \sum_ {z = 1} ^ {n} S _ {a} (\lambda) * e ^ {\frac {- (\lambda - \lambda_ {z}) ^ {2}}{\sigma^ {2}}} - \sum_ {k = 1} ^ {n - 1} S _ {\mathrm {n a p} k}, \quad (7)
$$
where $z$ is the pixel serial number, and $S_{\text{park}}$ is the parasitic radiation intensity falling on this pixel from the signal intended for the $k$ -th pixel. This value $S_{\text{park}}$ can be described by analogy with expression (6)
$$
S_{\text{park}}(\lambda) = S_{ak} \left[ \lambda - (z - k) \delta\lambda \right] \otimes e^{- \left(\lambda - \lambda_{k}\right)^{2} / \sigma^{2}}.
$$
Here, $S_{ak}$ is the light intensity corresponding to the true spectral absorption curve for the $k$ -th pixel of the line. Expressions (7) and (8) fully describe the distribution of radiation intensity falling on the plane of a multi-element photodetector—a CCD array.
## V. CONVERSION OF CALCULATED DATA INTO BLOOD GLUCOSE CONCENTRATION
As a result of calculations in accordance with this mathematical model, we obtain the value of the conditional glucose concentration ng, but with a large number of components. At the same time, the output of the model must indicate the blood glucose concentration expressed in mmol/L. There are two possible approaches to converting the conditional concentration into a concentration expressed in mmol/L.
Approach 1 - calculated. To implement it, the following steps should be taken:
A) Determine the approximate proportion of the absorbing volume occupied by blood (e.g., blood filling the earlobe). The statistical average value of this proportion can be determined from the literature. Let us denote this value as $d$ (a dimensionless quantity, significantly less than one). B) Determine the glucose concentration in mmol/L. Here, we must assume that the density of the glucose solution is always within the range of 1-1.1 g/mL in real cases. Then, the glucose concentration in mmol/L can be calculated as
$$
C = 1 0 ^ {6} \frac {n _ {g}}{\delta M _ {s}}
$$
where $M_{s}$ is the molar mass of glucose $(180\mathrm{g / mol})$. The coefficient $10^{6}$ includes the conversion of moles to millimoles, as well as milliliters to liters.
Approach 2 - calibration. This involves obtaining the calibration value $n_{gc}$ in accordance with this mathematical model during the first test of the module, as well as determining the calibration glucose concentration $C_c$ in the same patient at the same time using an invasive method. The ratio $C_c / n_{gc}$ is calculated and entered into the program for displaying the glucose concentration on the interface. Then, after each calculation of $n_{gc}$, the glucose concentration measured in mmol/L is displayed on the interface:
$$
C = n _ {g} \frac {C _ {c}}{n _ {g c}}
$$
The choice between these two approaches can only be made after conducting comprehensive experiments with the finished device.
## VI. CONCLUSION
The device and principle of determining blood glucose content described above make it possible to implement a non-invasive method of glucometry, but there is still no clear answer to the question of measurement accuracy. The main problem lies in ensuring the convergence of the solution of a system of $N$ linear equations with $N$ unknowns. This can be achieved by taking special measures to increase the signal-to-noise ratio during measurements. Another method is to select wavelengths for measurements so that some of the absorbing components at these wavelengths have zero absorption, which will simplify the system and increase the probability of convergence of the solution. It should be noted that the program that controls the operation of the device and calculates the proportion of light absorbed by glucose must be corrected to take into account the absorption by melanin and the epidermis, with appropriate adjustments for each individual patient. Thus, the method will allow the development of an inexpensive indicator device for individual use, allowing the detection of moments of exacerbation of the disease when it is necessary to seek medical help.
The present work was supported by Education and Science Ministry of Russian Federation, State task No. 075-00761-22-00, project No. FZZM-2025-0011.
Generating HTML Viewer...
References
4 Cites in Article
N Bazaev,Yu. Masloboev,S Selishchev (2012). Optical Methods for Noninvasive Blood Glucose Monitoring.
O Khalil (2004). Non-invasive glucose measurements at the dawn of the new millennium: an update// O. S. Khalil.
Sabbir Liakat,Kevin Bors,Laura Xu,Callie Woods,Jessica Doyle,Claire Gmachl (2014). Noninvasive in vivo glucose sensing on human subjects using mid-infrared light.
B Gurevich,I Kolesov,S Andreyev (2013). Polychromic light source with controlled spectrum.
No ethics committee approval was required for this article type.
Data Availability
Not applicable for this article.
How to Cite This Article
Dr. Boris s. Gurevich. 2026. \u201cNon-invasive spectrometric method for determining glucose concentration in human blood\u201d. Global Journal of Medical Research - D: Radiology, Diagnostic GJMR-D Volume 25 (GJMR Volume 25 Issue D1).
Explore published articles in an immersive Augmented Reality environment. Our platform converts research papers into interactive 3D books, allowing readers to view and interact with content using AR and VR compatible devices.
Your published article is automatically converted into a realistic 3D book. Flip through pages and read research papers in a more engaging and interactive format.
Our website is actively being updated, and changes may occur frequently. Please clear your browser cache if needed. For feedback or error reporting, please email [email protected]
Thank you for connecting with us. We will respond to you shortly.