Since the first industrial revolution, the leading role of emerging technologies has been highlighted in modernizing the industry and developing the workforce. This study explores the impact of Industry 4.0 digital technologies on manufacturing competitiveness, focusing on Finnish SMEs within the EU with a sample (n = 123). It utilizes extensive 2022 European Manufacturing Survey (EMS22) data. Advanced statistical techniques reveal complex connections between automation, competitive edge on services, and innovation models, among other factors. Robust statistical methods, including component and reliability analyses, reinforced the findings. The conclusion offers critical insights and identifies areas for further research in combining innovative manufacturing practices with technology education.
## I. INTRODUCTION
This study's central motive is to quantitatively assess the impact of Industry 4.0 digital technologies on manufacturing competitiveness, specifically within the context of European Union Finnish small and medium-sized enterprises (SMEs). The alignment within the EU's strategic priorities is to modernize industry. Preparing the workforce in education and training means examining how technologies like automation and robotics applications can be integrated and leveraged. By utilizing the European Manufacturing Survey 2022 (EMS22) dataset tailored to the Finnish manufacturing sectors, the study aims to gain granular insights into SMEs' adoption and use of the manufacturer's key enabling technologies. The quantitative analysis of survey data provides data-driven perspectives to inform decision-making for Industry 4.0 integration.
The manufacturing industry has undergone significant transitions over centuries, from the advent of steam power and assembly lines in the 1750s (Industry 1.0) to the rise of global supply chains and localized production goals (Industry 2.0), and then progressive automation and digitalization since the 1960s (Industry 3.0). These advances have been driven by innovation and connectivity needs (Heilala, 2022). Today's environment demands extreme customization and efficiency. This motivates embracing technologies like automation and robotics, moving towards Industry 4.0. Such technologies are critical for European Union (EU) small and medium-sized enterprises (SMEs) to bolster competitiveness. The EU aims to strategically modernize industry and develop workforces for the future (Heilala, 2022).
This research utilizes the EMS, which has tracked Europe's industrial progression for two decades, offering a rich dataset. The EMS is an extensive survey conducted across European countries that collects key information on manufacturing strategies, technologies, and practices. It provides valuable insights into the state of the industry and how it is evolving amidst digital transformation and Industry 4.0 trends. The EMS adopts a broad perspective on manufacturing evolution, complementing the innovation-focused Community Innovation Survey (CIS) grounded in the OSLO framework (Consortium for the European Manufacturing Survey 2020; Dachs & Zanker, 2015; European Commission et al., 2015). The refined EMS22 survey shows, by each question, The quantified variables of a representative sample of 123 small firms. As per leveraging EMS data, the impact of digital transformation on competitiveness is analyzed. The analysis applies exploratory factor analysis, structural equation modeling, and logistic regression to evaluate variable relationships on testing proposed hypotheses to form the logistic regression model. Key results reveal complex interdependencies between innovation models, technologies, services, and performance. The discussion interprets these insights, outlining empirical connections found and limitations encountered. The statistically driven findings contribute to the discourse on digital competitive advantage, providing a modeling foundation for ongoing research into optimizing smart manufacturing implementation.
## II. LITERATURE REVIEW - DECADELONG PERSPECTIVE
### a) Analytical Review of Manufacturing Research Trends
Prior EMS-based studies have utilized diverse statistical methods to analyze the survey data. The scoping review includes component analysis, reliability analysis through alpha, rho, and omega, and exploratory and confirmatory analyses. Structural path analysis shows multivariate analysis for discriminant and convergent validity assessments to implement in response to information characterization. Prior studies have shown depth in trade (European Commission, 2016; Kinkel et al., 2015). The lookup followed the format 'TITLE-ABS-KEY ("manufacturing" AND "statistic method")' to identify publications similar in the metadata. Results were filtered by year (2013-2023) for trends in
Figure 1. The usage of each component's method used in manufacturing literature (2013-2023) needed to be more extensive. The internal structures' lower reliability frequency and the current research gap were identified.
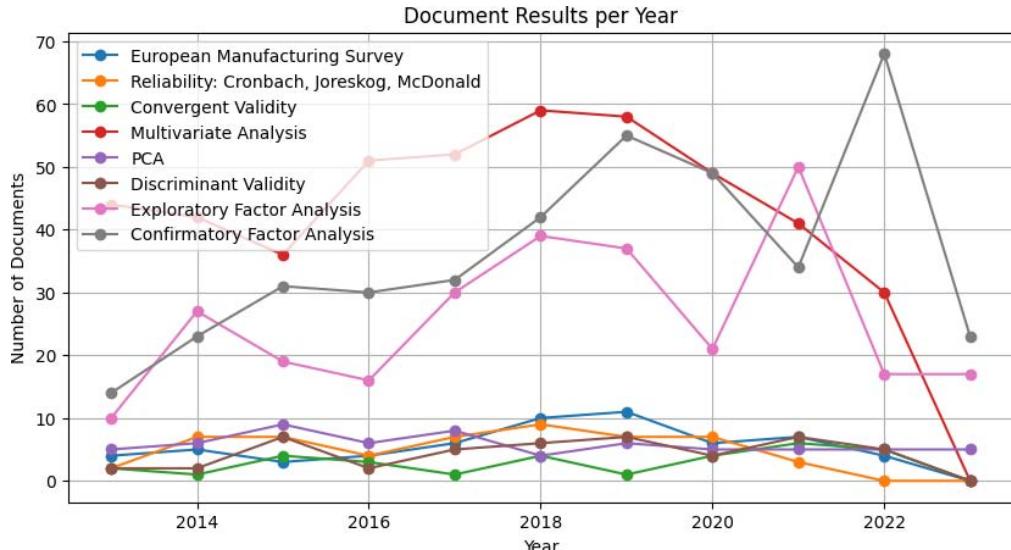 Figure 1: Trends for the Statistical Methods used in Manufacturing Method Studies (2013-2023) (Scopus 2023)
While the analysis criteria development established the management domain, the gap in examined publication trends is shown. The scope highlights increased utilization of exploratory and confirmatory factor analysis while other areas decline. The current study is aligned with the use of pre-defined variables from key themes from the EMS 2022 survey to fill the gap. The analysis incorporates a meta-level surfacing the variables from the EMS2022 survey across categories, including competitiveness and employment metrics, supply chain contracts, human resources distribution, training initiatives, business innovation models, implementation of digital services, adoption of digital elements, provision of product-related services, cybersecurity practices, utilization of key enabling technologies, organization concepts, and prevalence of relocation activities abroad (Table 1).
Table 1: The study's classification development baseline adapts to EMS22 statements, testing if the practice is used for the context frameworks (EMS, 2022). The questions on the development of competitiveness and employment (DCES) are measuring manufacturing digitalization, acronymized as European manufacturing survey's (EMS's) key enabling technologies (KETs); organizational concepts (OCs) for relocation activities (RAs); digital services (DSs); cybersecurity practices (CPs) from the supply chain contract (SCCs) and resources (HR) perspectives. This shows that each of the factors explained is emerging in the experimental factor analysis addressed sample.
<table><tr><td>Category</td><td>Variables</td></tr><tr><td>Competitiveness and Employment</td><td>Annual turnover, number of employees, manufacturing capacity utilization, return on sales, investments in equipment and machinery, annual payroll as percentage of turnover, year of establishment.</td></tr><tr><td>Supply Chain Contracts</td><td>Manufacturers, suppliers, contract manufacturers.</td></tr><tr><td>Human Resources Distribution</td><td>University/college graduates, technically skilled workforce, trained workforce, semi-skilled and unskilled workers, trainees each segment indicating that practical skills and in-house training are highly valued in the workforce.</td></tr><tr><td>Training Initiatives</td><td>Task-specific training, cross-functional training, support in digital implementation, data security and compliance training, creativity, and innovation training.</td></tr><tr><td>Business Innovation Models</td><td>Distribution, access, maintenance service-based, high-performance computing, on-demand, sharing, performance, and turnkey innovative economies.</td></tr><tr><td>Digital Services Implementation</td><td>Customer contact platforms, digital standard solutions, automated customer interactions, remote access control elements, cloud and IoT solutions, big data analysis.</td></tr><tr><td>Digital Elements Adoption</td><td>Identification tags, sensor technology, interactive interfaces, real-time network connection, digital transformation technologies.</td></tr><tr><td>Product-Related Services Provision</td><td>Installation and start-up, maintenance and repair, training, remote support, design and project planning, prototype development, revamping and modernization, take-back services, software development.</td></tr><tr><td>Cybersecurity Practices</td><td>Data security awareness, software solutions, hardware solutions, organizational measures.</td></tr><tr><td>Key Enabling Technologies Utilization</td><td>Production control, automation and robotics, efficiency technologies, simulation, data analysis, additive manufacturing.</td></tr><tr><td>Organization Concepts</td><td>Organization of production, management, and control, such as lean management, quality circles, and continuous improvement processes highlight the significance of organizational culture and structure in driving performance and adaptability.</td></tr></table>
Sustainable manufacturing is the creative process of synergizing the supply chain components. The enhanced competitiveness is a sign of good manufacturing for maintaining operations. It is reflected in key EMS variables related to innovation. Innovativeness requires automating human capital development for efficiency (Chia-Yen & Andrew, 2015; Mehta et al., 2010). Aligning with Europe's 2020 strategy goals, the Scopus review has limitations to the latest EMS data. Studying and assessing relationships between digital transformation, competitiveness, and employment within Finnish manufacturing is a top priority (European Commission, 2014).
### b) Research Hypothesizes
The review preliminaries show eight hypotheses developed to align with the analysis methods subsequently presented in the literature. The hypotheses show predictive relationships between EMS22 survey variables and manufacturing competitiveness and employment status for managing new natural law for technologist implications. The analysis tests hypotheses on the influence of EMS variables related to competitiveness and employment metrics (integer/binary), which are:
- H1. Business innovation model variables
- H2. Digital service implementation variables,
- H3. Digital element adoption variables,
- H4. Product-related service provision variables,
- H5. Cybersecurity practice variables,
- H6. Key enabling technology utilization variables,
- H7. Organization concept variables, and
- H8. Relocation activity variables, that
Have an explicit connection to Finnish manufacturers' competitiveness and employment. Anonymization was applied to model the small enterprises on the modeling path for a general overview. Competitiveness and employment status show the sample balanced challengingly with various sectors. The general model of the multivariate analyses between variables is usable for remote measurement of the firm floor-level relationships when fitted with normalized scores. The hypotheses assume the specific hypotheses of connections explore the exploratory model and the bottom-level quotes to converge for discussion. Thus, the literature review of analysis methods considers exploratory factor analysis to assess the underlying factor structure. The measurement models against the survey data follow the factor structure evaluation. Structural path visioning shows the Tested hypothesized relationships advantaged to classify the sample. Reliability analysis for discriminant and convergent validity assessments validates the construct's internal validity. This EMS data derives the measure to manage small chains by a quantitative approach aligned with analyzed studies.
## III. MULTI-ANALYTIC RESEARCH METHODOLOGY
Over time, the manufacturing studies trends from Scopus show applications to analyze manufacturing survey data. Findings of analyses type sorted (e.g., Kinkel et al., 2015; European Commission, 2016). A requirement to utilize factor analysis with structural path analysis is to establish an augmentation to explore relationships between variables from the latest EMS data. As such, explorative factor analysis is applied to assess the underlying factor structure with linear regression. The confirmatory on-path evaluation shows the measurement models on the survey data to the lagged binary correspondence. This was adapted to logistic regression with industry responses, reporting reliability to the causal treatment domain, see, e.g. (Wang et al., 2020; Gomila, 2021). For the detailed analysis, with the depth of linear analyses, utilizing logistic regression helped deal with binary data for drawing dedicated results. The grounding is considering traditional model fit indices for likelihoods. The accuracy on the analysis-dependent level is usually based on statistical principles (Hilbe, 2009; Casella & Berger, 2002; Hosmer Jr. et al., 2013). The approach offers coefficient interpretation in terms of associations between the variables studied. The regression path shows the hypothesized relationships influencing manufacturing competitiveness and employment component space. Reliability analysis shows internal consistency (Taber, 2016). discriminant and convergent validity validated in further models of measurement (Anderson & Gerbing, 1988).
## IV. DATA-ANALYSIS
A sample $(n = 123)$ encompassed diverse industrial classifications to capture a breadth of product types and business models as classified (Heilala & Krolas, 2023). The data was acquired through Webropol's natural language collection tool and underwent cleaning to remove irrelevant responses (Webropol, 2022). The refined dataset was coded for frequency, reliability, and component analyses. Reliability analysis of the EMS2022 constructs was used to reveal internal consistency values. For reliable data, a partial technique across Industry 4.0 sectors established interpretable results (Bozgulova & Adambekova, 2023; Juariyah et al., 2020). Utilizing over 50 sub-items from the EMS22 survey represents a framework. Analysis of growth strategies in manufacturing, focusing on technologies, practices, and their impact on competition and employment industry-wide.
This spectrum of the manufacturing sector shows' manufacturing of metal products and 'Manufacturing of machinery and equipment,' and the software sector is most prominent. Industry sectors held a more miniature representation on each side for diversity and possibilities (Heilala & Krolas, 2023). The manufacturing industry studies have not been interested in industry-wide participatory studies (EMS, 2022; European Commission et al., 2015). Participation is included in the varied scope of industrial manufacturing, from factory assemblies to comprehensive lifecycle process assessments. Studies have usually served customers with platform requirements, such as within construction industry (He et al., 2018).
### a) Convergent and Congeneric Reliability Levels
Component analysis was used for dimensionality reduction to measure the reliability of constructs. The Cronbach Alpha, Joreskog's Rho, and McDonald's omega were followed as in Table 2 (Taber, 2016). Alongside the analysis of several items (survey questions or statements used), the measures of internal consistency indicate a set of items' interrelation. A higher value suggests that the items measure the same concept.
Table 2: Construct Reliability Levels Show Higher Reliability for Constructs, Abbreviations Explained Below, Indicating Strong Internal Consistency with High Measurement Accuracy
<table><tr><td></td><td>Items</td><td>Cronbach's Alpha</td><td>Joreskog Rhô</td><td>McDonald's Omega</td><td>val.</td></tr><tr><td>DCES</td><td>4</td><td>0.900</td><td>0.803</td><td>0.867</td><td>62</td></tr><tr><td>BIMs</td><td>6(7)</td><td>0.765</td><td>0.530</td><td>0.505</td><td>59</td></tr><tr><td>DSs</td><td>6</td><td><.50</td><td><.50</td><td><.50</td><td>88</td></tr><tr><td>PRS</td><td>17</td><td>.825</td><td>0.824</td><td>.839</td><td>105</td></tr><tr><td>DEs</td><td>5</td><td>.799</td><td>0.865</td><td>.812</td><td>106</td></tr><tr><td>CPs</td><td>4</td><td><.50</td><td><.50</td><td><.50</td><td>105</td></tr><tr><td>KETs</td><td>18</td><td>0.951</td><td>0.595</td><td>0.755</td><td>123</td></tr><tr><td>OCs</td><td>11</td><td>0.803</td><td>0.889</td><td>0.659</td><td>120</td></tr><tr><td>RAs</td><td>3(4)</td><td>0.900</td><td>0.885</td><td>0.583</td><td>80</td></tr></table>
Several constructs in Table 2 exhibit poor reliability per the coefficient values below 0.5. In the stats table, DCES (developing competitiveness and employment stats) measures various aspects such as AT (annual turnover) and NE (numbers of employees) to the other factory specifics, showing high reliability in all coefficients and suggesting it is a well-measured construct. On the contrary, BIM (business innovation models) has moderate reliability, indicating the varying degree of integration that could be the first varying signal of innovation potential within firms. Surprisingly, DSs (digital services) exhibit poor reliability, raising concerns over the effectiveness of these measures in capturing companies' digital transition. PRS (product-related services) demonstrated robust reliability across all coefficients for services provided, reflecting customer relationship on maintenance services. The high-reliability scores were affirmed for DEs (digital elements). Poor reliability for CPs (cybersecurity practices) has indicated potential issues in consistently measuring how digital infrastructure is safeguarded. Despite moderate reliability, KETs (key enabling technologies) benefit the omega display because it has a broad scope of moderate reliability measures regarding a few item combinations that align with each other. Similarly, but contrary to omega, OCs (organization concepts) present reliable measures contributing to firm efficiency and agility. Uniformity to globalization, RAs (relocation activities) exhibit varied reliability across coefficients. The first signal to the empty tabulations shows Heilala and Krolas (2023), who note that the carbon footprint in offshore locations needs to be more consistently optimized by reassessing certified systems.
### b) Factor Analysis
Despite a few constructs having insufficient reliability for further analyses, another angle to considering partial exploratory factor analysis (PEFA) was taken. PEFA was an intriguing option to form over an established, validated framework of the survey metrics. The technique has been used across manufacturing and other Industry 4.0 sectors, reliably increasing safety to select the analysis method (Bozgulova & Adambekova, 2023; Juariyah et al., 2020). Factor analysis provides insights into the multivariate relationships of survey instruments (Creswell, 2015; Edmonds & Kennedy, 2019). PEFA shows the interconnections between factors influencing the instruments (Matsunaga, 2010; Revelle, 2013). Rotation methods of VariMax and ProMax optimize factor separability (Matsunaga, 2010). The PEFA is shown in the Table 3 model DCES (developing competitiveness and employment situ) measures of annual turnover for 2019-2021 (AT19/21; m23a1, m23a2), employee numbers for 2019-2021 (NE19/21; m23b1, m23b2), capacity utilization for 2019-2021 (MCU19/21; m23h), return on sales for 2019-2021 (ROS19-21; m23i1-5), investments (m23f), payroll percentage (m23g), and establishment year (m23k) reflect financials, labor dynamics, asset efficiency. High turnover and employment correlate with competitiveness. Supply chain contract (SCC) types categorize operators as manufacturers (MFR; m03a1-a3), suppliers (SPLR; m03a4-a5), or contract manufacturers (CM; m03a6), capturing production system roles. Manufacturers' negative SCC correlation potentially signals inflexibilities, unlike positively correlated suppliers and contract manufacturers benefiting from dynamic agreements. Human resources (HR) distribution classifies graduates (m16a1), technical staff (sm16a2), trained workers (m16a3), semi/unskilled personnel (m16a4), and trainees (m16a5), measuring skills and qualifications. Graduates' negative HR correlation potentially reflects oversaturation, contrasting positives for vocational abilities. Business innovation models (BIM) like leasing (BIM1; m18a1), service contracts (BIM2; m18b1), output-based services (BIM3; m18c1), sharing models (BIM4; m18d1), availability guarantees (BIM5; M18e1), and turnkeys (BIM6; m18f1) integrate variably, signaling
innovation potential. Digital services (DS) include standards solutions (m18g1), automated customer processes (m18g2), remote access controls (m18g3), cloud/loT applications (m18g4), and data analytics (m18g5), enabling digital transitions. Digital elements (DE) such as identification tags (m04a1), sensors (m04a2), interactive interfaces (m04a3), real-time connections (m04a4), and IoT integrations (m04a5) emphasize digitization's role. Product-related services (PRS) spanning installation (m15a1), maintenance (m15b1), training (m15c1), support (m15d1), consulting (m15e1), prototyping (m15f1), modernization (m15g1), takebacks (m15h1), and software (m15i1) maintain customer relationships. Cybersecurity practices (CP), including awareness (m11a1), data controls (m11a2), network solutions (m11a3), and protections (m11a4) safeguard digital infrastructure. Key enabling technologies (KET) from programming devices (m09a1) to simulation software (m09p1) drive innovation and sustainability. Organization concepts (OC) encompassing integration (m06a1), customer-focus (m06b1), pull-based control (m06c1), changeover optimization (m06d1), standardization (m06e1), visual management (m06f1), quality assurance (m06g1), innovation involvement (m06h1), performance incentives (m06i1), environmental management (m06k1), and energy management (m06l1) contribute to efficiency and agility. Relocation activities (RA), including off shoring production (m26a1) and R&D (m26b1) and back shoring production (m26c1) and R&D (m26d1) represent strategic footprint optimization. The commonalities indicate digitalization's integral role and human capital's nuance in competitiveness, demanding tailored management. This statistical portrait outlines the drivers of European manufacturing competitiveness, employment, innovation, and strategy amidst Industry 4.0 transformation. (EMS, 2022.).
Table 3: The Factor Loadings Offer a Multidimensional Perspective on the Interconnected Variables Influencing European Manufacturing as Discerned from the EMS22 Survey
<table><tr><td>EMS item</td><td>DCES</td><td>SSC</td><td>HR</td><td>BIM</td><td>DS</td><td>DE</td><td>PRS</td><td>CP</td><td>KETs</td><td>OCs</td><td>RA</td><td>COM</td></tr><tr><td>m23a1</td><td>.937</td><td></td><td></td><td></td><td></td><td></td><td></td><td></td><td></td><td></td><td></td><td>.878</td></tr><tr><td>m23b1</td><td>.915</td><td></td><td></td><td></td><td></td><td></td><td></td><td></td><td></td><td></td><td></td><td>.836</td></tr><tr><td>m23h</td><td>.389</td><td></td><td></td><td></td><td></td><td></td><td></td><td></td><td></td><td></td><td></td><td>.151</td></tr><tr><td>m23i1-5</td><td>.261</td><td></td><td></td><td></td><td></td><td></td><td></td><td></td><td></td><td></td><td></td><td>.068</td></tr><tr><td>m23a2</td><td>.932</td><td></td><td></td><td></td><td></td><td></td><td></td><td></td><td></td><td></td><td></td><td>.869</td></tr><tr><td>m23b2</td><td>.920</td><td></td><td></td><td></td><td></td><td></td><td></td><td></td><td></td><td></td><td></td><td>.846</td></tr><tr><td>m23h</td><td>.419</td><td></td><td></td><td></td><td></td><td></td><td></td><td></td><td></td><td></td><td></td><td>.175</td></tr><tr><td>m23f</td><td>.514</td><td></td><td></td><td></td><td></td><td></td><td></td><td></td><td></td><td></td><td></td><td>.264</td></tr><tr><td>m23g</td><td>-.451</td><td></td><td></td><td></td><td></td><td></td><td></td><td></td><td></td><td></td><td></td><td>.203</td></tr><tr><td>m23k</td><td>.676</td><td></td><td></td><td></td><td></td><td></td><td></td><td></td><td></td><td></td><td></td><td>.457</td></tr><tr><td>m03a1-a3</td><td></td><td></td><td>-.909</td><td></td><td></td><td></td><td></td><td></td><td></td><td></td><td></td><td>.826</td></tr><tr><td>m03a4-a5</td><td></td><td></td><td>.522</td><td></td><td></td><td></td><td></td><td></td><td></td><td></td><td></td><td>.273</td></tr><tr><td>m03a6</td><td></td><td></td><td>.564</td><td></td><td></td><td></td><td></td><td></td><td></td><td></td><td></td><td>.318</td></tr></table>
<table><tr><td>m16a1</td><td>-927</td><td>-190</td><td>-190</td><td>-190</td><td>-190</td><td>-190</td><td>-190</td><td>-190</td><td>-190</td><td>-190</td><td>-190</td><td>-190</td><td>-190</td><td>-190</td><td>-190</td><td>-190</td><td>-190</td><td>-190</td><td>-190</td><td>-190</td><td>-190</td><td>-19</td></tr><tr><td>m16a2</td><td>211</td><td>211</td><td>211</td><td>211</td><td>211</td><td>211</td><td>211</td><td>211</td><td>211</td><td>211</td><td>211</td><td>211</td><td>211</td><td>211</td><td>211</td><td>211</td><td>211</td><td>211</td><td>211</td><td>211</td><td>211</td><td>211</td></tr><tr><td>m16a3</td><td>677</td><td>677</td><td>677</td><td>677</td><td>677</td><td>677</td><td>677</td><td>677</td><td>677</td><td>677</td><td>677</td><td>677</td><td>677</td><td>677</td><td>677</td><td>677</td><td>677</td><td>677</td><td>677</td><td>677</td><td>677</td><td>677</td></tr><tr><td>m16a4</td><td>357</td><td>357</td><td>357</td><td>357</td><td>357</td><td>357</td><td>357</td><td>357</td><td>357</td><td>357</td><td>357</td><td>357</td><td>357</td><td>357</td><td>357</td><td>357</td><td>357</td><td>357</td><td>357</td><td>357</td><td>357</td><td>357</td></tr><tr><td>m16a5</td><td>.785</td><td>.785</td><td>.785</td><td>.785</td><td>.785</td><td>.785</td><td>.785</td><td>.785</td><td>.785</td><td>.785</td><td>.785</td><td>.785</td><td>.785</td><td>.785</td><td>.785</td><td>.785</td><td>.785</td><td>.785</td><td>.785</td><td>.785</td><td>.7</td><td></td></tr><tr><td>m16a6</td><td>.612</td><td>.612</td><td>.612</td><td>.612</td><td>.612</td><td>.612</td><td>.612</td><td>.612</td><td>.612</td><td>.612</td><td>.612</td><td>.612</td><td>.612</td><td>.612</td><td>.612</td><td>.612</td><td>.612</td><td>.612</td><td>.612</td><td>.612</td><td>.61</td><td></td></tr><tr><td>m16a7</td><td>.538</td><td>.538</td><td>.538</td><td>.538</td><td>.538</td><td>.538</td><td>.538</td><td>.538</td><td>.538</td><td>.538</td><td>.538</td><td>.538</td><td>.538</td><td>.538</td><td>.538</td><td>.538</td><td>.538</td><td>.538</td><td>.538</td><td>.538</td><td>.53</td><td></td></tr><tr><td>m16a8</td><td>.491</td><td>.491</td><td>.491</td><td>.491</td><td>.491</td><td>.491</td><td>.491</td><td>.491</td><td>.491</td><td>.491</td><td>.491</td><td>.491</td><td>.491</td><td>.491</td><td>.491</td><td>.491</td><td>.491</td><td>.491</td><td>.491</td><td>.491</td><td>.49</td><td></td></tr><tr><td>m16a9</td><td>.491</td><td>.491</td><td>.491</td><td>.491</td><td>.491</td><td>.491</td><td>.491</td><td>.491</td><td>.491</td><td>.491</td><td>.491</td><td>.491</td><td>.491</td><td>.491</td><td>.491</td><td>.491</td><td>.491</td><td>.491</td><td>.491</td><td>.49</td><td>.49</td><td></td></tr><tr><td>m16a10</td><td>.491</td><td>.491</td><td>.491</td><td>.491</td><td>.491</td><td>.491</td><td>.491</td><td>.491</td><td>.491</td><td>.491</td><td>.491</td><td>.491</td><td>.491</td><td>.491</td><td>.491</td><td>.491</td><td>.491</td><td>.491</td><td>.491</td><td>.49</td><td></td><td></td></tr><tr><td>m16a11</td><td>.491</td><td>.491</td><td>.491</td><td>.491</td><td>.491</td><td>.491</td><td>.491</td><td>.491</td><td>.491</td><td>.491</td><td>.491</td><td>.491</td><td>.491</td><td>.491</td><td>.491</td><td>.491</td><td>.491</td><td>.491</td><td>.491</td><td>.4</td><td></td><td></td></tr><tr><td>m16a12</td><td>.491</td><td>.491</td><td>.491</td><td>.491</td><td>.491</td><td>.491</td><td>.491</td><td>.491</td><td>.491</td><td>.491</td><td>.491</td><td>.491</td><td>.491</td><td>.491</td><td>.491</td><td>.491</td><td>.491</td><td>.491</td><td>.491</td><td>.492</td><td></td><td></td></tr><tr><td>m16a13</td><td>.491</td><td>.491</td><td>.491</td><td>.491</td><td>.491</td><td>.491</td><td>.491</td><td>.491</td><td>.491</td><td>.491</td><td>.491</td><td>.491</td><td>.491</td><td>.491</td><td>.491</td><td>.491</td><td>.491</td><td>.491</td><td>.492</td><td></td><td></td><td></td></tr><tr><td>m16a14</td><td>.491</td><td>.491</td><td>.491</td><td>.491</td><td>.491</td><td>.491</td><td>.491</td><td>.491</td><td>.491</td><td>.491</td><td>.491</td><td>.491</td><td>.491</td><td>.491</td><td>.491</td><td>.491</td><td>.491</td><td>.491</td><td>.492</td><td></td><td></td><td></td></tr></table>
m06a1.480.230 m06h1.613.375 m06i1.552.305 m06k1.555.308 m06l1.393.155 m26a1.699.488 m26b1.749.561 m26c1 -.031 m26d1.751.564 z-standardized; *Extra
<table><tr><td>m06a1</td><td>.480</td><td>.230</td></tr><tr><td>m06h1</td><td>.613</td><td>.375</td></tr><tr><td>m06i1</td><td>.552</td><td>.305</td></tr><tr><td>m06k1</td><td>.555</td><td>.308</td></tr><tr><td>m06l1</td><td>.393</td><td>.155</td></tr><tr><td>m26a1</td><td>.699</td><td>.488</td></tr><tr><td>m26b1</td><td>.749</td><td>.561</td></tr><tr><td>m26c1</td><td>-</td><td>.031</td></tr><tr><td>m26d1</td><td>.751</td><td>.564</td></tr><tr><td colspan="3">z-standardized; *Extra</td></tr></table>
Annual turnover and employee numbers (m23a1, m23a2, m23b1, m23b2) strongly correlate with the Competitiveness and Employment Status factor (DCES), underscoring their pivotal role in manufacturing prowess. Conversely, manufacturers (m03a1-a3) exhibit a negative relationship with Supply Chain Contracts (SSC), in contrast to the positive loadings for suppliers and contract manufacturers (m03a4-a6), revealing the complexities within supply chain dynamics. Human Resources (HR) are differentially impacted by the workforce composition, where graduates (m16a1) show a negative association, while technical, trained, semi-skilled, unskilled staff and trainees (m16a2-a5) present positive correlations, highlighting the multifaceted nature of human capital in this sector. The Business Innovation Models (BIM) spectrum (m18a1 to m18f1) demonstrates diverse associations, suggesting that innovation models integrate more seamlessly into the current industrial fabric. Digital Services (DS) and Elements (DE), illustrated by loadings for (m19a, m18g1 to m18g5, and m04a1 to m04a5), emphasize the growing importance of digitalization. Product-related services (PRS: m15a1 to m15h2), Cybersecurity Practices (CPs: m11a1 to m11a4), Key Enabling Technologies (KET: m09a1 to m09p1), Organization Concepts (OC: m06a1 to m06l1), and Relocation Activities (RA: m26a1 to m26d1) all display variegated correlations, indicating that specific practices, technologies, and strategies are differentially integrated and valued within the sector. Collectively, these loadings serve as a statistical map outlining how various elements contribute to the overall competitiveness, employment landscape, innovative capacity, and strategic direction of European manufacturing firms.
### c) Convergent and Discriminant Validity
However, the PEFAs Tucker-Lewis (Tucker & Lewis 1973) indicated only partial reliability, as from the reliability in Table 2 a few chapters back elaborated. For consistency, the potential removal of some variables is suggested. The limit must be raised to elaborate the unrelated contribution of interrelations of arithmetic sums of the companies' characteristics studied (Revelle, 2013)—correlation (R) analysis to Table 4 further explored relationships between variables of interest. The data normalization was applied to ensure compliance with the central limit theorem (Schober & Boer, 2018). This comprehensive analysis elaborates on variable relationships. Potential quadratic relationships were acknowledged. The quadratic or cubic terms are rare, highlighting the need for careful analysis to saturation (Robinson & Schumacker, 2009). The R shows that the internal reliability does not control the fluctuations of the company-dependent variables. There are no homogeneous groups unless market transformers are balanced in the manufacturing portfolio (Malik et al., 2023).
Table 4: R Magnitudes Average Extractions; the Factors are Z-Standardized
<table><tr><td></td><td>ZDCES</td><td>ZBIMs</td><td>ZDSs</td><td>ZDEs</td><td>ZPRS</td><td>ZCPs</td><td>ZKETs</td><td>ZOCs</td><td>ZRAs</td></tr><tr><td>ZDCESS</td><td>(0.25)</td><td></td><td></td><td></td><td></td><td></td><td></td><td></td><td></td></tr><tr><td>ZBIMs</td><td>-0.063</td><td>(0.297)</td><td></td><td></td><td></td><td></td><td></td><td></td><td></td></tr><tr><td>ZDSs</td><td>0.052</td><td>.324**</td><td>(0.283)</td><td></td><td></td><td></td><td></td><td></td><td></td></tr><tr><td>ZDEs</td><td>.303**</td><td>.318**</td><td>0.219</td><td>(0.565)</td><td></td><td></td><td></td><td></td><td></td></tr><tr><td>ZPRS</td><td>0.028</td><td>.419**</td><td>.371**</td><td>.658***</td><td>(0.41)</td><td></td><td></td><td></td><td></td></tr><tr><td>ZCPs</td><td>0.007</td><td>0.256*</td><td>.910**</td><td>0.089</td><td>.205**</td><td>(0.317)</td><td></td><td></td><td></td></tr><tr><td>ZKETs</td><td>.417***</td><td>-0.100</td><td>0.060</td><td>0.175*</td><td>0.047</td><td>0.042</td><td>(0.28)</td><td></td><td></td></tr><tr><td>ZOCs</td><td>.418***</td><td>0.006</td><td>0.090</td><td>.248**</td><td>0.050</td><td>0.046</td><td>.655**</td><td>(0.31)</td><td></td></tr><tr><td>ZRAs</td><td>0.077</td><td>0.022</td><td>0.085</td><td>.398***</td><td>.379**</td><td>0.023</td><td>.305**</td><td>0.214</td><td>(0.41)</td></tr></table>
Table 4 presents a matrix of R coefficients, which explores the relationships between pairs of z-scored variables representing different constructs (e.g., ZDCEs, ZBIMs, ZDSs, etc.). Rs are showing the strength and direction of the relationships between constructs. The diagonal elements in parentheses indicate the average variance extracted for each construct, a measure of convergent validity that assesses the extent to which items of a construct are positively correlated. For instance, ZDEs and ZPRS have a robust positive correlation $(R =.658^{****})$, suggesting that as one construct increases, the other tends to increase as well, and this relationship is statistically significant at the $p < 0.001$ level. Similarly, ZCPs and ZDSs are highly correlated $(R =.910^{****})$, indicating a strong positive relationship with statistical significance.
### d) Hypothesis Testing
Table 5 presents the results of hypothesis testing, adding depth to the cross-correlations by direct multivariate measures to evaluate the fit of different models to the data. The models test specific hypotheses concerning the relationships between the introduced construct and other variables within the dataset. A high RMSEA (root mean square error approximation) suggests a poor fit between the model and the observed data, indicating the need for model revision. Despite model data fit limitations, the survey analysis is a complete, valid measure involving an extraordinary spectrum. The mediation model successfully depicted indirect effects on the resolution (Baron & Kenny, 1986; Frazier et al., 2004). For example, in biotechnology studies, multiple indices can be eliminated if a too-good fit becomes a highly restricted model (Lai et al., 2016).
Table 5: Uses Dof (Degrees of Freedom), $\chi^2$ (Chi-Squared) Test, and P-Value for Model Evaluation. A P-Value $< 0.05$ Typically Rejects the Model Fit. Ratios $\chi^2 / df$, and RMSEA Show Fit Informing Questionnaire Validation
<table><tr><td>Models</td><td>DoF</td><td>(x2)</td><td>p-value</td><td>x2/df</td><td>RMSEA*</td><td>Hypotheses Result</td></tr><tr><td></td><td></td><td></td><td></td><td></td><td></td><td rowspan="2">Accepted for BIM2, BIM6; Rejected for others</td></tr><tr><td>BIMs</td><td>21</td><td>61.636</td><td><.001</td><td>2.92</td><td>Medium</td></tr><tr><td>DSs</td><td>10</td><td>N/A</td><td>>.05</td><td>N/A</td><td>High</td><td rowspan="2">Rejected for all (5)
Accepted for PRSO3, PRSO8; Rejected for others</td></tr><tr><td>PRS</td><td>153</td><td>497.613</td><td><.001</td><td>2.47</td><td>Medium</td></tr><tr><td>DEs</td><td>10</td><td>170.463</td><td><.001</td><td>17.463</td><td>Medium</td><td>Accepted for all (5)</td></tr><tr><td rowspan="2">CPs</td><td>10</td><td>N/A</td><td>>.05</td><td>N/A</td><td>High</td><td>Rejected for all (4)</td></tr><tr><td>6</td><td>59.579</td><td><.001</td><td>9.93</td><td>Null model</td><td>Accepted for PC, AR; Declined for SDA, ET</td></tr><tr><td>KETs</td><td></td><td></td><td></td><td></td><td></td><td></td></tr><tr><td>OCs</td><td></td><td></td><td></td><td></td><td></td><td>Accepted for all (3)</td></tr><tr><td>RAs</td><td></td><td></td><td></td><td></td><td></td><td>Rejected for all (4)</td></tr></table>
The hypotheses result column reflects hypothesis testing outcomes within each model for having relative model fit indices based on what we have (Schubert et al., 2017). The consideration of industry requirements culminates in certifying operating boundaries in the globally recognized framework for management. The question of accepting or rejecting the sample rather than removing the sample size could be based on p-values and fit indices like $\chi^2 / df$ and RMSEA with high factor loadings applicable to be studied. This would elevate the indices results due to limited saturation. As per medium models were found in the BIMs (business innovation models), specific hypotheses such as BIM2 (access) and BIM6 (turnkey project) having supported; product-related service (PRS) show PRS3 (training) and PRS8 (recycling/lifecycle of a product tracing); and for DE (digital elements) for all: DE1 (identification), DE2 (digital functions); DE3 (interfaces); DE4 (realtime-network); and DE5 (transformations). KETs (key enabling technologies) for AR (automation and robotics) with PC (production control) were supported, but other technologies like simulation, data analysis, and additive manufacturing were not. The OCs (organization concepts) spectrum showed affirmative. Table 5 shows that null modes were taken to the investigations to build a new model in discussion. The proposed automation and robotics technology management model was stable out of statistical biases. The industrial engineering management on automation and robotics robustness shows a technology model. Industrial Management's dilemma on perfect model fit corresponds to the highest
expectations (Hogeforster & Wildt, 2021). The chi-square is not definitive in determining fit indices in understanding industrialized imbalanced segregations with indications (West et al., 2012; Shi et al., 2019). The hypothesized per a priori model is in Figure 2—the path drives key relationships. The figure's paths provide the research model's partial exploratory factor analysis elimination perspective. The figure proposes In-not corroborated linkage to avoid worsening the model fit.
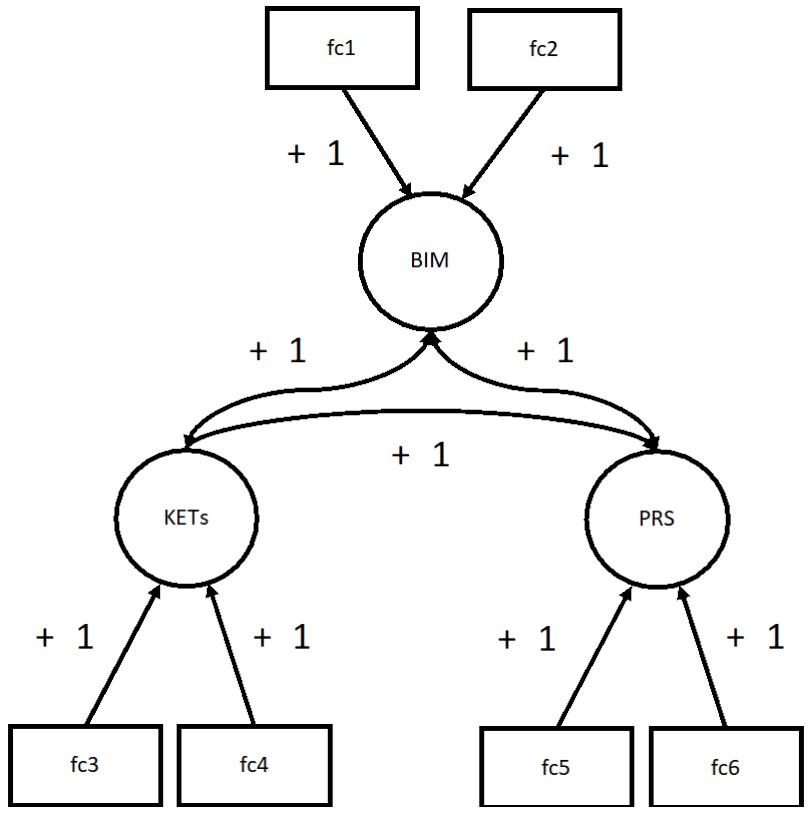
Figure 2: Has medium outlining for a null model for manufacturing survey results for discussion (arrows as causal hypotheses), focusing on contribution altogether, with BIMs with factors fc1-access and fc2-turn key innovation; KETs with factors fc3-automation and robotics and fc4-production control; and PRS, with factors fc5-online and fc6-maintenance provided —to achieve digital competitive advantage in Industry 4.0. Solid arrows depict validated causal connections between variables and factors, while double-headed arrows represent bidirectional correlations among BIMs, KETs, and PRS
### e) Refining Empirical Variables
The refined structural multivariate hypothesis test shows evidence for support. Proposed relationships in the explorative research model are merged. Automation and robotics technologies computed dependent variables. Given the guess. Given their increasing prevalence in smart factories (Wang et al., 2020). This will allow testing of the integration between production control software and automated/robotic management. Per Manufacturing execution systems (MES, m09g1) and product lifecycle management (PLM, m09f1) selection to the independence of production control systems. The integral components of digital manufacturing infrastructure were explored (Lee et al., 2022). Shall MES and PLMs be selected for real-time data collection, monitoring, quality management, and product lifecycle data management (Zhong et al., 2021)? As per demonstration affirmative. The maintenance model into performance could also be critical for manufacturing operations review (Grieco et al., 2022). The result identifies MES and PLM enabling the transformation forward for Industry 4.0 (Capgemini Research Institute, 2021).
## V. EMPIRICAL RESULTS
### a) Structural Concept
Per linear analysis: the depth included methods for causal links and chained handling of binary data, providing logic for advanced manufacturing (Heilala & Krolas, 2023). The logistic analysis is flexible per practice contract. Figure 3 shows that managed business innovation models (BIMs) and product-related services (PRS) can be abandoned. Industry 4.0 emphasizes manufacturing production control, automation, and robotics as key enablers. This framework for competitive advantage dynamics is in Figure 3.
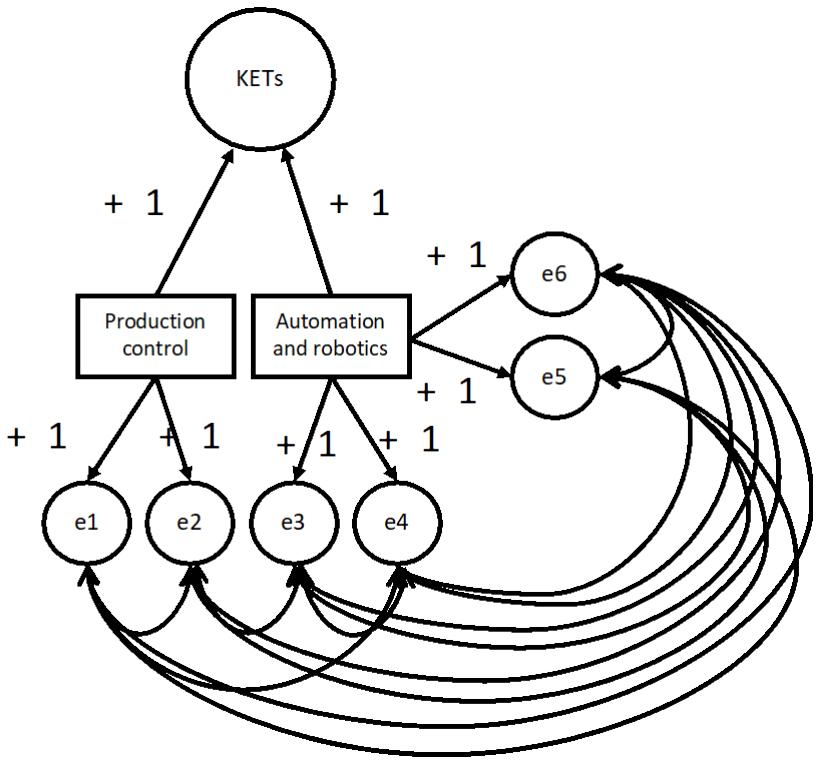 Figure 3: Structural Models Illustrate the a Priori Linear Relationships Between Automation and Robotics Production Control Endogenous Variables (E1-E6, M09, and M23-Series with Financial Management in EMS).
Exclusions of most of the factors were due to data constraints-imposed model. The boundary limitations for the power analysis on a small square are visible. Yielding lower RMSEA for fit between production control, automation, and robotics technologies. The correlates in m09-series endogenous variables e1 (f1) and e2 (g1), and connections to e3 (h1) and e4(i1) were highlighted. Integrating advanced technologies as foundational for Industry 4.0's competitive positioning evokes the primary hypothesis. The cross-sectional innovative servicing of robots and automation also linkages with e5(q1) and e6(r1) can validate hypotheses. Confirmatory analysis suggests that innovative business practices leverage m09-series digital capability. This implies refined performance strategies resulting in manufacturer-minimum classification. The pathways of the manufacturer show solid arrows for empirically supported hypotheses, as regression ruling demonstrates. Growth stimulates advancement in other elements without the requirement for simulation. The selection variables support the theoretical hypotheses in Table 7 (Appendix A).
Table 7: The examination of a logistic regression model showing linear as detailed in Appendix Awith A.1, merging various metrics of model performance with validation; A.2 measuring the model predicting correct outcomes; A.3-A.4 the model's accuracy to the relationship with result predictions
<table><tr><td></td><td>Precision</td><td>Recall</td><td>F1-Score</td><td>Support</td><td></td><td></td></tr><tr><td></td><td>0.0</td><td>1.00</td><td>0.71</td><td>0.83</td><td>7</td><td></td></tr><tr><td></td><td>1.0</td><td>0.88</td><td>1.00</td><td>0.93</td><td>14</td><td></td></tr><tr><td></td><td>accuracy</td><td>0.90</td><td>21</td><td></td><td></td><td></td></tr><tr><td></td><td>macro</td><td>avg</td><td>0.94</td><td>0.86</td><td>0.88</td><td>21</td></tr><tr><td>weighted</td><td>avg</td><td>0.92</td><td>0.90</td><td>0.90</td><td>21</td><td></td></tr></table>
The logistic regression predicts the fusion of automation technology with performance metrics. The characteristics of manufacturing classification accuracy elucidated precision to continue scientific discussions of applied regression's (Hilbe, 2009; Casella & Berger,
2002; Hosmer Jr et al., 2013). The analytical strategy's novelty shows reliability and discourse to literature to transform it into transformative innovation for engineering and financial management. Execution and lifecycle systems were chosen to represent the production of automation and robotics. These are integral components of digital manufacturing infrastructure for sustainability (Lee et al., 2022). These systems offer comprehensive capabilities for real-time data collection, monitoring, quality management, and product lifecycle data management (Zhong et al., 2021). Past research shows similarities in shipbuilding (Sánchez-Sotano et al., 2019). Execution systems dimensioning without what operations are left to the heavy organization procedures irrelevant to manufacturers. Leading industry reports also identify results essential in digital transformation enablers for Industry 4.0 (Capgemini Research Institute, 2021). Regressions in measuring the literature confirmed a similar significant positive correlation between integrated execution on the production lifecycle, and it is being integral to finance.
## VI. DISCUSSION
This study utilized path analysis and logistic regression to examine relationships between key manufacturing technologies and production outcomes. The analysis focused on widely adopted technologies and their interactions with automation and robotics. Positive correlations were found between these variables, validating hypothesized beneficial technology integration effects. While data limitations prevented confirmation of all proposed relationships, the statistically supported linkages represent essential findings for a refined model concentrating on validated connections to enable intelligent manufacturing performance.
The study also analyzed survey data assessing connections between digital transformation, manufacturing competitiveness, and employment in Finland. While hypothesis testing yielded mixed results, complex interrelationships, some business models and technologies exhibited clear positive ties to improved competitiveness. Furthermore, interactive interfaces, real-time networking, and digital transformation adoption are related to better competitiveness and employment scenarios (Moeuf et al., 2017). However, more than transparent or insignificant relationships were found for other variables like digital services, cybersecurity, simulation tools, and additive manufacturing (McNeish, 2018). These highlight areas needing further research before emphasis or investment.
## VII. CONCLUSION
A statistical factorization outlined manufacturers' contributions from 2019 to 2021. The science gap reaches integration into European manufacturing competition, which concludes with execution and lifecycle management. According to the original hypotheses, growth has complex interdependencies. The inevitable other elements correspond to the performance outcomes. However, the study cannot decide which principles of execution and lifecycle should prepare manufacturing. The standpoint on usable data constraints limited full confirmation. A partial overview supports every hypothesis. However, it is rare for a company to afford a complex system and business when manufacturing must be planned separately. A couple of more prominent companies with higher turnovers have higher integrative posts.
In conclusion, this study utilized statistical modeling to analyze the relationships for competitive manufacturing. Findings confirmed automation, robotics, and production control integration for performance. However, emerging technologies showed unclear impacts, requiring a reliable network. While small datasets set limitations preventing full spectral confirmation to all hypotheses reliably, responses contribute to future research and development. The database meta-analysis on the factor analysis' reliability reporting could be interesting to address in further studies. Factor analysis root means a square error has been outlined as heterogeneous, to which homogeneous generalization researchers aim to keep science differentiated from the actual practice. At the same time, others seem not to report indices. The indicative meta-analysis with regression test differentiates items and could open the industry trends, improving high indices.
### Appendix A: Evaluation of Logistic Regression Model Outcomes
import pandas as pd from sklearn.model selection import train test split
from sklearn.linear_model import Logistic Regression from sklearn.metrics import accuracy_score, classification_report
{"code_caption":[],"code_content":[{"type":"text","content":"'PLM_m09f1': [0, 1, 0, -99, 0, 0, 0, 0, 1, 0, 1, 0, 0, 1, 0, -99, 0, -99, 0, 0, 0, 0, 0, 1, 0, -99, 1, 0, 1, 1, 0, 0, 1, 1, 0, -99, 0, 0, -99, -99, 0, 0, 0, -99, 0, 0, 1, 0, 1, 0, -99, 0, 0, 1, -99, 1, 1 #... all others],\n'MES_ofm09g1': [0, 0, 0, -99, 0, 0, 0, 0, 0, 1, 0, 1, 1, 0, -99, 0, 0, 0, 1, 0, 0, -99, 1, -99, 0, 1, 0, 0, 1, 1, -99, 0, 0, 0, 1, 0,\n0, 1, 1, 1, 1, 1, 0, 1, 1, 0, 0, 1, 0, 1, 0, -99, 1, 0, 0, -99, -99, 0, 0, 0, -99, 0, 0, 0, -99,\n1, -99, 0, 1, 0, 1, 1, 1, 0, 0, 1, -99, 1, 0, 0, 0, 0, -99, 0, 0, -99,\n#... all\n'AR1_m09h1': [1,1,-99,-99.0.1,-99,-99,-99.1.0,-99.1,-99,-99.2,-99,-99,-99,-99,-99.3,-99.4,-99.5,-99.6,-\n-87.2.2.2.2.2.2.2.2.2.2.2.2.2.2.2.2.2.2.2.2.2.2.2.2.2.2.2.2.2.2.2.2.2.2.2.2.2.2.\n-87.2.2.2.2.2.2.2.2.2.2.2.2.2.2.2.2.2.2.\n-87.2.2.2.2.2.2.2.2.2.2.\n-87.2.2.2.2.2.2.\n-87.2.2.2.2.\n-87.2.2.2.\n-87.2.2.\n-87.\n-87.\n-87.\n-87.\n-87.\n-87.\n-87.\n-87.\n-87.\n-87.\n-87.\n-87.\n-87.\n-87.\n-87.\n-87.\n-87.\n-87.\n-87.\n-87.\n-87.\n-87.\n-87.\n-87.\n-87.\n-8\n-8\n-8\n-8\n-8\n-8\n-8\n-8\n-8\n-8\n-8\n-8\n-8\n-8\n-8\n-8\n-8\n-8\n-8\n-8\n-8\n-8\n-8\n-8\n-8\n-8\n-8\n-8\n-8\n-8\n-8\n-8\n-8\n-8\n-\n#... all\n#... all\n#... all\n#... all\n#... all\n#... all\n#... all\n#... all\n#... all\n#... all\n#... all\n#... all\n#... all\n#... all\n#... all\n#... all\n#... all\n#... all\n#... all\n#... all\n#... all\n#... all\n#... all\n#... all\n#... all\n#... all "}],"code_language":"csv"} {"code_caption":[{"type":"text","content":"Figure A. 2: Receiver Operating Characteristic (ROC) Curve Demonstrating Outcome Predictive Efficacy "}],"code_content":[{"type":"text","content":"import numpy as np \nfrom sklearn.metrics import precision_recall_fscore_support, roc_curve, auc \nimport matplotlib.pyplot \nimport seaborn as sns \ndf = pd.DataFrame(data) # As given \ndf.replace(-99, np.nan, inplace=True) \ndf.dropna(inplace=True) \nX = df[['PLM', 'MES']] # PLM & MES as features \ny = df['AR1'] # Assuming for example, that 'AR1' is the target variable \nX_train, X_test, y_train, y_test = train_test_split(X, y, test_size=0.3, random_state=42) \nlogreg = LogisticRegression() \nlogreg.fit(X_train, y_train) \ny_pred = logreg.predict(X_test) \ny_pred_proba = logreg.predict_proba(X_test)[:,1] \naccuracy = accuracy_score(y_test, y_pred) \nprecision, recall, f1, _ = precision_recall_fscore_support(y_test, y_pred, average='binary') \nreport = classification_report(y_test, y_pred) "}],"code_language":"python"}
{"code_caption":[{"type":"text","content":"Figure A.3: Histogram and Bar Plot Analysis Detailing Precision, Recall, and F1-Score for 'FF' and 'TF' Outcomes "}],"code_content":[{"type":"text","content":"print('Accuracy:', accuracy) \nprint('Precision:', precision) \nprint('Recall:', recall) \nprint('F1 Score:', f1) \nprint('Classification Report:\\n', report) \nfpr, tpr, thresholds = roc_curve(y_test, y_pred_proba) \nroc_auc = auc(fpr, tpr) "}],"code_language":"python"} {"code_caption":[],"code_content":[{"type":"text","content":"# Plotted normalized data \ndata = {# 'Y': [5.5, 6.7, 8.8, 4.4], # Interface \n'AT_m23a1': [1, 2, 3, 4], # Growth for 2021 \n'AT_m23a2': [2.1, 2.2, 2.3, 2.4], Growth for 2019 \n'NE_m23b1': [3, 3.1, 3.2, 3.3], # Size for 2021 \n'NE_m23b2': [4, 4.1, 4.2, 4.3], # Size for 2019 \n'AR1 m09h1': [5, 5.1, 5.2, 5.3], # Industrial robots for manufacturing adoption \n'AR2 m09i1': [6, 6.1, 6.2, 6.3], # Industrial robots for handling adoption adoption \n'AR3 m09q1': [7, 7.1, 7.2, 7.3], # Mobile industrial robots adoption \n'AR4 m09r1': [8, 8.1, 8.2, 8.3],}# Collaborating robots adoption \ndf = pd.DataFrame(data) \n# -99 missing removal \ndf = df[df.PLM!= -99] \ndf = df[df.MES!= -99] \nfig, ax = plt.subplot(nrows=1, ncols=2, figsize=(10, 5)) \nax[0].hist(df['PLM'], bins=3, edgecolor='black') \nax[0].set_title('PLM Distribution') \nax[0].set_xlabel('PLM Value') \nax[0].set_ylabel('Frequency') \nax[1].hist(df['MES'], bins=3, edgecolor='black') \nax[1].set_title('MES Distribution') \nax[1].set_xlabel('MES Value') \nax[1].set_ylabel('Frequency') \nplt.tight.layout() \nplt.show() \n# Regression \nsns.regplot(x='PLM', y='MES', data=npy=True, ci=None) # logistic regression as data is binary \nplt.title('Regression Plot between PLM and MES') "}],"code_language":"python"}
{"code_caption":[{"type":"text","content":"Figure A.4: Scatter Plot with Trend Line for Model Support Against 'Outcome' Categories "}],"code_content":[{"type":"text","content":"data = pd.DataFrame(\\{\\# Tabulated logistic training results\n'Outcome': ['FF', 'TF', 'Accuracy', 'Macro Avg', 'Weighted Avg'],\n'Precision': [1.00, 0.88, None, 0.94, 0.92],\n'Recall': [0.71, 1.00, None, 0.86, 0.90],\n'F1-Score': [0.83, 0.93, 0.90, 0.88, 0.90],\n'Support': [7, 14, 21, 21, 21]}) \npalette = {\"FF\": \"#1f77b4\", \"TF\": \"#ff7f0e\"} \nplt.figure(figsize=(20, 6)) \n# Plot 1 for Precision, Recall, and F1-Score for FF and TF \nplt.subplot(1, 2, 1) # 1 row, 2 columns, first subplot \nbar_data = data[:2].melt(id_vars='Outcome', value_vars=['Precision', 'Recall', 'F1-Score']) \nbar.plot =sns.barplot(x='variable', y='value', hue='Outcome', data=bar_data, palette=palette) "}],"code_language":"python"}

{"code_caption":[],"code_content":[{"type":"text","content":"plt.ylim(0, 1.1) \nplt.title('Precision, Recall, and F1-Score by Outcome') \npltylabel('Score') \nplt.xlabel('Metric') \npltlegend(title='Outcome') \nfor container in bar.plot.containers: \n bar.plot.bar_label/container, fmt='%%.2f', padding=3) \n# Plot 2 for F1-Score for Accuracy, Macro Avg, and Weighted Avg \nplt.subplot(1, 2, 2) # 1 row, 2 columns, second subplot \nf1_data = data[2].melt(id_vars='Outcome', value_vars=['F1-Score']) \nf1_plot =sns.barplot(x='Outcome', y='value', data=f1_data) \nplt.ylim(0, 1.1) \nplt.title('F1-Score for Accuracy, Macro Avg, and Weighted Avg') \npltylabel('F1-Score') \nplt.xlabel('Metric') \nfor container in f1_plot.containers: \n f1_plot.bar_label/container, fmt='%%.2f') \nplttight.layout() "}],"code_language":"python"}
Generating HTML Viewer...
References
48 Cites in Article
James Anderson,David Gerbing (1988). Structural equation modeling in practice: A review and recommended two-step approach..
Reuben Baron,David Kenny (1986). The moderator-mediator variable distinction in social psychological research: Conceptual, strategic, and statistical considerations..
N Bozgulova,A Adambekova (2023). COST ACCOUNTING IN THE CONSTRUCTION INDUSTRY.
L Chia-Yen,J Andrew (2015). Effective production: measuring of the sales effect using data envelopment analysis.
(2020). Global Tracer Facility Global Tracer Survey 2020 (Year 5) Survey Instrument Items.
J Creswell (2015). A concise introduction to mixed methods research.
B Dachs,C Zanker (2015). Backshoring of production activities in European manufacturing.
W Edmonds,Thomas Kennedy (2019). An Applied Guide to Research Designs: Quantitative, Qualitative, and Mixed Methods.
Marikka Heikkilä,Harry Bouwman (2022). Business Model Innovation in European SMEs - Descriptive analysis of quantitative survey and case survey data.
C Zanker,C Moll,A Jäger (2015). Analysis of the impact of robotic systems on employment in the European Union -Final report.
(2014). The impact of accounting rules and practices on resource efficiency in the EU.
(2016). The Joint Harmonised EU Programme Of Business and Consumer Surveys: User Guide given on.
Patricia Frazier,Andrew Tix,Kenneth Barron (2004). Testing Moderator and Mediator Effects in Counseling Psychology Research..
R Gomila (2021). Logistic or linear? Estimating causal effects of experimental treatments on binary outcomes using regression analysis.
A Grieco,M Ouertani,P Pasini,L Lorenzini (2022). Industry 4.0 and operations management: a systematic literature review based on citation network analysis.
Dandan He,Zhongfu Li,Chunlin Wu,Xin Ning (2018). An E-Commerce Platform for Industrialized Construction Procurement Based on BIM and Linked Data.
Janne Heilala (2022). New Waves in Innovation Management Research (ISPIM Insights) [PDF. E-book].
Janne Heilala,Pawel Krolas (2023). Locating A Smart Manufacturing based on Supply Chain Segregation.
Joseph Hilbe (2009). Logistic Regression Models.
M Hogeforster,J Wildt (2021). What performance indicators predict conversion success? A meta-analysis on web survey invitations.
David Hosmer,Stanley Lemeshow,Rodney Sturdivant (2013). Applied Logistic Regression.
Lohana Juariyah,Tulus Hendra Wardana,Afwan Ap (2020). Factors Analysis of Employees’ Intention to Stay in Chemical Manufacturing.
Steffen Kinkel,Eva Kirner,Heidi Armbruster,Angela Jager (2015). Relevance and innovation of production-related services in manufacturing industry.
Keke Lai,Samuel Green (2016). The Problem with Having Two Watches: Assessment of Fit When RMSEA and CFI Disagree.
J Lee,B Bagheri,H Kao (2022). An in-depth review of Industry 4.0 research for operations and supply chain management: Current trends, opportunities and future directions.
Ali Malik,Tariq Masood,Alexander Brem (2023). Intelligent Humanoid Robots in Manufacturing.
M Matsunaga (2010). How to factor-analyze your data right: Do's, don'ts, and how-to's.
Daniel Mcneish,Ji An,Gregory Hancock (2018). The Thorny Relation Between Measurement Quality and Fit Index Cutoffs in Latent Variable Models.
Namish Mehta,Prakash Verma,Nitin Seth (2010). Total quality management implementation in engineering education in India: an interpretive structural modelling approach.
Alexandre Moeuf,Robert Pellerin,Samir Lamouri,Simon Tamayo-Giraldo,Rodolphe Barbaray (2018). The industrial management of SMEs in the era of Industry 4.0.
W Revelle (2013). Psych: Procedures for psychological, psychometric, and personality research.
J Robinson,R Schumacker (2009). Supplemental Information 4: Variance inflation factor for the multivariable linear regression analysis of the whole lung lesion absorption ratio.
A Sánchez-Sotano,A Cerezo-Narváez,F Abad-Fraga,A Pastor-Fernández,J Salguero-Gómez (2019). Trends of Digital Transformation in the Shipbuilding Sector.
Patrick Schober,Christa Boer,Lothar Schwarte (2018). Correlation Coefficients: Appropriate Use and Interpretation.
A.-L Schubert,D Hagemann,A Voss,K Bergmann (2017). Evaluating the model fit of diffusion models with the root mean square error of approximation.
Dexin Shi,Taehun Lee,Alberto Maydeu-Olivares (2019). Understanding the Model Size Effect on SEM Fit Indices.
Keith Taber (2016). The Use of Cronbach’s Alpha When Developing and Reporting Research Instruments in Science Education.
Ledyard Tucker,Charles Lewis (1973). A Reliability Coefficient for Maximum Likelihood Factor Analysis.
J Wang,X Wang,Y He (2020). Performance shaping factors dependence assessment through moderating and mediating effect analysis.
Webropol (2022). Webropol services.
S West,A Taylor,W Wu (2012). Model fit and model selection in structural equation modeling.
Ray Zhong,Chen Xu,Chao Chen,George Huang (2021). Big Data Analytics for Physical Internet-based intelligent manufacturing shop floors.
R Zhong,X Xu,E Klotz,S Newman (2000). Intelligent manufacturing in the context of industry 4.0: A review.
Andreas Ernesti,Jeremy Hutson (1995). Calculations of the spectra of rare gas dimers and trimers: Implications for additive and nonadditive intermolecular forces in Ne2–Ar, Ne2–Kr, Ne2–Xe, Ar2–Ne, Ar3, Ar2–Kr and Ar2–Xe.
X_Test X_Train,Y_Train (null). Figure 15: Precision, recall, F1-score, and accuracy values from second test..
(null). Figure 18: F1-score plot of different CNN models..
No ethics committee approval was required for this article type.
Data Availability
Not applicable for this article.
How to Cite This Article
Janne Heilala. 2026. \u201cOptimizing Smart Factories: A Data-Driven Approach\u201d. Global Journal of Research in Engineering - G: Industrial Engineering GJRE-G Volume 23 (GJRE Volume 23 Issue G3).
Explore published articles in an immersive Augmented Reality environment. Our platform converts research papers into interactive 3D books, allowing readers to view and interact with content using AR and VR compatible devices.
Your published article is automatically converted into a realistic 3D book. Flip through pages and read research papers in a more engaging and interactive format.
Our website is actively being updated, and changes may occur frequently. Please clear your browser cache if needed. For feedback or error reporting, please email [email protected]
Thank you for connecting with us. We will respond to you shortly.