## I. INTRODUCTION
The Hong Kong Legislative Council formally enacted a subsidiary law on the registration of Chinese medicine practitioners (CMPs) in 2000. This requires CMPs to pass the registration examination of the Chinese Medicine Council of Hong Kong before they can practice in Hong Kong (Jiang & Che, 2000). Furthermore, since 2000, CMP shave been able to issue legally valid sick leave and work injury certificates. This has gradually improved the status and image of CMPs in the minds of Hong Kong citizens. With this improvement, senior citizens no longer constitute the majority of Chinese medicine (CM) supporters. More young people and highly educated people have begun to accept and use CM. For example, a study found that $71.1\%$ of the women who had consulted a CMP were 15 to 54 years old and that $79.6\%$ of the female patients seeking CMP consultation had a college degree or above (Chan & Chan, 2014). In addition, the Hong Kong Special Administrative Region (HKSAR) government has been actively developing CM. For example, the number of registered CMPs increased from 5,012 in 2005 to 6,243 in 2011 (Department of Health, 2012) and reached 7,404 in 2019(Hong Kong Chinese Medicine Council, 2019). The number of CM clinics has also increased. In addition, the first CM hospital in Hong Kong has completed the first round of tenders. The attention and recognition of CM in the international community has also been strengthened. Hence, a group of capable CMPs is required to further the development of the industry.
Although the development prospects of the CM seem very optimistic, some have proposed that they are actually unknown. Despite seeming to support the CM industry, the government has not formulated a salary scale. The timetable for CM integration into public health care is also far from being confirmed. Furthermore, the salaries and benefits of CMPs are far lower than those of Western medicine doctors. For example, in 2019, the starting CMP salary was approximately HKD25,000, whereas the starting salary for Western medicine doctors was approximately HKD61,060. Previous research data have generally demonstrated a serious turnover rate among Hong Kong CMPs. For example, $22.8\%$ of Hong Kong CMPs had left their organizations in 2018-19 (Chua, Lau, Lee, & Lam, 2021). Such turnover may lead to a less favorable atmosphere in the industry and thereby reduce organizations' desire to cultivate and inherit CMPs and to practice CM.
According to representative information from major institutions, namely the Hospital Authority Tripartite Chinese Medicine Centre for Training and Research, university clinics, CM clinics operated by nongovernment organizations and private CM clinics, the turnover tendency of CMPs is related to job satisfaction (e.g., salary, management, interpersonal relationships and working environment), work stress and organizational commitment. Therefore, this study explores the relationships between these three factors and the high turnover among CMPs in Hong Kong. Furthermore, it uses the results to make feasible recommendations for management consideration.
## II. METHOD
Qualified Hong Kong CMPs were targeted using online questionnaires to collect primary data. All of the collected data will be destroyed 3 years after study completion. It had been approved by the Ethics Committee of the Hong Kong Baptist University's Institutional Review Board (code: REC/19-20/0383).
### a) Hypotheses
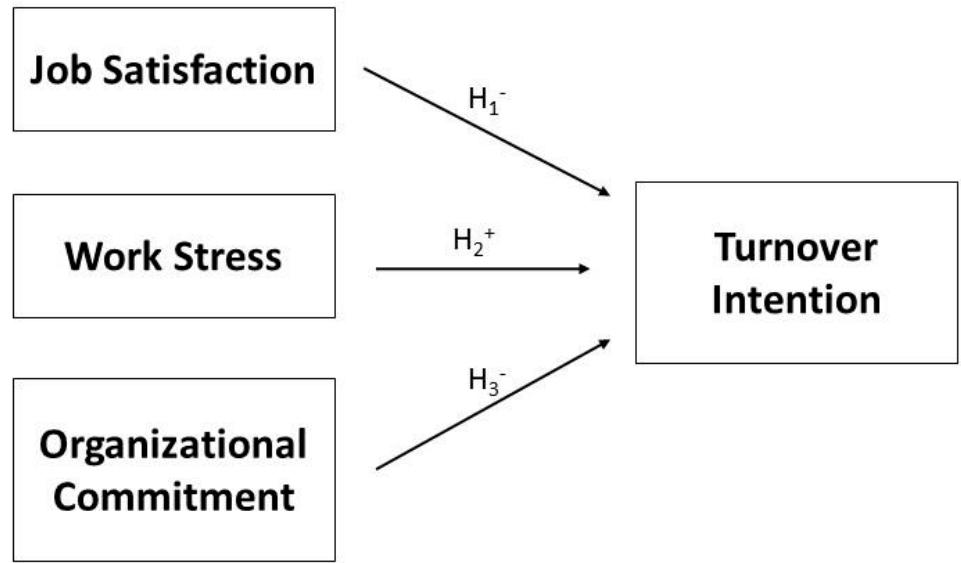
Job satisfaction, work stress and organizational commitment were used as the independent variables, and turnover intention was used as the dependent variable. Three hypotheses were investigated.
$H_{1}$: Job satisfaction is negatively related to turnover intention.
$H_{2}$: Work stress is positively related to turnover intention.
$H_{3}$: Organizational commitment is negatively related to turnover intention.
 Figure1: Model Factor and Coefficient
### b) Participants
Any CMP (including registered CMPs, listed CMPs and limited registered CMPs) certified by the Department of Health in Hong Kong was included in the study regardless of their gender, age, job discipline and nature of their organizations, provided they were willing to participate in the online questionnaire. The respondents who were not qualified to practice lawfully in Hong Kong were not considered to be qualified respondents regardless of whether they had a CM degree.
### c) Recruitment procedures
From August 1 to 16, 2019, the questionnaire was distributed in the form of an online Google questionnaire to major stakeholders in the CM industry, including the alumni of the three local universities (i.e., the Hong Kong Baptist University, the Chinese University of Hong Kong and the University of Hong Kong) and the Xinhua Chinese Medicine Promotion Association (a qualified CM association under the Hong Kong Chinese Medicine Council). The representatives forwarded the questionnaire link via mobile instant messaging software (e.g., WhatsApp) and Facebook groups to reach more CMPs.
### d) Sample size calculation
For the multi-factor analysis, the following formula was used: $N \geq 50 + 8m$, where $N$ is the required sample number and $m$ is the number of different factors in the study (Green, 1991). Given the examination of four factors (i.e., job satisfaction, work stress, organizational commitment and turnover intention), the minimum estimated sample size required was 82 people. Considering the generally estimated $5\%$ sampling error for questionnaires, at least 87 valid questionnaires had to be collected to detect the relationships between the variables.
### e) Questionnaire development
The questionnaire was divided into two parts, with the first part collecting basic information and the second part collecting variable-related information. All of the cited questions were from English questionnaires published in international journals. They were translated into Chinese and reviewed by the research team.
The first part collected the basic information of the interviewees. It was designed in reference to a survey of doctors' turnover intention in Guangdong, China (Lu et al., 2017). The wordings and some specific questions were adjusted according to the con text of the CM industry and Hong Kong.
The second part collected data for the scoring of the research variables. It included four sections from four different journals: job satisfaction (Wang et al., 2017), work stress (Aderibigbe & Mjoli, 2018), organizational commitment (Lu et al., 2017) and turnover intention (Memon et al., 2017). To make the questionnaire more uniform, all of the options were changed according to a Likert 5-point scale (1 = "strongly disagree," 2 = "disagree," 3 = "neutral," 4 = "agree" and 5 = "strongly agree").
A pilot questionnaire was developed to check the appropriateness of the questions' wording and reduce ambiguity. At least 30 CMPs were invited to complete the pilot questionnaire, enabling its reliability to be examined. The variables with a Cronbach's alpha value over 0.7 were accepted.
After the pilot test, at least 87 valid questionnaires were to be collected. The electronic questionnaire mandated the respondents to answer all of the questions, yielding a low likelihood of obtaining invalid questionnaires. The only questionnaires that were suspected to be invalid were those in which the respondents chose the same option throughout. These questionnaires were excluded. The full content of the formal questionnaire is provided in Supplementary Document 1.
### f) Statistical analysis
All of the collected data were exported directly via online Excel to avoid human input errors. Then, in offline Excel, the results were adjusted and encoded into an SPSS format. Input methods were used twice. The same original data were encoded twice independently. The two data sets were statistically analyzed with SPSS 25.0, and the results were compared to ensure data accuracy.
Although the questionnaires were developed from published literature, they were not originally for CM. A reliability test of the pilot questionnaire was carried out, and Cronbach's alpha was used to analyze its reliability and stability. If the reliability was insufficient, the coefficient results were improved by subtracting the least relevant topics. A correlation test of Pearson's product-moment correlation coefficient was then conducted to identify any relationships between the variables and to determine the strength of these relationships. Further multiple regression analysis was used to confirm the strength of the relationships among the variables.
## III. RESULTS
From July 28 to 31, 2019, 34 registered CMPs from different institutions were invited to complete the pilot questionnaire. All of their valid questionnaires were successfully collected (15 male and 19 female participants). The pre- and post-reliability credibility results (excluding the least related questions) are summarized in Table 1.
Table 1: Pilot Questionnaire Reliability Test Results
<table><tr><td>Variable</td><td>α</td><td>No. of questions</td><td>Removed questions</td><td>Revised α</td></tr><tr><td>Job satisfaction</td><td>0.901</td><td>1-28 (total: 28)</td><td>N/A</td><td>0.901</td></tr><tr><td>Work stress</td><td>0.865</td><td>29-35 (total: 7)</td><td>#30 (6 remained)</td><td>0.886</td></tr><tr><td>Organizational commitment</td><td>0.104</td><td>36-50 (total: 15)</td><td>#38,42,44,46,47,50
(9 remained)</td><td>0.906</td></tr><tr><td>Turnover intention</td><td>0.950</td><td>51-55 (total: 5)</td><td>N/A</td><td>0.950</td></tr><tr><td>Full questionnaire</td><td>0.514</td><td>1-55 (total: 55)</td><td>#30,38,42,44,46,47,50
(48 remained)</td><td>0.728</td></tr></table>
From August 1 to 16, 2019, the revised questionnaires were forwarded by the abovementioned major stakeholders in the CM industry to the CMPs. Ultimately, 141 valid questionnaires were successfully collected. Slightly more women (53.9%) than men completed the questionnaire. The main age group was between 31 and 40 years old (47.5%). Most of the participants had a Master's degree (53.2%). Furthermore, 99.3% were registered CMPs, and 97.2% were providing consultation services. Among the entire sample, $75.2\%$ were general practitioners and $46.8\%$ had 4 to 9 years of work experience. Many of the respondents $(34\%)$ worked at the Hospital Authority Tripartite Chinese Medicine Centre for Training and Research (Tripartite Centre). Furthermore, $91.5\%$ of the CMPs worked full-time, and $73.8\%$ worked between 40 and 49 hours per week. Their monthly salaries largely ranged from HKD20,000 to HKD29,999 $(42.6\%)$. Many of the interviewees indicated having no fixed working area (23.4%), and 84.4% of the
details are shown in Table 2.
respondents' major job was outpatient service. The
Table 2: Basic Interviewee Information
<table><tr><td colspan="10">Option(number of people;%)</td></tr><tr><td>Gender</td><td colspan="3">Male (63; 44.7)</td><td colspan="3">Female (76; 53.9)</td><td colspan="3">NIL (2; 1.4)</td></tr><tr><td>Age</td><td colspan="2">≤30 (64; 45.4)</td><td colspan="2">31-40 (66; 46.8)</td><td colspan="2">41-50 (7; 5.0)</td><td colspan="3">≥ 51 (4; 2.8)</td></tr><tr><td>Education</td><td>≤ Bachelor's(6;4.3)</td><td colspan="2">Bachelor's (46;32.6)</td><td colspan="2">Master's (75;53.6)</td><td colspan="2">Doctorate (11;7.8)</td><td colspan="2">NIL (3;2.1)</td></tr><tr><td>Qualifications</td><td colspan="3">Registered CMP (140; 99.3)</td><td colspan="2">Listed CMP (0; 0)</td><td colspan="4">Limited registered CMP (1; 0.7)</td></tr><tr><td>Practicing</td><td colspan="5">Yes (137;97.2)</td><td colspan="4">No (4;2.8)</td></tr><tr><td>Major</td><td>General
(109; 77.3)</td><td>Internal
(10; 7.1)</td><td>Surgical
(1; 0.7)</td><td>Gynecolo
gy
(2; 1.4)</td><td>Pediatrics
(1; 0.7)</td><td>Acupuncture
e
(9; 6.4)</td><td>Orthopedic
s
(3; 2.1)</td><td>Tuina
(2; 1.4)</td><td>NIL
(4; 2.8)</td></tr><tr><td>Years of
service</td><td colspan="2">0~3 (54;38.3)</td><td colspan="2">4~9 (66;46.8)</td><td colspan="2">10~19 (17;12.1)</td><td colspan="3">≥ 20 (4;2.8)</td></tr><tr><td>Organization</td><td colspan="2">Tripartite Centre*
(48; 34)</td><td colspan="2">NGO clinic
(10; 7.1)</td><td>University clinic
(14; 9.9)</td><td>Private clinic
(35; 24.8)</td><td colspan="2">Self-employed
(30; 21.3)</td><td>Others
(4; 2.8)</td></tr><tr><td>State</td><td colspan="4">Full-time (129; 91.5)</td><td colspan="2">Part-time (11; 7.8)</td><td colspan="3">Unemployed (1; 0.7)</td></tr><tr><td>Work hours</td><td colspan="2">≤39(22; 15.6)</td><td colspan="2">40~49(104; 73.8)</td><td>50~59(7; 5)</td><td colspan="2">≥60(6; 4.3)</td><td colspan="2">NIL (2; 1.4)</td></tr><tr><td>Salary</td><td>≤9,999
(2; 1.4)</td><td>≤19,999
(7; 5)</td><td colspan="2">≤29,999
(60; 42.6)</td><td>≤39,999
(38; 27)</td><td>≤49,999
(16; 11.3)</td><td>≤50,000
(16; 11.3)</td><td colspan="2">NIL
(2; 1.4)</td></tr><tr><td>Work district</td><td>Hong
Kong
Island
(22; 15.6)</td><td>Kowloon East
(15; 10.6)</td><td colspan="2">Kowloon
West
(24; 17)</td><td>New Territories
East
(21; 14.9)</td><td>New Territories
West
(23; 16.3)</td><td>Unfixed
(33; 23.4)</td><td colspan="2">NIL
(3; 2.1)</td></tr><tr><td>Major duty</td><td>Out-patient
(119; 84.8)</td><td>Vehicle
(3; 2.1)</td><td>Outreach
(2; 1.4)</td><td>Administra
tion
(1; 0.7)</td><td>Teaching
(4; 2.8)</td><td>Research
(3; 2.1)</td><td>Unfixed
(7; 5)</td><td colspan="2">NIL
(2; 1.4)</td></tr></table>
### a) Reliability test
The results of all of the items in the formal questionnaire were consistent with the results of the pilot questionnaire. Job satisfaction $(\alpha = 0.949)$, organizational commitment $(\alpha = 0.937)$ and turnover intention $(\alpha = 0.931)$ demonstrated strong Cronbach's $\alpha$ values. Work stress $(\alpha = 0.830)$ and the whole questionnaire $(\alpha = 0.886)$ demonstrated acceptable Cronbach's $\alpha$ values. Thus, the formal questionnaire results demonstrated very high reliability.
### b) Correlation test
The results of the correlation test are shown in Table 3. The relationships between job satisfaction and turnover intention (r = -0.662, p < 0.01) and between organizational commitment and turnover intention (r = -0.659, p < 0.01) were moderately statistically negative. However, the relationship between work stress and turnover intention (r = 0.400, p < 0.01) was moderately statistically positive.
Table 3: Correlation Test Results
<table><tr><td colspan="2"></td><td colspan="2">Job satisfaction</td><td>Work stress</td><td>Organizational commitment</td><td>Turnover intention</td></tr><tr><td rowspan="3">Job satisfaction</td><td>Pearson correlation</td><td>1</td><td colspan="2">-0.457**</td><td>0.777**</td><td>-0.662**</td></tr><tr><td>sig.(2-tailed)</td><td></td><td colspan="2">0.000</td><td>0.000</td><td>0.000</td></tr><tr><td>N</td><td>141</td><td colspan="2">141</td><td>141</td><td>141</td></tr><tr><td rowspan="3">Work stress</td><td>Pearson correlation</td><td>-0.457**</td><td colspan="2">1</td><td>-0.306**</td><td>0.400**</td></tr><tr><td>sig.(2-tailed)</td><td>0.000</td><td colspan="2"></td><td>0.000</td><td>0.000</td></tr><tr><td>N</td><td>141</td><td colspan="2">141</td><td>141</td><td>141</td></tr><tr><td rowspan="3">Organizational commitment</td><td>Pearson correlation</td><td>0.777**</td><td colspan="2">-0.306**</td><td>1</td><td>-0.659**</td></tr><tr><td>sig.(2-tailed)</td><td>0.000</td><td colspan="2">0.000</td><td></td><td>0.000</td></tr><tr><td>N</td><td>141</td><td colspan="2">141</td><td>141</td><td>141</td></tr><tr><td rowspan="3">Turnover intention</td><td>Pearson correlation</td><td>-0.662**</td><td colspan="2">0.400**</td><td>-0.659**</td><td>1</td></tr><tr><td>sig.(2-tailed)</td><td>0.000</td><td colspan="2">0.000</td><td>0.000</td><td></td></tr><tr><td>N</td><td>141</td><td colspan="2">141</td><td>141</td><td>141</td></tr></table>
### c) Regression analysis
The results of the regression tests are summarized in Table 4. The results of the analyses of variance are summarized in Table 5.
Table 4: Regression Test Abstract
<table><tr><td>Model</td><td>R</td><td>R2</td><td>Adjusted R2</td><td>Standard error</td></tr><tr><td>1</td><td>0.662</td><td>0.438</td><td>0.434</td><td>0.87596</td></tr><tr><td>2</td><td>0.400</td><td>0.160</td><td>0.154</td><td>1.07075</td></tr><tr><td>3</td><td>0.659</td><td>0.434</td><td>0.430</td><td>0.87917</td></tr><tr><td>4</td><td>0.712</td><td>0.507</td><td>0.497</td><td>0.82582</td></tr></table>
1. Simple regression of job satisfaction and turnover intention.
2. Simple regression of work stress and turnover intention.
3. Simple regression of organizational commitment and turnover intention.
4. Multiple regression of job satisfaction, work stress, organizational commitment and turnover intention.
Table 5: Analysis of Variance Regression Results
<table><tr><td colspan="2">Model</td><td>Sum of squares</td><td>df</td><td>Mean square</td><td>F</td><td>Sig.</td></tr><tr><td>1</td><td>Regression</td><td>83.047</td><td>1</td><td>83.047</td><td>108.231</td><td>0.000</td></tr><tr><td></td><td>Residual</td><td>106.656</td><td>139</td><td>0.767</td><td></td><td></td></tr><tr><td></td><td>Total</td><td>189.703</td><td>140</td><td></td><td></td><td></td></tr><tr><td>2</td><td>Regression</td><td>30.338</td><td>1</td><td>30.338</td><td>26.461</td><td>0.000</td></tr><tr><td></td><td>Residual</td><td>159.365</td><td>139</td><td>1.147</td><td></td><td></td></tr><tr><td></td><td>Total</td><td>189.703</td><td>140</td><td></td><td></td><td></td></tr><tr><td>3</td><td>Regression</td><td>82.265</td><td>1</td><td>82.265</td><td>106.431</td><td>0.000</td></tr><tr><td></td><td>Residual</td><td>107.438</td><td>139</td><td>0.773</td><td></td><td></td></tr><tr><td></td><td>Total</td><td>189.703</td><td>140</td><td></td><td></td><td></td></tr><tr><td>4</td><td>Regression</td><td>96.272</td><td>3</td><td>32.091</td><td>47.055</td><td>0.000</td></tr><tr><td></td><td>Residual</td><td>93.431</td><td>137</td><td>0.682</td><td></td><td></td></tr><tr><td></td><td>Total</td><td>189.703</td><td>140</td><td></td><td></td><td></td></tr></table>
1. Simple regression of job satisfaction and turnover intention.
2. Simple regression of work stress and turnover intention.
3. Simple regression of organizational commitment and turnover intention.
4. Multiple regression of job satisfaction, work stress, organizational commitment and turnover intention.
The results of the analysis of variance regression are shown in Table 5. Although the F test showed significant differences $(p < 0.05)$ across all of the models, the interpretation of a single factor by $R^2$ was vitiated, and model 1-3 was relatively low in Table 4.
Table 6a shows the coefficient results of the regression test. The relationships between job satisfaction and turnover intention and between organizational commitment and turnover intention were negative, whereas the relationship between work stress and turnover intention was positive. These results were consistent with those of the correlation test.
Table 6a: Regression Test Coefficient Results
<table><tr><td rowspan="2" colspan="2">Model</td><td colspan="2">Unstandardized coefficients</td><td>Standardized coefficients</td><td rowspan="2">T</td><td rowspan="2">Sig.</td></tr><tr><td>B</td><td>Std. Error</td><td>Beta</td></tr><tr><td>1</td><td>(constant)</td><td>6.545</td><td>0.383</td><td></td><td>17.090</td><td>0.000</td></tr><tr><td></td><td>Job satisfaction</td><td>-1.180</td><td>0.113</td><td>-0.662</td><td>-10.403</td><td>0.000</td></tr><tr><td>2</td><td>(constant)</td><td>0.925</td><td>0.345</td><td></td><td>2.684</td><td>0.008</td></tr><tr><td></td><td>Work stress</td><td>0.610</td><td>0.119</td><td>0.400</td><td>5.144</td><td>0.000</td></tr><tr><td>3</td><td>(constant)</td><td>5.182</td><td>0.258</td><td></td><td>20.110</td><td>0.000</td></tr><tr><td></td><td>Organizational commitment</td><td>-0.803</td><td>0.078</td><td>-0.659</td><td>-10.317</td><td>0.000</td></tr></table>
1. Simple regression of job satisfaction and turnover intention.
2. Simple regression of work stress and turnover intention.
3. Simple regression of organizational commitment and turnover intention.
Table 6b: Multiple Regression Test Coefficient Results
<table><tr><td rowspan="2" colspan="2">Model</td><td colspan="2">Non-standardized coefficient</td><td colspan="2">Standardized coefficient</td><td rowspan="2">Sig.</td><td colspan="2">Collinear statistics</td></tr><tr><td>B</td><td>Standard error</td><td>Beta</td><td>T</td><td>Tolerance</td><td>VIF</td></tr><tr><td>4</td><td>(constant)</td><td>5.244</td><td>0.603</td><td></td><td>8.700</td><td>0.000</td><td></td><td></td></tr><tr><td></td><td>Job satisfaction</td><td>-0.531</td><td>0.182</td><td>-0.298</td><td>-2.912</td><td>0.004</td><td>0.344</td><td>2.906</td></tr><tr><td></td><td>Work stress</td><td>0.224</td><td>0.103</td><td>0.147</td><td>2.172</td><td>0.032</td><td>0.786</td><td>1.273</td></tr><tr><td></td><td>Organizational commitment</td><td>-0.466</td><td>0.116</td><td>-0.382</td><td>-4.004</td><td>0.000</td><td>0.394</td><td>2.538</td></tr></table>
1. Multiple regressions of job satisfaction, work stress, organizational commitment and turnover intention.
Multivariate regression analysis was performed using job satisfaction, work stress and organizational commitment as predictive variables (independent variables) and turnover intention as a dependent variable in Model 4. No collinear problems were found in any test. The $R^2$ value was 0.507, yielding a degree of turnover intention of $50.7\%$ and reaching a medium intensity. The explanation by considering all variables was generally higher than that for a single variable. All three variables were significantly related to turnover intention. Job satisfaction ( $B = -0.531$, $p < 0.05$ ) and organizational commitment ( $B = -0.466$, $p < 0.05$ ) had negative relationships with turnover intention, whereas work stress ( $B = 0.224$, $p < 0.05$ ) had a positive relationship with turnover intention. The following unstandardized regression model was used for this analysis:
Turnover intention = 5.244 - 0.531 x (job satisfaction) + 0.224 x (work stress) - 0.466 x (organizational commitment)
The following standardized regression model was used:
Turnover Intention $= -0.298 \times$ (job satisfaction) + 0.147 x (work stress)-0.382 x (organizational commitment)
Therefore, the variables rank in the following order of importance: organizational commitment $>$ job satisfaction $>$ work stress.
### d) Follow-up analysis of job satisfaction
In both the correlation analysis $(r = -0.662, p < 0.01)$ and the simple regression analysis $(R^2 = 0.438)$, job satisfaction showed the strongest relationship with turnover intention among the variables. Job satisfaction consists of six variables: 1) leadership and management, 2) training and promotion, 3) interpersonal relationships, 4) work environment, 5) compensation and welfare and 6) work function. Thus, it was worthwhile to examine which was the most important.
In the correlation analysis, all six variables showed moderately negative significant differences with turnover relationship. The details are shown in Supplementary Document 1.
In the multiple regression analysis of turnover intention and the six variables, leadership and management and work function demonstrated the strongest negative relationships with turnover intention $(R^2 = 0.471)$. After gradually removing the variables that showed no significant relationship, an unstandardized regression model with an $R^2$ value of 0.447 was obtained (the details are shown in Supplementary Document 1):
Supplementary document 1: Follow-up analysis of each item in "Job Satisfaction"
Table 1: Correlations Test of Six Variables And Turnover Intention
<table><tr><td colspan="2"></td><td>leadership and management</td><td>training and promotion</td><td>interpersonal relationship</td><td>work environment</td><td>compensation and welfare</td><td>work function</td><td>turnover intention</td></tr><tr><td rowspan="3">organizational commitment</td><td>Pearson correlation</td><td>-.598**</td><td>-.579**</td><td>-.443**</td><td>-.571**</td><td>-.562**</td><td>-.438**</td><td>1</td></tr><tr><td>Sig.(2-tailed)</td><td>.000</td><td>.000</td><td>.000</td><td>.000</td><td>.000</td><td>.000</td><td></td></tr><tr><td>N</td><td>141</td><td>141</td><td>141</td><td>141</td><td>141</td><td>141</td><td>141</td></tr></table>
Table 2: Multiple Regression Test of Six Variables and Organizational Commitment Abstract
<table><tr><td>Model</td><td>R</td><td>R2</td><td>Adjusted R2</td><td>Standard error</td></tr><tr><td>1</td><td>.686a</td><td>.471</td><td>.448</td><td>.86517</td></tr></table>
Table 3: Multiple Regression Test of Six Variables and Organizational Commitment Analysis of Variance
<table><tr><td colspan="2">Model</td><td>Sum of squares</td><td>df</td><td>Mean square</td><td>F</td><td>Sig.</td></tr><tr><td rowspan="3">1</td><td>Regression</td><td>89.402</td><td>6</td><td>14.900</td><td>19.907</td><td>.000</td></tr><tr><td>Residual</td><td>100.301</td><td>134</td><td>.749</td><td></td><td></td></tr><tr><td>Total</td><td>189.703</td><td>140</td><td></td><td></td><td></td></tr></table>
Table 4: Multiple Regression Test of Six Variables and Organizational Commitment Coefficient Result
<table><tr><td rowspan="2" colspan="2">Model</td><td colspan="2">Unstandardized coefficients</td><td colspan="2">Standardized coefficients</td><td rowspan="2">Sig.</td><td colspan="2">Collinear statistics</td></tr><tr><td>B</td><td>Std. Error</td><td>Beta</td><td>t</td><td>Tolerance</td><td>VIF</td></tr><tr><td rowspan="7">1</td><td>(constant)</td><td>5.964</td><td>.527</td><td></td><td>11.323</td><td>.000</td><td></td><td></td></tr><tr><td>leadership and management</td><td>-.372</td><td>.123</td><td>-.290</td><td>-3.031</td><td>.003</td><td>.431</td><td>2.321</td></tr><tr><td>training and promotion</td><td>-.219</td><td>.141</td><td>-.167</td><td>-1.551</td><td>.123</td><td>.339</td><td>2.946</td></tr><tr><td>interpersonal relationship</td><td>.058</td><td>.192</td><td>.028</td><td>.305</td><td>.761</td><td>.462</td><td>2.164</td></tr><tr><td>work environment</td><td>-.406</td><td>.132</td><td>-.268</td><td>-3.071</td><td>.003</td><td>.517</td><td>1.934</td></tr><tr><td>compensation and welfare</td><td>-.145</td><td>.113</td><td>-.124</td><td>-1.290</td><td>.199</td><td>.428</td><td>2.335</td></tr><tr><td>work function</td><td>.035</td><td>.144</td><td>.021</td><td>.243</td><td>.808</td><td>.514</td><td>1.945</td></tr></table>
Table 5: Multiple Regression Test of Leadership and Management, Compensation and Welfare, Work Function and Organizational Commitment Abstract
<table><tr><td>Model</td><td>R</td><td>R2</td><td>Adjusted R2</td><td>Standard error</td></tr><tr><td>1</td><td>.669a</td><td>.447</td><td>.439</td><td>.87164</td></tr></table>
Table 6: Multiple Regression Test of Leadership and Management, Compensation and Welfare, Work Function and Organizational Commitment Analysis of Variance
<table><tr><td colspan="2">Model</td><td>Sum of squares</td><td>df</td><td>Mean square</td><td>F</td><td>Sig.</td></tr><tr><td rowspan="3">1</td><td>Regression</td><td>84.856</td><td>2</td><td>42.428</td><td>55.844</td><td>.000b</td></tr><tr><td>Residual</td><td>104.847</td><td>138</td><td>.760</td><td></td><td></td></tr><tr><td>Total</td><td>189.703</td><td>140</td><td></td><td></td><td></td></tr></table>
Table 7: Multiple Regression Test of Leadership and Management, Compensation and Welfare, Work Function and Organizational Commitment Coefficient Result
<table><tr><td rowspan="2" colspan="2">Model</td><td colspan="2">Unstandardized coefficients</td><td colspan="2">Standardized coefficient</td><td rowspan="2">Sig.</td><td colspan="2">Collinear statistics</td></tr><tr><td>B</td><td>Std. Error</td><td>Beta</td><td>t</td><td>Tolerance</td><td>VIF</td></tr><tr><td rowspan="3">1</td><td>(constant)</td><td>6.199</td><td>.355</td><td></td><td>17.450</td><td>.000</td><td></td><td></td></tr><tr><td>leadership and management</td><td>-.527</td><td>.096</td><td>-.411</td><td>-5.502</td><td>.000</td><td>.718</td><td>1.393</td></tr><tr><td>work function</td><td>-.534</td><td>.113</td><td>-.353</td><td>-4.723</td><td>.000</td><td>.718</td><td>1.393</td></tr></table>
Turnover intention = 6.199 + -0.527 x (leadership and -0.534 work functions
## IV. DISCUSSION
The correlation and regression analyses showed that job satisfaction, work stress and organizational commitment were statistically related to turnover intention. Specifically, job satisfaction and organizational commitment demonstrated negative relationships with turnover intention and work stress demonstrated a positive relationship with turnover intention. This is consistent with logical expectations and
findings from other industry research (Salleh, et al., 2012).
### a) Job satisfaction
The correlation and regression analyses showed that job satisfaction had a significantly negative relationship with turnover intention. The correlation intensity and the rationale in the regression were moderate. In the follow-up analysis, all of the constituent variables of job satisfaction demonstrated significantly negative relationships with turnover intention. Leadership and management and work function under job satisfaction were the most closely related domains to the turnover intention.
In this regard, CM institutions should frequently review their leadership, management style and system. They should listen more to employees' demands and regularly review CMP management. They should also regularly refer to the standards of other industries and other medicine-related professions. Instead of following the traditional authoritarian leadership style, leaders should consider using the participative and even delegative management styles. Organizational justices in different management areas should also be reviewed.
### b) Work stress
The correlation and regression analyses showed that work stress had a significantly positive relationship with turnover intention. However, neither of the analyses yielded strong results. This suggests that despite the clear negative relationship between the two, the degree of interpretation, $R^2 = 0.094$, between them is not strong. Although this result seems inconsistent with some general research (Labrague et al., 2018), medical staff, including CMPs, generally have a stronger ability to resist stress than people in other industries. Thus, work stress may not explain the turnover intention of CMPs.
Stress can be both motivating and hindering. CM management should focus on dealing with hindering stressors (e.g., by accommodating individuals' family-work role conflicts, relaxing unreasonable deadlines and reducing unnecessary administrative works, etc.). Given the consistently significant negative relationship between work stress and turnover intention, CM institutions must still properly evaluate their employees' degree of work stress. Doing so may prevent high levels of work stress from combining with other factors and becoming a strong influence.
### c) Organizational commitment
The correlation and regression analyses showed that organizational commitment had a significantly negative relationship with turnover intention. Similar to the results for job satisfaction, the correlation intensity and the rationale in the regression were moderate. It is common for employees to be more willing to work in unfavorable situations if they are highly committed to their company.
Hence, CM institutions should improve the organizational commitment of their staff members in different ways (e.g., by providing a reasonable and friendly working environment with regular organizational gatherings and developing an inclusive environment among different groups of employees/practitioners, etc.).
### d) Multiple effects
Separately examining the correlation analysis and regression analysis results for the relationships of job satisfaction, work stress and organizational commitment with turnover intention yielded results did not strongly explain CMPs' turnover tendency. All of the variables were moderately correlated with turnover intention, but their respective degrees of regression interpretation were weak, where $R^2$ of each variable were low in table 4. However, considering the three variables comprehensively via multiple regression analyses allowed for better interpretations to be made.
To reduce CMP turnover, the CM industry should consider all three aspects at the same time. Specifically, measures should be taken to 1) improve the job satisfaction of CMPs, 2) reduce the pressure on CMPs and 3) improve the organizational commitment of CMPs.
### e) Limitations
Selection bias could be the biggest limitation of this trial. Over $70\%$ of the respondents indicated that they were general CMPs, and most of them worked 40 to 49 hours per week. These findings are similar to those of a CM survey conducted by the HKSAR government (Department of Health, 2012). However, most of this study's respondents were women, in contrast to the male majority $(67.6\%)$ in the government's CMP survey (Department of Health, 2012). The majority of this study's respondents were under 40 years old, greatly different from the average CMP age of 58 years old in Hong Kong (Department of Health, 2012). Although this may suggest that the number of women in the young generation of CMPs is higher, it also showed there might have a selection bias on the included sample.
Also, over $60\%$ of the CMPs who participated in this study's questionnaire held a Master's degree or above, and only $46.1\%$ of them worked in the private sector. These findings are inconsistent with those reported in the HKSAR government's CMP survey, which indicates that less than $30\%$ of CMPs hold Master's qualifications, and $88.2\%$ work in the private sector. Nevertheless, although these results may suggest a possible selection bias during sampling, they may also indicate that the academic qualifications of CMPs have increased and that the working institutions have become
- more diverse (Legislative Council Health Affairs Committee, 2018).
- The respondents in this study were mostly young and had relatively short tenures as CMPs. Of the respondents, none were listed CMPs, and only one was a limited registered CMP. Senior CMPs may be less likely to participate in the study due to the online questionnaire setting. As age and tenure may cause some differences in the turnover behaviors and tendencies of employees, this study's results may not fully reflect the situation of all CMPs in Hong Kong. Furthermore, the questionnaires were mainly distributed to CM stakeholder organizations. However, most of the listed CMPs and limited registered CMPs were relatively independent individuals who were seldom involved in such organizations. Therefore, future research should consider how to increase the inclusion of older CMPs and other kinds of CMPs (e. g., by mailing physical questionnaires, completing personal interview questionnaires or conducting telephone interviews).
- Lastly, cross-sectional approach, instead of longitudinal approach, was used in this research. Although it is easy to compare the variables at a single time point, this approach only shows the correlations but not the causations among the variables. It is suggested that in future research, the longitudinal approach should be adopted.
#### Future research direction
There may be different interpretations for our findings, one being that CMPs leave their present organizations and join other organizations in the Chinese Medicine industry while the other being that CMPs leave the Chinese Medicine industry. The former is at organization-level while the latter is at industry-level. The present study does not address this difference in turnover which should be taken into consideration in conducting future research as they in fact carry different implications.
## V. CONCLUSION
The job satisfaction, work stress and organizational commitment of Hong Kong CMPs were significantly related to their turnover intention. Specifically, turnover intention was negatively related to both job satisfaction and organizational commitment but positively related to work stress. In addition, interactions were observed between various variables. Thus, to reduce CMPs turnover, CM industry should take all factors into consideration.
## ACKNOWLEDGMENTS
This study is part of the first author's, Tony Ka-Kit Chua, thesis for the Master of Business Administration, Wrexham Glyndwr, United Kingdom. The authors would like to thank Dr. Wing-Yan Lee from Sin-Hua Herbalist's & Herb Dealer's Promotion Society Limited and Dr. Chun-Pong Lam from the Alumni
Association of Full-time Chinese Medicine Undergraduates, Hong Kong Baptist University, for their assistance with the questionnaire distribution. Also, thanks go to Asia Edit for their editing efforts.
Authors' contributions
All authors contributed to the study conception and design. Material preparation, data collection and analysis were performed by Ka-Kit Chua. The first draft of the manuscript was written by Ka-Kit Chua and all authors commented on previous versions of the manuscript. All authors read and approved the final manuscript.
Data Availability Statement
The datasets generated during and/or analysed during the current study are available from the corresponding author on reasonable request.
Generating HTML Viewer...
References
7 Cites in Article
J Aderibigbe,T Mjoli (2018). Psychological capital as a moderator in the relationship between occupational stress and organisational citizenship behaviour among Nigerian graduate employees.
(2012). China, Hong Kong SAR.
Samuel Green (1991). How Many Subjects Does It Take To Do A Regression Analysis.
No ethics committee approval was required for this article type.
Data Availability
Not applicable for this article.
How to Cite This Article
Ka-Kit Chua. 2026. \u201cRelationship between Job Satisfaction, Work Stress, Organizational Commitment and Turnover Intention of Chinese Medicine Practitioners in Hong Kong\u201d. Global Journal of Medical Research - A: Neurology & Nervous System GJMR-A Volume 23 (GJMR Volume 23 Issue A2).
Explore published articles in an immersive Augmented Reality environment. Our platform converts research papers into interactive 3D books, allowing readers to view and interact with content using AR and VR compatible devices.
Your published article is automatically converted into a realistic 3D book. Flip through pages and read research papers in a more engaging and interactive format.
Our website is actively being updated, and changes may occur frequently. Please clear your browser cache if needed. For feedback or error reporting, please email [email protected]
Thank you for connecting with us. We will respond to you shortly.