The fast-evolving scenario of the global economy of the past few decades has contributed to the transformation of cities into prime economic hubs providing sustenance for the growing urban populace. In keeping pace with economic development and subsequent demand for shelter, cities are densifying through vertical expansion to avoid urban sprawl. Given the rapid urbanization along with the scarcity of developable urban land, open spaces have become a highly contested commodity, particularly in the residential of the Dhaka megacity. Driven by the profit-maximizing agenda of the developers the ongoing process of residential densification is exacerbating the situation. Urban densification of Dhaka is faced with the challenge in keeping the residential areas sustainable and environmentally friendly. This study attempts to investigate the impact of the densification process on the spatial quality of the residential built environment of Dhaka through the lens of environmental sustainability. The explorative research was conducted through a questionnaire survey, informal interviews, and field survey across seven residential areas of Dhaka undergoing the densification process.
## I. INTRODUCTION
Dhaka, the capital city of Bangladesh witnessed a rapid population growth in the postindependence period mostly due to the high rate of rural migration. Since then, the continuing steady growth of population has contributed to making Dhaka one of the most densely populated cities of the world in the following decades. According to the report of World Population Review 2022, Dhaka ranked the sixth most populous city of the world with a density of 23,234 people per square kilometer within a total area of 300 square kilometers. Given the limited land resource, urban densification was adopted as a key solution to face the challenge of habitat crisis for the growing population of Dhaka. Over the past decades, urban residential areas have undergone densification through vertical and to a lesser extent horizontal expansion claiming most of the vacant land of the city. The reservation of open space for the provision of green infrastructure is severely ignored in the development process due to the vague planning guidelines, lack of public awareness, and the vested interest of the landowners and property developers for profit maximization. UNEP recommends that cities should dedicate at least $25\%$ of their total area to green spaces to promote healthy living. According to the Dhaka Metropolitan Development Plan (DMDP 1995), Dhaka comprises of $17\%$ open space of which Old Dhaka has only $5\%$ and New Dhaka has $12\%$ respectively. A study by Dewan and Yamaguchi (2009) indicated the alarming decline in urban green space of Dhaka city where vegetation coverage decreased from $15\%$ in 1975 to $9.6\%$ in 2003. The green spaces further reduced from $19.97\%$ in 1989 to $8.53\%$ in 2009 (Ahmed et al., 2013). The increase in the built up areas accounted for a substantial loss in green space (around $20\%$ ) from 1975 to 2005 (Byomkesh et al., 2012). Green open space is broadly defined as any "green space", "public open space", or "park" in an urban setting. Despite the subtle qualitative differences between these terminologies, the terms have been used synonymously for the purpose of this study. Numerous studies have shown that green space is associated with a large number of environmental, social and health benefits. Integration of urban green space with the built environment has proven to boost up the physical and mental health of the city residents by facilitating physical exercise and reduce stress respectively by providing a respite from the claustrophobia and crowdedness of the city (Macintyre et al., 2008; Mytonn et al., 2012; Haq, 2011). In addition to the recreational facilities, open spaces also help to create a sense of community in a city by providing social spaces where people can gather and interact with others (Lo et al., 2010; Seaman et al., 2010). From the perspective of environmental benefits green space counteracts the urban heat island effect, reduces energy cost of cooling buildings, minimizes air, water, and noise pollution (Haq, 2011; Strohbach, et al., 2012). To ensure healthy living the World Health
Organization (WHO) has set the minimum standard of 9 sq. meter green space per city dweller whereas Dhaka offers less than 0.5 square meter per person (DMDP 1995). Consequently, city dwellers are deprived of the physical and mental health benefits accrued from reconnecting with nature through the inclusion of an array of diversified urban open spaces in terms of their scale and function. This compromising situation has put the environmental sustainability of the residential areas of Dhaka under question. However, to understand the impact of densification from the residents' perspective, the way urban density is conceptualized needs to be clarified. The concept of 'density' in urban planning can be defined through its physical and psychological dimensions denoted by the terms "physical density" and "perceived density" respectively. Physical density is a numerical measure of the concentration of individuals or physical structures within a given geographical unit (Cheng, 2009). On the other hand, perceived density is the subjective measurement of density identified by the residents' perception of their neighborhood in terms of space between buildings. In this study the physical density is measured by the parameter of ward-wise 'gross residential density' as the 'net residential density' data of study areas were not readily available while two parameters i.e., 'perceived neighbourhood density' and 'perceived density within the dwelling' were selected to study the notion of perceived density. This paper attempts to investigate the impact on the environmental sustainability of the residential neighborhoods undergoing the densification operation and further examines the relationship between the parameters of density (physical and perceived) and various environmental aspects of sustainability.
## II. METHODOLOGY
The study is explorative research. For conducting the study residential areas with varied densities across seven locations in Dhaka were selected. Among these study areas, two (Luxmi Bazar and Wari) are from Old Dhaka the rest of the five are from New Dhaka (Dhanmondi, Banani, Gulshan, Mirpur, and Uttara).
The study areas were selected based on their location, density, layout pattern and age of the settlements. Wari and Luxmi Bazaar are the oldest settlements with medium and high gross population density respectively and are situated in the Old city core. Dhanmondi, Banani and Gulshan are relatively newer settlements and are in the central part while Pallabi and Uttara were more recent developments and lie along the remote part of the city. Dhanmondi, Banani and Gulshan are characterized by low gross population density while the density of Pallabi is regarded medium (DAP 2010). The older residential area like Luxmi Bazaar has an organic road network pattern while the newer settlements have grid iron pattern (Dhanmondi, Banani, Gulshan and Uttara). However, Pallabi has a mixed type of road network system. Based on their location and density these sample study areas provide a virtual slice through the city and therefore are representative of the city's overall trend of densification. Primary data was collected through a random sampling household questionnaire survey, informal interviews, and extensive field survey. The questionnaire was structured to gain an insight into the residents' perception regarding the prevailing density and the selected environmental aspects which were corroborated by responses from the informal qualitative interviews with the residents. A total of 1623 responses out of a sample size of 1842 households were gathered. The questionnaire survey was conducted from March 2015 to May 2015. An extensive field survey was undertaken to gather spatial information regarding the quality, typology, and usage of the neighbourhood open spaces and the built environment. Secondary data was obtained from various published literature and relevant government records (density profiles, plans of the study areas, planning documents) were collected from municipal regulatory bodies (RAJUK, PWD, Dhaka North, and South City Corporations). The analysis was done in two phases. Firstly, the primary data collected related to the four selected environmental aspects namely, access to open space, sense of acoustic and visual privacy, access to daylight, and overall living condition of the built environment were analyzed using SPSS and Microsoft Excel and presented in the form of tables and charts. Secondly, to assess the impact of density (physical and perceived) on environmental sustainability, a Pearson's correlation analysis was carried out in the second phase. Due to the lack of ready data, the Gross population density of study areas has been selected for assessing the physical density attributes. Perceived density is evaluated through two parameters: perception of neighborhood density and perception of dwelling density. Findings are then interpreted and discussed in light of theoretical literature on tensions between densification and environmental sustainability to provide an insight into the consequences of the ongoing densification operation in the residential areas of Dhaka that might assist in the formulation of a site and context-appropriate density standards and effective densification policies for future development.
## III. ASPECTS OF ENVIRONMENTAL SUSTAINABILITY
The environmental sustainability of the study areas is studied in terms of four aspects: accessibility to open space, access to daylight, environmental protection, and satisfaction with the livability condition which are discussed in the following:
### a) Accessibility to open space
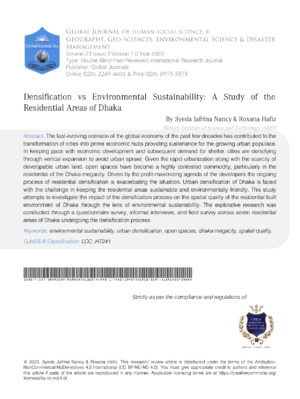
According to Gallion (1963) neighborhood open spaces function as outdoor living rooms offering various recreational facilities as well as breathing space for people where they can take a break free from the monotony of urban life and relax. Cities can have a wide variety of open spaces such as parks, plazas, squares, playgrounds, botanical gardens, zoological gardens, and green belts that provide passive as well as active recreational facilities. Urban open spaces should be accessible to the public and remain open for at least 16 hours a day, and 7 days a week. Dhaka in general has a lack of open spaces where people can retreat and socialize. The standard suggested for Dhaka city in Dhaka Metropolitan Development Plan (DMDP 1995), is an average of at least 0.052 square meters for parks and 0.5 square meters for open green spaces per person. The recommendations of the World Health Organisation (WHO) and Leadership in Energy Environmental are 9 and 20 square meters receptively for neighborhood design. In comparison with the global practice, the standards recommended in DMDP for open space are far below the practiced standards of any megacity.
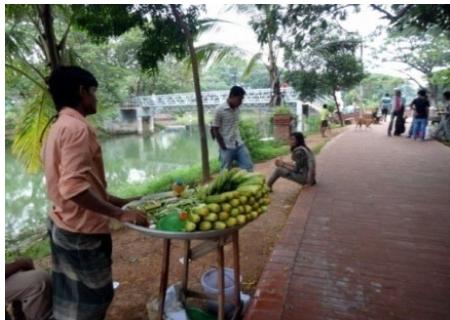
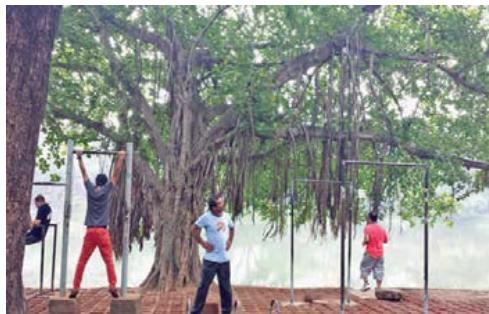 Fig. 1: Dhanmondi lakeside park Fig. 2: Residents exercising in outdoor open space, Dhanmondi
Table 1: Types of open space available in the neighborhood
<table><tr><td colspan="6">Types of open space available in the neighborhood</td></tr><tr><td>Location</td><td>For Sitting</td><td>Social interaction</td><td>Park</td><td>Playground</td><td>Other Open Spaces</td></tr><tr><td>Wari</td><td>-</td><td>-</td><td>-</td><td>-</td><td>v</td></tr><tr><td>Luxmi Bazaar</td><td>-</td><td>-</td><td>-</td><td>-</td><td>v</td></tr><tr><td>Dhanmondi</td><td>v</td><td>-</td><td>-</td><td>v</td><td>v</td></tr><tr><td>Banani</td><td>-</td><td>-</td><td>v</td><td>v</td><td>v</td></tr><tr><td>Gulshan</td><td>v</td><td>-</td><td>v</td><td>-</td><td>v</td></tr><tr><td>Pallabi</td><td>-</td><td>-</td><td>-</td><td>v</td><td>-</td></tr><tr><td>Uttara</td><td>v</td><td>-</td><td>v</td><td>v</td><td>v</td></tr></table>
Source:Field Survey,2015
Healthy leisure activities in open spaces keep youngsters engaged and prevent them from getting derailed. "The 1950s were marked by a major campaign against juvenile delinquency, and advocates of recreational open space often claimed that access to nature would help to ensure the healthy social development of children" (Rome, 1998). According to DMDP, 650 sq. m. of park or open space should be provided for 1000 people (DMDP, 1997b; pp - 14). The Urban Area Plan of DMDP recommends a general space requirement of 4 acres/25000 persons for parks while no space standards have been suggested for other typologies of open spaces. The open spaces available in the study areas are mostly parks and playgrounds (Table 1). Pallabi has only two playgrounds and no parks for the community. Access to these playgrounds is restricted and generally used for tournaments and practice grounds of various sports clubs. The playgrounds are also occasionally rented for organizing various musical concerts. Field survey revealed that the dense residential areas of old Dhaka (Luxmi Bazaar and Wari) have no open spaces at all. The only parks available in Wari and Luxmi Bazaar are Baldah Garden and Bahadur Shah Park respectively which are part of the national heritage with controlled access and are visited by the residents occasionally. Therefore, they cannot meet the demand for neighborhood open spaces in terms of scale and number. Earlier the absence of public open spaces in the planned residential area of Wari was not felt because according to the original master plan of the area, the plot sizes of each house were quite large leaving ample space within the perimeter serving as an outdoor play area for children. But later with the subsequent subdivisions of the plots, these domestic open spaces ceased to exist. In addition, the old houses of Luxmi Bazar and Wari were low-rise structures with introverted courtyards serving as open spaces for the
residents. This could be one of the reasons for not considering the inclusion of community open spaces in the initial plan of these older settlements. The types of open spaces found at Dhanmondi, Gulshan, Banani, and Uttara are a couple of parks, playgrounds, and lakeside development. But except for Dhanmondi, the major portion of the lakeside of Gulshan, Banani, and Uttara are not properly designed for public use, therefore remain unutilized. The serpentine lakeside park of Dhanmondi was developed for the inhabitants but now many access points of the lakeside have been closed to keep the drug addicts and vendors at bay.
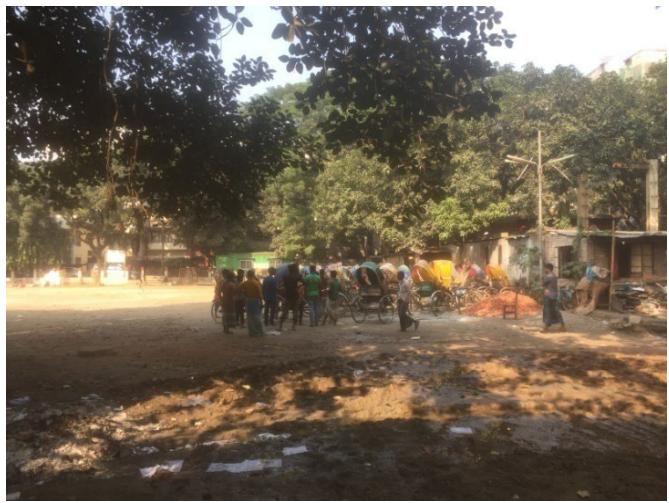 Figure 3: Rickshaw stand inside the park, Banani
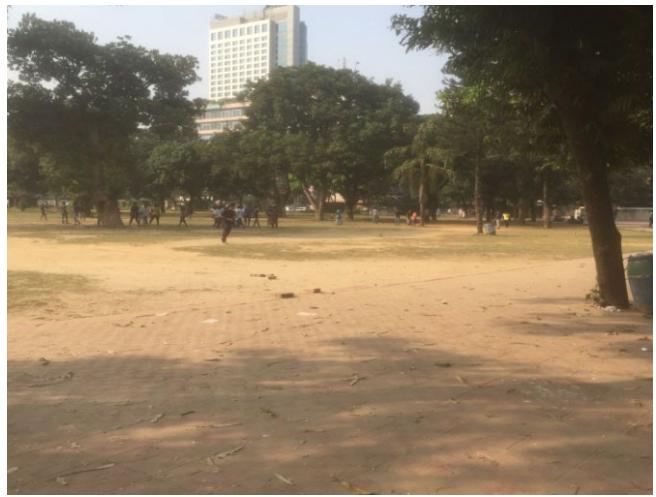 Figure 4: Gulshan park maintained but lacks visual appeal.
Being under the illegal control of various sports clubs, the existing playgrounds remain inaccessible to the general public most of the time. The 5 parks in Uttara serve only a small portion of the residents who reside within the perimeter of 500 meters to 1 kilometer around these places. In the initial master plan of Uttara $47\%$ of the land area was designated for civic and open spaces but to accommodate more area for residential use open spaces were compromised. The primary threat to the existing public open spaces is their encroachment by public and private enterprises. The example of this practice is evident in the case of Uttara Sector 1 park which had been sold out to private developers by the authority (Nilufar, 2001). Moreover, illegal encroachment of the lakeside and canals continues in form of claiming the land by building tin-shaded mosques and other semi-permanent structures in the newly developing sectors of Uttara. The parks and playgrounds that can be reached by walking and do not require any vehicular road crossing were found to be preferred by the residents. While residents residing beyond the 1/4-mile radius of a park do not frequent these places and usually use rickshaws or cars to get there which takes about 10-20 minutes depending on the traffic situation (Chart 1). However, it takes around 11-20 minutes to reach the nearest park and playground in most of the study areas as the survey findings indicate.
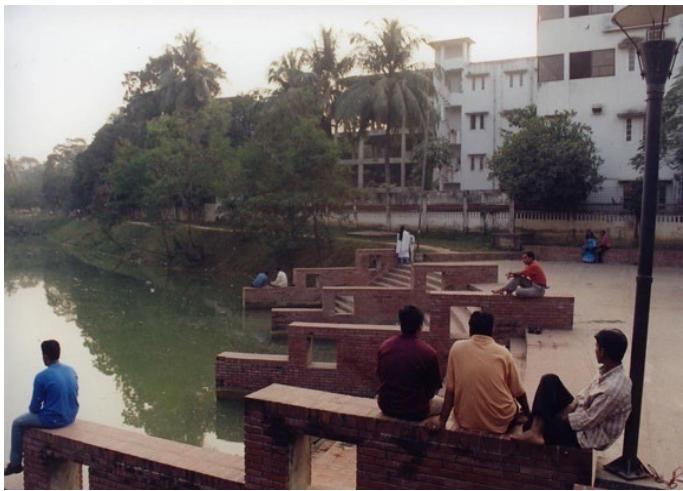 Figure 5: Lakeside sitting arrangement, Dhanmondi
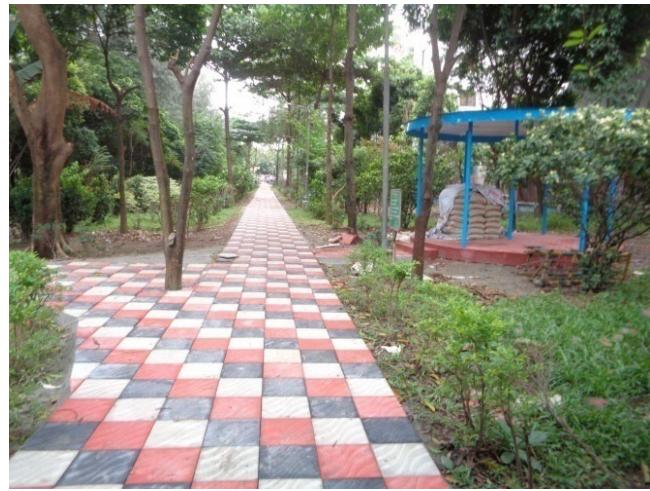 Figure 6: Properly maintained park, Uttara
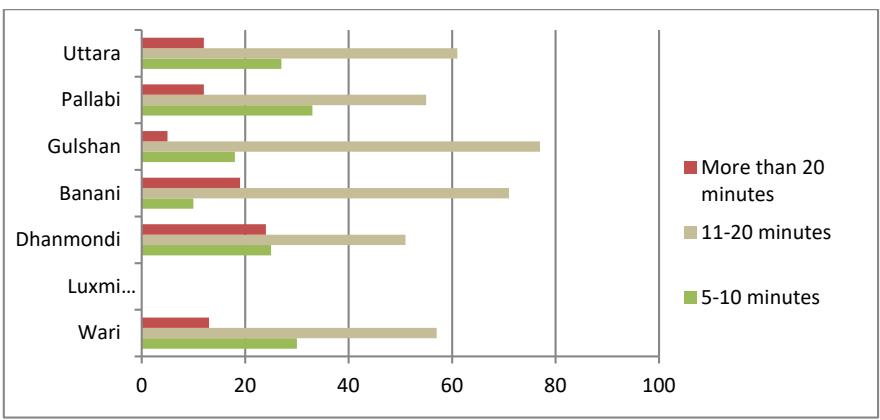 Chart 1: Required time to reach the nearby park or playground (residents' responses) (Percentage) The percentage is based on the number of responses. Source:Field Survey,2015 In Uttara, due to improper maintenance and uncleanliness, it is found that in some areas residents avoid going to their designated sector park and prefer to go to the next nearest neighborhood park. If the park is beyond walking distance, residents usually take rickshaws, and the travel time depends on the route they take. These open spaces are mainly used by teenagers,
middle-aged male and female residents, and children. Most of the parks lack adequate lighting, park furniture, and shaded pavilions to take shelter from rain and sun. Most access roads of these parks lack crossing aids such as zebra crossing, speed bumper, and speed limit signboards.
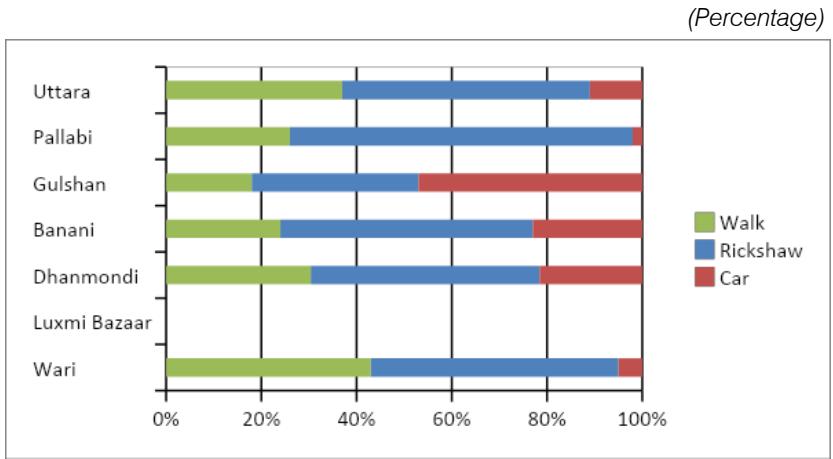 Chart 2: Mode of transport to reach the nearby park or playground (residents' responses) The percentage is based on the number of responses. Source:Field Survey,2015
The total existing open spaces of the study areas of new Dhaka are far below the standard prescribed in DAP and DMDP. Even the prescribed standard, which is 0.052-0.5 acres of open space for 1000 population is also much lower than the international standards practiced in other Megacities of the world. Due to the shortfall of open spaces, youngsters are found gathering in the tea stalls at the street corners and the entry plazas of the neighborhood shopping malls of the residential areas of new Dhaka. The elderly residents use the lakeside trail for a morning walk. The children and women are the most deprived ones as an acute shortage of playgrounds prevails across the study areas. In response to the lack of adequate open spaces, building premises, rooftops, and nearby access roads are increasingly chosen as alternative outdoor play spaces for children (Table 2). Even the existing accessible playgrounds are not frequently used by the children as $93.8\%$ of the parents reported not sending their kids out there due to the lack of passive surveillance opportunities (Field survey, 2015). Another reason is the fear of accidents as reaching the playgrounds requires the crossing of one or two intersections of vehicular roads. The recent trend of refurbishing an entire apartment as a kids' play zone has proved to be a profitable private business in areas like Dhanmondi and Uttara which highlights the desperate need for quality and secured playgrounds for the neighborhood children.
Table 2: Percentage of children using various outdoor spaces for playing
<table><tr><td>Age</td><td>Inside the building premise</td><td>On the roof</td><td>In the neighborhood playground</td><td>On the nearby road</td><td>Others</td></tr><tr><td>Below 5 years</td><td>-</td><td>11</td><td>4</td><td>-</td><td>83</td></tr><tr><td>5 - 10 years</td><td>65</td><td>9</td><td>12</td><td>21</td><td>-</td></tr><tr><td>11-16 years</td><td>15</td><td>2</td><td>11</td><td>14</td><td>-</td></tr><tr><td>16 – 18 years</td><td>3</td><td>-</td><td>10</td><td>15</td><td>-</td></tr></table>
The percentage is based on the number of responses.
Source:Field Survey,2015
Around $78.2\%$ of inhabitants of the study areas reported not being engaged in any kind of physical exercise. Only $21.8\%$ reported taking part in physical activities among which a significant percentage were elderly people both male and female. A majority of the residents avoiding the neighborhood open space for physical exercise complained of not having appropriate open space in terms of size and quality for jogging or other activities. In Dhanmondi, $34\%$ of the respondents complained about the uneasiness caused by the presence of too many outsiders in places like Rabindra Shorobor and lakeside recreational areas (Table 3). According to $22\%$ of respondents of Uttara, the presence of drug addicts and drug peddlers inhibits them from using the nearby parks and other open spaces.
Table 3: Residents' responses regarding not using the neighborhood open spaces for exercise.
<table><tr><td>Location</td><td>Lack of appropriate open space</td><td>Fear of snatch theft</td><td>Too many outsiders</td><td>Eve Teasing</td><td>Presence of drug addicts and drug peddlers</td></tr><tr><td>Uttara</td><td>63</td><td>11</td><td>3</td><td>1</td><td>22</td></tr><tr><td>Mirpur</td><td>67</td><td>8</td><td>3</td><td>5</td><td>12</td></tr><tr><td>Dhanmondi</td><td>37</td><td>12</td><td>34</td><td>8</td><td>9</td></tr><tr><td>Banani</td><td>53</td><td>18</td><td>21</td><td>4</td><td>4</td></tr><tr><td>Gulshan</td><td>58</td><td>18</td><td>13</td><td>3</td><td>8</td></tr><tr><td>Wari</td><td>100</td><td>-</td><td>-</td><td>-</td><td>-</td></tr><tr><td>Luxmi Bazaar</td><td>100</td><td>-</td><td>-</td><td>-</td><td>-</td></tr></table>
Source:Field survey,2015
### b) Access to daylight
The survey revealed that the rooms of the dwellings which are devoid of adequate daylight usually have window facades overshadowed by adjacent high-rise structures. As a result, the incident angle of solar radiation cannot provide the desired amount of ambient light in the interior rooms. Therefore, these rooms require artificial light sources to get properly illuminated. This situation is commonplace, particularly in building blocks located in the second and third row from the road front. The obstruction of proper solar access is not limited only to service spaces but also habitable spaces such as living rooms, dining, and bedrooms. But interestingly on average, $86\%$ of the inhabitants do not have a serious complaint about it. This might be partly because most of the households remain vacant during the daytime as most of the inhabitants comprise of working couples, students, or service holders who spend the better half of the day away from home. The households are, therefore, occupied by the housemaids or senior citizens during the daytime who are generally found not very bothered by this.
### c) Sense of Privacy
The closely packed building layout of the study areas is found to cause noticeable visual obstruction and auditory intrusion to the residents. Hence, both acoustic privacy and visual privacy have been considered to examine the sense of privacy in residential areas.
Acoustic Privacy
Chart 3: Respondents' opinion regarding noise pollution in the neighborhood
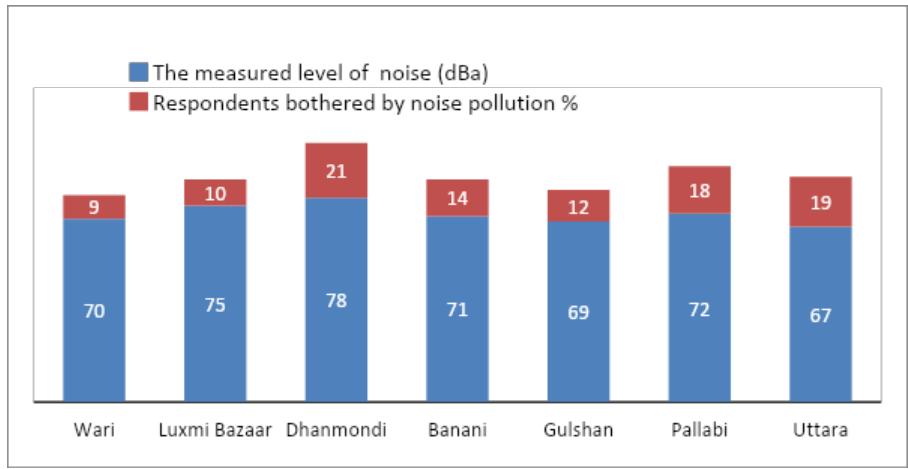 The percentage is based on the number of responses. Source:Field Survey,2015
According to the Environmental Protection Agency (EPA) in the United States of America, a 24-hour exposure level of 70 decibels is the highest allowable level of environmental noise for all areas which will prevent any measurable hearing loss over a lifetime. Noise crossing this threshold may cause various health problems like hearing problems, hypertension, heart disease, etc. However, the Department of Environment, of Bangladesh has set the standard for allowable noise levels even lower i.e., for residential areas 50 dBa and mixed-use areas 60 dBa respectively. The field survey indicates the average daytime noise level of the study areas was found to be exceeding the prescribed level shown in Chart 4. But interestingly on average only $9\%$ and $12\%$ of the residents of the study areas of Old Dhaka and New Dhaka respectively complained about noise pollution. Among the respondents bothered about the noise issue, around $65\%$ of the New Dhaka respondents were found disturbed by the auditory intrusion caused by the non-residential uses, particularly by the peak hour traffic of nearby schools, colleges, and universities. Apart from this around $10\%$ of the dwellers of street-facing apartments report the noise generated from the traffic of the adjacent streets as very annoying.
Other sources of noise mentioned by the residents were the noise generated from the construction work undergoing in the nearby plots and the noise of the generators during load shading. The traffic generated noise least concerned the residents of Old Dhaka, rather they identified the noise of generators and construction works to be most disturbing. Though the close spacing of the buildings allows a significant portion of the dwellers to overhear their neighbors' conservation, most of them did not consider auditory privacy as a big issue.
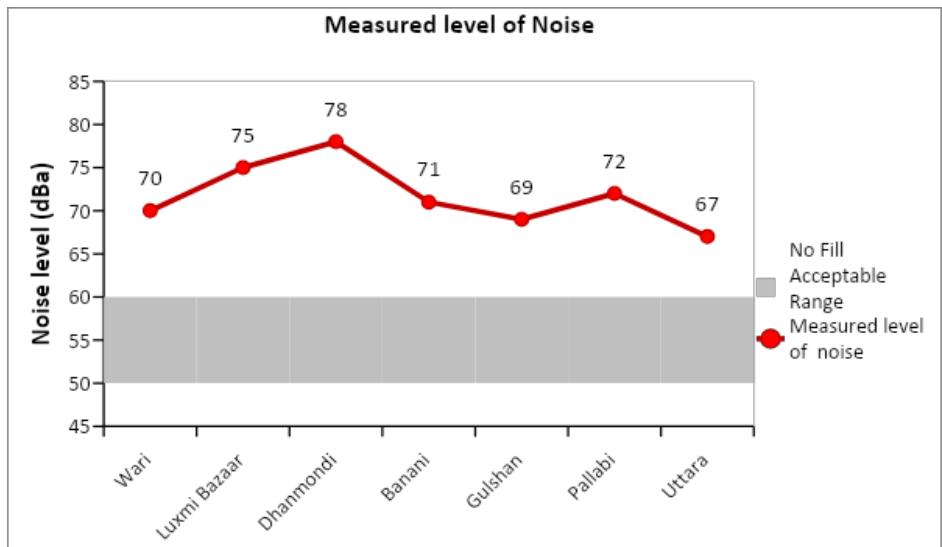 Chart 4: The measured and acceptable range of noise in the study residential areas Source:Field Survey,2015
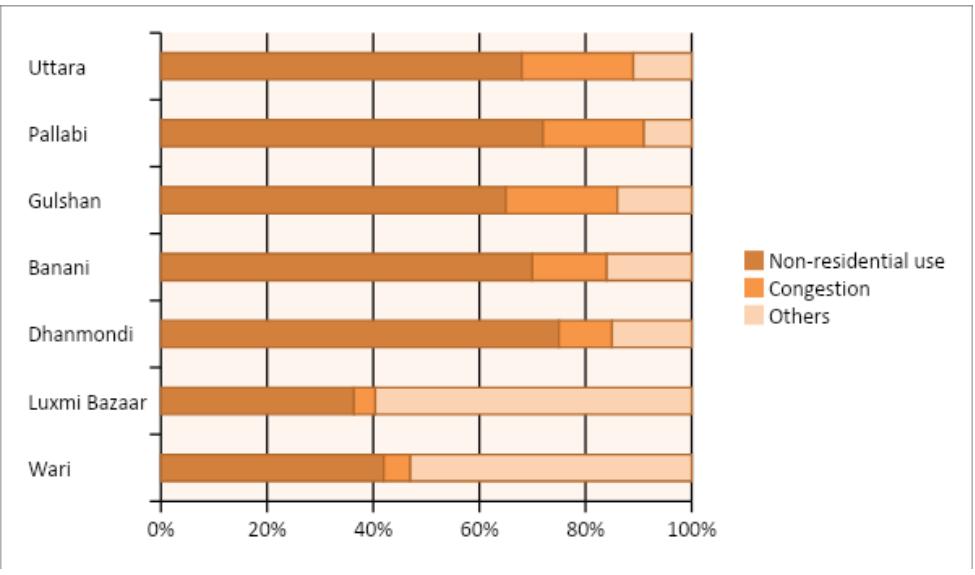 Chart 5: Respondents' opinions about the sources of noise in the neighborhood The percentage is based on the number of responses. Source:Field Survey,2015
Visual Privacy
An interesting observation was found regarding visual privacy in the study areas. The aspect of visual privacy was examined through the parameters of visual obstruction and access to daylight (Charts 6 & 7).
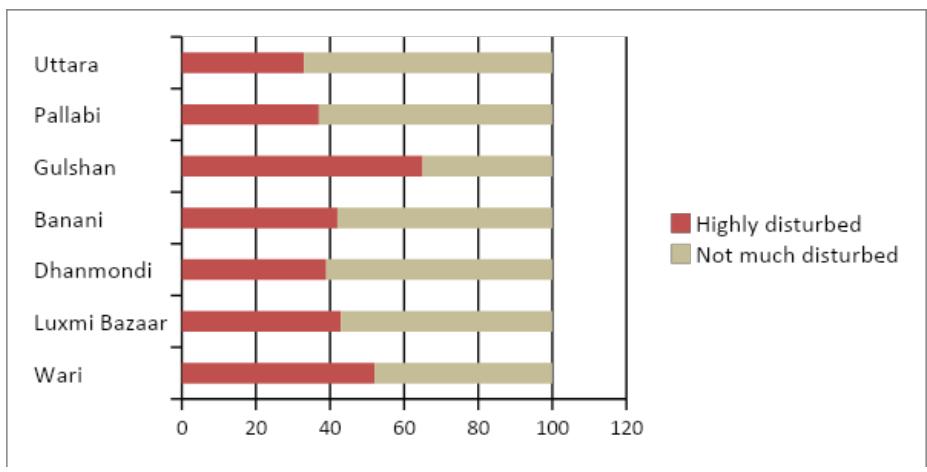 Chart 6: Respondents' perception of visual obstruction The percentage is based on the number of responses. Source:Field Survey,2015
Both visual obstruction and access to daylight are interrelated issues and show a negative relationship between them as most of the participants were found to be least bothered about the deprivation of daylight and view (Chart 7).
Chart 7: Percentage of households having inadequate daylight and percentage of highly disturbed residents due to inadequate daylight.
 Residents' perception towards access to daylight Households with inadequate daylight% Highly disturbed% Not much disturbed% Source:Field survey,2015
Around $90\%$ of buildings in Wari and Old Dhaka are so closely packed that visual intrusion of privacy and visual obstruction are commonplace to the residents but most of the respondents displayed a surprisingly unexpected degree of adaptability towards the situation and hardly acknowledge it as a problem from their perspective. This notion of indifference was more prevalent in the responses of the newly migrated people particularly the tenants and newly built apartment owners of Old Dhaka. Part of this desensitized attitude towards privacy concerns might be due to the cultural and educational background of these migrants. Most of these migrants are less educated rural people employed in small businesses and petty jobs. They naturally tend to be less sensitive toward the quality of the living environment and are somehow also overwhelmed by the sudden transition from a rural to an urban living pattern. Therefore, they do not feel much troubled by these issues. But on the other hand, many original inhabitants have expressed their resentment regarding the issue of privacy, as a housewife who has been living in Wari since her childhood commented:
"I have been living in this area since my childhood in our 3-story high ancestral house. Earlier we had two-storied buildings in the adjacent plots but now they are replaced by 10 and 8-story buildings which are mostly rented to the newcomers. The windows of the flat of the adjacent buildings are so close to my verandah that when someone spits out the chewed paan (Betel leaf) from the window it sometimes reaches my verandah and often splatters over the wet clothes hanging on the drying rail, which is very annoying. I cannot use the roof for drying clothes either as most of the migrant people living in the upper stories lack civic sense and frequently throw garbage on my rooftop. My young girls need to keep the windows of their rooms drawn with curtains most of the time to maintain the visual privacy from the apartment of the adjacent building next to their windows." (Interview with a resident of Wari, November 2015)
"Our family has been living in Luxmi Bazaar for over 3 decades. Our 3 storied house used to be the highest in this lane. We could see the rooftops of other houses from our windows and enjoyed the gust of wind. But now the neighbors had built high-rise buildings on both sides of our plot. We do not have the views anymore and lack airflow too. Furthermore, one of their bathrooms faces our kitchen which is the most irritating thing." (Interview with a resident of Luxmi Bazaar, November 2015)
Interestingly both the original and migrant residents of New Dhaka residential areas have displayed a high level of acceptance regarding the lack of visual access. Studies have shown that visual obstruction experienced by the inhabitants of densely built environments through blocking the eye from looking far away eventually causes myopic vision deficiency. In general, there is a lack of concern among the residents about issues like the implicit ill effects of visual obstruction, the paucity of daylight, and noise pollution of an unacceptable level.
### d) Satisfaction level of privacy
Despite living in such closely-knit dwellings, the residents of Luxmi Bazaar have shown the highest degree of $(70\%)$ satisfaction regarding privacy while Wari takes the second place (Chart 8). The higher incidence of satisfaction could be attributed to the prolonged stay in the neighborhood and the consequential social cohesion resulting from that. Among the residential areas of New Dhaka, Uttara ranks first while Gulshan and Pallabi are second and third respectively in terms of satisfaction. The lack of awareness, relatively lower density and similar social status could be the reason for the rise in satisfaction levels. On the other hand, the residents of Banani and Dhanmondi expressed moderate satisfaction. Only a quartile (19% and 26%) of them were found dissatisfied with the prevailing privacy. When asked about the reason most of them have reported the hampering of privacy caused by the regular incoming of commuters to these areas for work, education, and shopping. Besides,
the original landowners have their privacy concern from the growing number of new tenants and apartment owners in these areas. The percentage of dissatisfaction found in the rest of the study areas is statistically insignificant. Overall, the level of privacy seems to be acceptable in most of the residential areas, both planned and unplanned, except in some portions where there is a greater concentration of commercial activities.
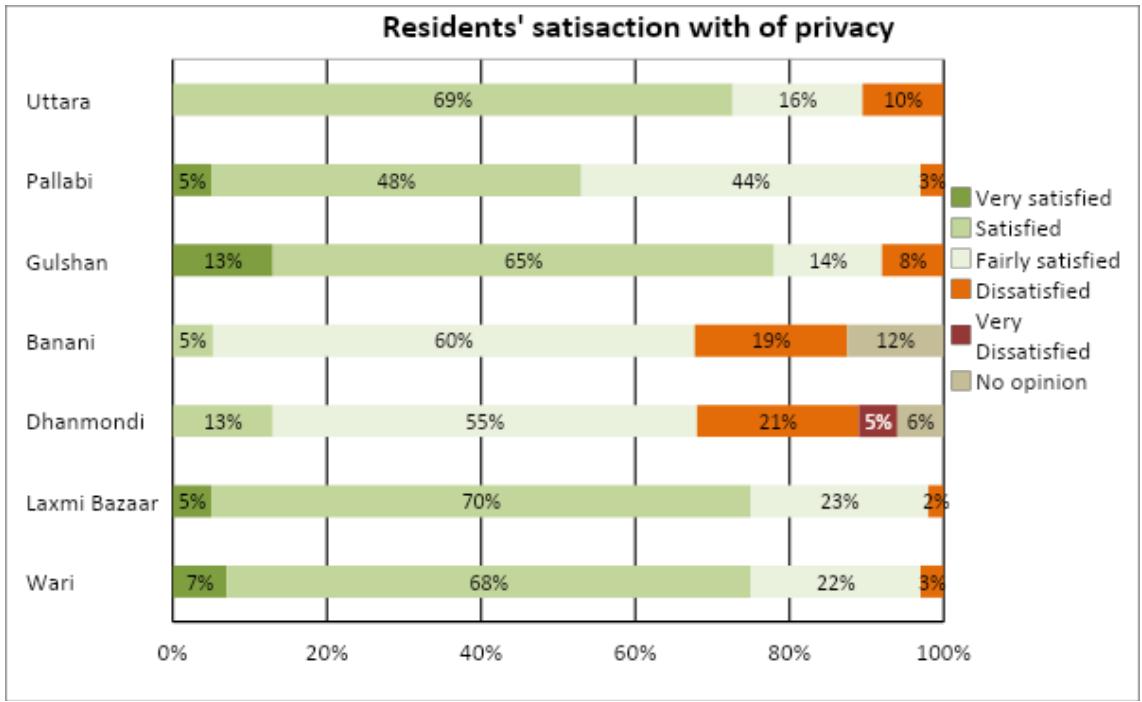 Chart 8: Respondents' opinion about the satisfaction level of privacy The percentage is based on the number of responses. Source:Field Survey,2015
### e) Residents' satisfaction with the livability condition of residential areas
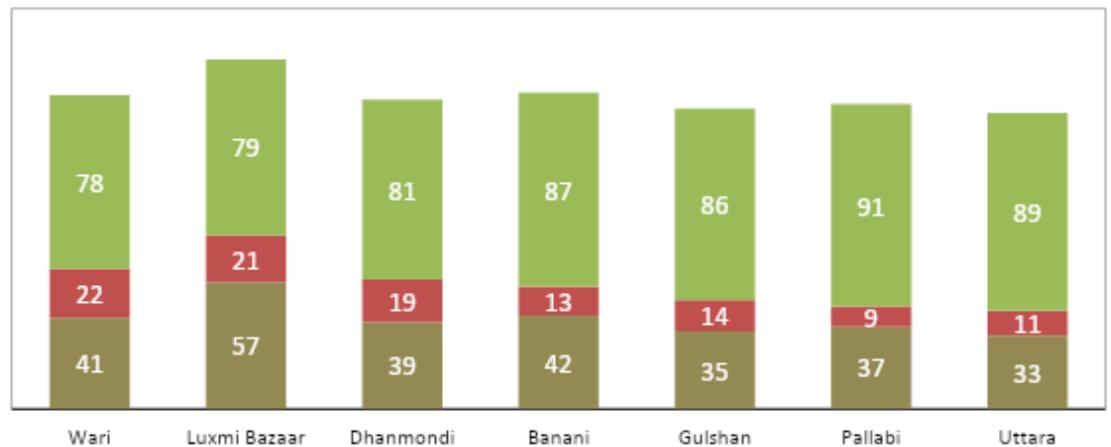
Apart from the functional aspects of design, the livability of any neighborhood also depends on the perception of the built environment in terms of perceived attractiveness, maintenance, cleanliness, and privacy. The survey findings regarding the perceived aspects of the study areas are presented in Table 4.
High-density residential areas like Wari and Luxmi Bazaar were rated as less attractive by $79\%$ and $87\%$ of the respondents respectively in terms of architectural characteristics/style. Despite being older settlements Wari and Luxmi Bazaar differ in their road layout system. Luxmi Bazaar has an organic pattern of street network with a labyrinth of narrow alleys while Wari was the first planned residential area with grid iron road network. The multi-storied (5-7 storied) buildings flanking the narrow alleys on both sides with scanty and often no setbacks make Luxmi Bazaar visually more chaotic and crowded. Furthermore, Luxmi Bazaar has a good number of old derelict building stock. On the other hand, Wari, with its fair share of high-rise (8-9 storied) buildings not commensurable with their adjoining road widths projects an equally intimidating congested image of the neighbourhood. These residential areas are largely tenant occupied and most of them reside here for better connectivity with workplaces and proximity to educational facilities as well as affordable house rents and safety. All these factors contribute to the negative responses about the attractiveness of these residential areas.
Table 4: Perceived quality of the local residential neighborhood environment (Percentage)
<table><tr><td>Location</td><td>Cleanliness</td><td>Better connectivity</td><td>Attractiveness</td><td>Well maintained</td></tr><tr><td>Wari</td><td>17</td><td>47</td><td>21</td><td>15</td></tr><tr><td>Luxmi Bazaar</td><td>9</td><td>67</td><td>13</td><td>11</td></tr><tr><td>Dhanmondi</td><td>14</td><td>30</td><td>52</td><td>4</td></tr><tr><td>Banani</td><td>10</td><td>17</td><td>62</td><td>11</td></tr><tr><td>Gulshan</td><td>11</td><td>12</td><td>68</td><td>9</td></tr><tr><td>Pallabi</td><td>8</td><td>73</td><td>15</td><td>4</td></tr><tr><td>Uttara</td><td>15</td><td>54</td><td>21</td><td>10</td></tr></table>
The percentage is based on the number of responses.
Source:Field Survey,2015
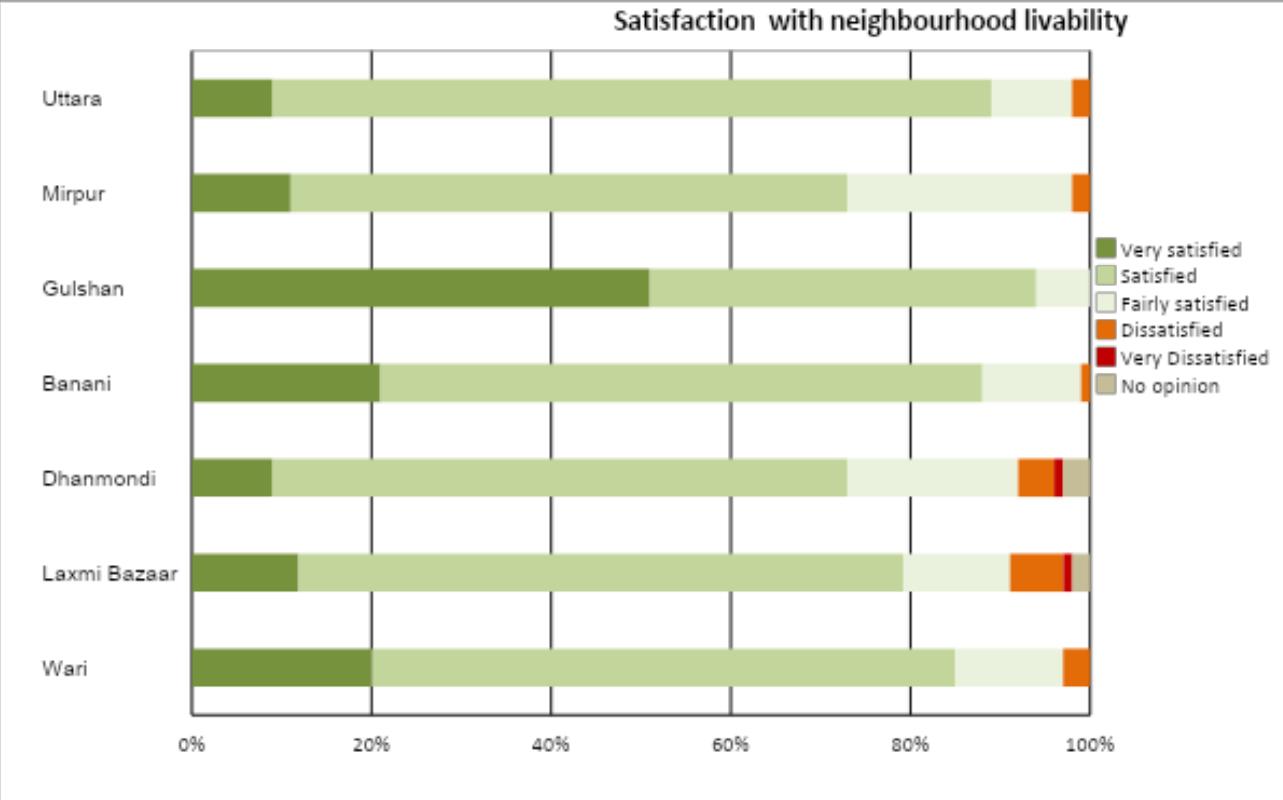 Chart 9: Satisfaction level of residents regarding the livability condition of their residential areas The percentage is based on the number of responses. Source:Field Survey,2015
High density is also found to have a positive relationship with connectivity which implies that high-density areas are well supported by public transport. Factors like cleanliness and maintenance of the built environment are associated with the socio-economic status of the occupants. In support of this, it was also found that residential areas with higher family income (Dhanmondi, Banani, Gulshan, and Uttara) have better maintenance and cleaner environment than the residential areas with lower family income and lower social status (Luxmi Bazaar, Wari, and Pallabi). In addition, the building stock of Dhanmondi, Banani, Gulshan conforms to modern design style making the streetscape visually appealing. Most of the residents of these areas own cars and thereby do not feel the inadequacy of public transport facilities. Regardless of the shortage of public transport facilities a higher percentile of the respondents of these areas finds their neighbourhood visually attractive. Even perceived density is found to have a negative association with perceived attractiveness, maintenance of buildings, and cleanliness of the residential area which reflects in case of medium density area like Pallabi. Around $70\%$ of the inhabitants who perceived their residential area as crowded also expressed their dissatisfaction regarding its maintenance, cleanliness, and attractiveness. However, regardless of the varied density the overall satisfaction level of the residents of the study areas was found surprisingly quite high (Chart 9). Subtle variations were observed in terms of the level of satisfaction where a higher percentile of the residents of upscale neighborhoods with moderate density (i.e. Gulshan $52\%$, Banani $21\%$ ) exhibited a high level of satisfaction in comparison with the high-density areas of Wari and Luxmi Bazar. The variation in the proportion of unsatisfied residents among the residential areas of both Old and New Dhaka is statistically insignificant. The relationship between density and the selected aspects of environmental sustainability is assessed through Pearson's correlation analysis and presented in Table 5.
Table 5: Relationship between density and aspects of environmental sustainability
<table><tr><td rowspan="2"></td><td rowspan="2">List of indicators</td><td rowspan="2">Physical density relationship (ward wise - gross population density</td><td colspan="2">Perceived density relationship</td><td rowspan="2">The overall impact of density</td></tr><tr><td>Perceived neighborhood density</td><td>Perceived density within the dwelling</td></tr><tr><td colspan="6">Environmental sustainability</td></tr><tr><td>Accessibility to open space</td><td>The average number of parks per 1000 people</td><td>negative</td><td></td><td></td><td>negative relationship- higher-density residential areas have less accessibility to open space.</td></tr><tr><td>Access to daylight</td><td>Percentage of plots which does not get adequate daylight and need to keep lights on during daytime</td><td>negative</td><td></td><td></td><td>Negative relationship- higher-density residential areas have less daylight and need more artificial lighting during the daytime.</td></tr><tr><td rowspan="3">Sense of privacy (Acoustic & Visual)</td><td>Perceived noise pollution</td><td>no impact</td><td>no impact</td><td>no impact</td><td rowspan="3">positive relationship- higher density residential areas have more noise pollution and visual obstruction, but perceived acoustic and visual privacy displays no impact.</td></tr><tr><td>The measured intensity of noise pollution</td><td>positive</td><td>no impact</td><td></td></tr><tr><td>Visual Obstruction by surrounding buildings</td><td>positive</td><td>no impact</td><td>no impact</td></tr><tr><td rowspan="4">Satisfaction with the living condition of their residential area</td><td>Perceived residential area in terms of attractiveness</td><td>negative</td><td>negative</td><td>no impact</td><td rowspan="4">negative relationship - higher density residential areas were found less preferable in terms of attractiveness, architectural character, maintenance, and cleanliness.</td></tr><tr><td>Architectural character/Style</td><td>negative</td><td>no impact</td><td>no impact</td></tr><tr><td>Well maintained buildings</td><td>negative</td><td>negative</td><td>no impact</td></tr><tr><td>Clean environment</td><td>negative</td><td>no impact</td><td>no impact</td></tr></table>
The relationship of density was examined against four aspects of environmental sustainability which are accessibility to open space, access to daylight, sense of privacy, and satisfaction with the living condition of the neighborhoods. From the correlation analysis (Table 5) it can be seen that the accessibility to open space and satisfaction with the living condition of the neighborhoods display negative associations with density while the other aspects had a positive relationship. The negative relationships imply that higher-density residential areas have less open space and are less preferable in terms of attractiveness, cleanliness, architectural style, and privacy. Density displaying a positive association with access to daylight signifies that dense residential areas require more artificial lights to be put on during daytime and are subjected to a higher degree of visual obstruction. The measured intensity of noise is positively associated with physical density, but no significant correlation was found between the perceived level of noise and both physical and perceived density.
## IV. SUMMARY FINDINGS AND DISCUSSION
The results of the statistical analysis provide limited insight into the dynamics between density and environmental sustainability as it does not consider subjective parameters like people's habitual inclination, emotional state, cultural practice, tradition, and beliefs that usually shape their perception of their surrounding environment. Therefore, some contradictions emerged when comparing the results of the correlation analysis with the interviews collected from the residents. Therefore, the contradictions associated with each selected aspect of environmental sustainability are discussed and interpreted with the findings of the statistical analysis (Tabel 5) below:
### a) Privacy
Regarding the acoustic privacy the measured level of noise of the study areas varied from 69dBA to 75dBA which is far beyond the acceptable level of noise (residential areas 50 dBA and mixed-use areas 60 dBA) set by the Department of Environment, Bangladesh. Despite the persistent high-level noise found in the residential areas most of the residents did not acknowledge it as a problem. However, to prevent noise-induced hearing loss, the U.S. Environmental Protection Agency (EPA) and the World Health Organization (WHO) recommend maintaining environmental noises below 70 dBA over 24-hours (75 dBA over 8-hours). Similar responses were also found regarding visual obstruction and loss of privacy caused by the compactness of the dwelling units with inadequate setback spaces in between. The situation is more acute in the case of Luxmi Bazaar. But due to the rich social bonding prevailing in this locality residents were found not duly concerned about the lack of visual and acoustic privacy. A probable reason for the residents' insensitivity towards the necessity of acoustic and visual privacy might be rooted in their lack of awareness regarding the health problems caused by these factors. Prolonged exposure to such conditions is deemed to impart serious physical and psychological impairment to the residents as well as future generations putting the overall sustainability of the community at stake.
### b) Access to daylight
The statistical analysis showed a negative association of density with access to daylight where most of the apartments depend on artificial lighting during the daytime. This scenario is more acute in the dense residential areas of Luxmi Bazaar and Wari than in the residential areas of New Dhaka. But the residents of these areas again did not express any serious discomfort concerning this issue. In the case of Old Dhaka, this could be attributed to the emotional adaptability of the residents caused by the longer duration of staying in such an environment. On the other hand, most of the occupants of New Dhaka remain away from their homes during daytime due to jobs, education, and other commitments and therefore, do not feel much bothered about the paucity of solar access.
### c) Accessibility to open spaces
The research findings indicate a negative association of gross population density with the accessibility to open space. The higher-density residential areas were found to have less or almost no accessibility to open spaces. Owing to the insufficient and unviable development control strategies and open space protection laws together with the ubiquitous encroachment of the open spaces by market forces, Dhaka has the lowest amount of open space available for residential areas. The existing open spaces are inadequate in number, and size and unevenly distributed across the residential areas. Furthermore, they lack proper maintenance and, in many cases, have restricted access. Literature confirms the importance of open spaces for our overall mental and physical wellbeing. Spending time in open and green spaces is crucial for people to relax, reduce stress and restore their health. (Greenspace Scotland 2008). Several studies have investigated the impact of green space on mental health. In one of the earlier studies of 1979, Ulrich found that there is a significant reduction in the stress levels of Americans after exposure to nature scenes, compared with urban scenes. Furthermore, living in an urban landscape devoid of vegetation and other natural elements tends to react adversely to the emotional well-being of people leading to a considerable increase in depression, anger, aggression, and fear (Ulrich RS. 1991). Besides, a diversified range of social contacts and leisure activities can take place in the open spaces enhancing the community's health and well-being. Green spaces not only allow people to reconnect with nature but also foster wildlife. Residential neighborhoods without proper breathing spaces will degrade the social, emotional, and environmental wellbeing of the community making it vulnerable in the long run. This type of planning will lead the residential areas toward unsustainability.
## V. CONCLUSION
From the findings in the study, it is evident that the ongoing densification operation has a significant impact on residential areas of differing densities. The most explicit implications of the densification intervention appeared to be the lack of accessible open space and daylight while implications on aspects like visual and acoustic privacy were more implicit. Regardless of the degree of impact, the current densification interventions are found to have negative consequences on community life which are adversely affecting the environmental sustainability of the residential areas. If this trend of unguided densification continues to prevail the problems would accentuate further putting environmental sustainability at stake. Measures like area-wise density mapping, building height restrictions, promotion of green façade, roof top garden and other green infrastructure could be helpful in mitigating the situation. Therefore, densification operations should be undertaken considering the existing condition of the environmental and urban context and assessing the site-specific constraints and opportunities.
Generating HTML Viewer...
References
20 Cites in Article
Bayes Ahmed,M Kamruzzaman,Xuan Zhu,M Rahman,Keechoo Choi (2013). Simulating Land Cover Changes and Their Impacts on Land Surface Temperature in Dhaka, Bangladesh.
Talukder Byomkesh,Nobukazu Nakagoshi,Ashraf Dewan (2012). Urbanization and green space dynamics in Greater Dhaka, Bangladesh.
V Cheng (2009). Editorial Board.
Dap (2010). Final report of Preparation of Detailed Area Plan (DAP) for DMDP Area: Group C.
Ashraf Dewan,Yasushi Yamaguchi (2009). Land use and land cover change in Greater Dhaka, Bangladesh: Using remote sensing to promote sustainable urbanization.
Dmdp (1995). Dhaka Metropolitan Development Plan (1997-2015) Volume II Dhaka Urban Area Plan.
Dmdp (1995). Dhaka Metropolitan Development Plan.
A Gallion,B Eisner,S (1963). The urban pattern.
(2008). COVID-19 and greenspace use - Survey findings summary.
S Haq (2011). Urban green spaces and an integrative approach to sustainable environment.
Alex Lo,C Jim (2010). Differential community effects on perception and use of urban greenspaces.
Sally Macintyre,Laura Macdonald,Anne Ellaway (2008). Do poorer people have poorer access to local resources and facilities? The distribution of local resources by area deprivation in Glasgow, Scotland.
Oliver Mytton,Nick Townsend,Harry Rutter,Charlie Foster (2012). Green space and physical activity: An observational study using Health Survey for England data.
F Nilufar (2001). Urban life and use of Public Space Study of responsive public open spaces for supporting urban life in Dhaka City.
W Rome (1998). William Whyte, Open Space, and Environmental Activism.
Peter Seaman,Russell Jones,Anne Ellaway (2010). It's not just about the park, it's about integration too: why people choose to use or not use urban greenspaces.
Michael Strohbach,Eric Arnold,Dagmar Haase (2012). The carbon footprint of urban green space—A life cycle approach.
R Ulrich (1991). Stress recovery during exposure to natural and urban environments.
(2010). Green Economy: Developing Countries Success Stories United Nations Environment Programme.
(2009). Global Health Risks -Mortality and burden of disease attributable to selected major risks (Text).
No ethics committee approval was required for this article type.
Data Availability
Not applicable for this article.
How to Cite This Article
Syeda Jafrina Nancy. 2026. \u201cDensification vs Environmental Sustainability: A Study of the Residential Areas of Dhaka\u201d. Global Journal of Human-Social Science - B: Geography, Environmental Science & Disaster Management GJHSS-B Volume 23 (GJHSS Volume 23 Issue B3).
Explore published articles in an immersive Augmented Reality environment. Our platform converts research papers into interactive 3D books, allowing readers to view and interact with content using AR and VR compatible devices.
Your published article is automatically converted into a realistic 3D book. Flip through pages and read research papers in a more engaging and interactive format.
Our website is actively being updated, and changes may occur frequently. Please clear your browser cache if needed. For feedback or error reporting, please email [email protected]
Thank you for connecting with us. We will respond to you shortly.