- Annual wheat grain yield trend could be better captured by the accumulated meteorological factor established here
- The rainfall ratio of total growing season to post-anthesis period were found an influential meteorological factor to promote post-anthesis nitrogen and dry matter translocation and assimilation processes, especially for the dry matter
- by merging cultivars data the regressional grain protein content models could achieve acceptable prediction accuracy given the future regional application with variety of cultivars planted
I. INTRODUCTION
Wheat (Triticum aestivum L.) is an important staple grain, with a global production of 766 million tons in 2019 (FAO, 2020). Sustaining grain quality in dynamic environments has been a research focus because of the growing market requirements for food nutrition, product functionality, and commodity profits. Grain protein concentration (GPC) and composition largely affect the nutritional and end-use properties of dough mixing and rheological characteristics (Nuttall et al., 2017). Numerous studies have been conducted to determine the major factors influencing grain quality, mostly GPC, which includes genetics, management, and the environment.
GPC is the net result of independent starch and protein accumulation in the grain, and applying Nitrogen (N) fertilizer is commonly considered a practical way to improve GPC (Ercoli et al., 2008; Subedi et al., 2007). From agronomical and ecophysiological perspectives, crop nitrogen accumulation is closely related to crop growth rate and biomass accumulation under ample soil availability. It depends on soil mineral N availability, distribution, and root distribution under suboptimal N supply (Gastal and Lemaire, 2002). Because of the critical role of N in wheat growth, the mechanisms of N uptake and redistribution in wheat have been depicted in detail in simulation models, with the simulation results prone to be largely affected by the key parameters of crop N demand and supply processes (Jamieson and Semenov, 2000).
In addition to N, climatic conditions often exert notable effects on crop growth and grain quality. Pan et al. (2006a) reported that reliable GPC prediction results based on the stepwise regression method were achieved with climatic factors that mainly covered the grain-filling period as independent variables. With the aid of detailed genotypic parameters acquired by cultivar experiments, the model can explain as much as of GPC variation using validation data from different site-year combinations. Similarly, Li et al. (2020) obtained robust GPC predictions using a hierarchical linear model based on climatic factors and cultivar parameters. As reported by Pan et al., the major difference between the climatic factors and the aforementioned ones is that the latter is before anthesis and covers a period of one month. A recent review (Nuttall et al., 2017) reported that under climate change, elevated atmospheric carbon dioxide consistently reduced the GPC of wheat, and heat stress contributed to a significant weakening of dough properties. Furthermore, rainfall during wheat grain maturation severely reduces grain glutenin polymers, which are intrinsically related to grain functional properties (Koga et al., 2020).
N accumulation (NA), dry matter (DM), and remobilization related to pre- and post-anthesis/head periods have become a research focus. Ercoli et al. (2008) suggested that grain yield (GY), DM, NA, and remobilization were positively affected by N availability and negatively affected by water stress during grain filling and that there was a significant interaction between N rate and water stress for grain N concentration (GNC). Tsukaguchi et al. (2016) observed in another crop belonging to Gramineae that both plant N status before and after heading is sensitive to rice GPC, with the latter being greater. Barbottin et al. (2005) indicated that the main sources of variation in the amount of remobilized N, N uptake during flowering, and N remobilization efficiency were the environment (including site, treatment, and year, respectively).
Due to its large-area coverage, non-damage sampling, and fast acquisition, remote sensing has been widely applied in crop growth monitoring (Thenkabail, 2003). Thus, GPC forecasting can be achieved in advance according to the crop growth conditions obtained by remote sensing based on established models linking GPC with crop growth variables. In addition, such models differ in mechanisms, such as process-based crop growth models, semi-empirical models that mainly consider both pre- and post-anthesis processes, and simple empirical models (Li et al., 2015; Li et al., 2008; Song et al., 2009; Wang et al., 2004). The semi-empirical model appears to be the most promising candidate among the three types of models related to remote sensing data. Moreover, it is easier to compute GPC using a semi-empirical model since it uses fewer processes compared to the complex assimilation algorithms of the growth model. Furthermore, the semi-empirical model can also explain NA and DM and remobilization related to the pre- and post-anthesis periods. Thus, the semi-empirical model appears more applicable to assess medium-to large-scale phenomena (Cichota et al., 2010).
This study conducted multi-year experiments in Beijing, comprising 3factors, including 1-4 N fertilization rates (NF), 12 cultivars, and three planting dates. We aimed to solve the following targets: (1) analyze aboveground DM, NA at anthesis, and GY and grain nitrogen accumulation (GNA) at maturity, and establish new transfer coefficient sub-models that link N and DM at anthesis to those at the maturity stage; (2) collect weather data such as rainfall, average temperature (T), and solar radiation (SRAD), to establish meteorological factor sub-models that enhance the empirical prediction of NA and DM at anthesis, as well as new transfer coefficients. (3) Soil N mineralization is considered to improve NA prediction, particularly with respect to N fertilization. Provided that the key parameters are fitted to local experimental data beforehand, the approach can be extended to other regions outside of Beijing.
II. MODEL DESCRIPTION
Mainly focusing on the post-anthesis period, a semi-empirical GPC model was established based on four sub-models and four accompanying meteorological factors involved in DM and N assimilation and their translocation. The basic structure of this model is as follows (the acronyms are listed in Table A1 in the Appendix):
where 5.7 is the transformation coefficient (Spratt, 1979) used to calculate GPC from GNC.
where (1) , are the accumulated meteorological factors based on data from the whole growing period for growing seasons , , respectively; (2) , rare the growing seasons corresponding to model validation and model establishment experiments, respectively; (3) DM ( ) corresponds to the anthesis stage; (4) is the ratio corresponding to a transformation of , which is the DM post-anthesis transfer coefficient in growing season and will be illustrated in detail in the following sections; (5) 2 is the coefficient along with the transformation of ; and (6) , are the meteorological factors for in growing seasons , , respectively.
where(1) corresponds to growing season , (2) are defined similarly to the DM counterparts, and (3) 2 is the coefficient along with the transformation of .
a) Accumulation of DM, N
Aboveground DM and NA at anthesis are important because GY and GNA at maturity greatly depend on the translocation of pre-anthesis assimilated to the grain (Papakosta and Gagianas, 1991). Crop biomass production is influenced by a variety of environmental factors, which can be seen in solar-driven CERES(Otter-Nacke et al., 1986), -driven WOFOST (Supit et al., 1994), and water-driven Aqua Cropmodels (Steduto et al., 2009). For simplification, only four variables were considered in modeling aboveground biomass at anthesis based on a linear regression form: leaf area index (LAI) derived from three key growth stages (jointing, heading, and anthesis stages), seed rate (SR), heat sum (ST, i.e., thermal time), and NF. The original LAI (OLAI) was proposed to represent the effects of soil heterogeneity other than those of SR, ST, and NF, which was derived by dividing the measured LAI by a combined factor (CF) using the following formula:
where (1)NMAX is the highest NF in the field plots; (2)BNN is the basal N nutrition with 60 kg mineralized N during the growth stage (Ju et al., 2003); (3)BSR is the basal seed rate with 375 seeds m ; (4)BST is the basal heat sum with 2443 °C corresponding to the optimum sowing date treatment of the 2009–2010 field experiment; and (5)0.5,0.25, and 0.25 are the assumed weighting coefficients here.
where (1) is the sum of the original LAI at the jointing, heading, and anthesis growth stages, (2) , , and are the measured LAI at relative stages, and (3) is the combined factor. By adopting the log-formed DM recommended by Lobell and Burke (2010), it was calculated as follows:
where are the model coefficients, and is the error term. The values of were obtained using the least-squares procedure.
where is aboveground DM at anthesis in growing season ; and (2) , are the accumulated meteorological factors based on data before anthesis for growing season , , respectively.
Allometric relationships were used to calculate crop N demand based on crop biomass (Gastal and Lemaire, 2002). Actual NA at anthesis was set astheminimum crop N demand (BN, kg N ha ) and soil N supply (SNS, kg N ha ), with the latter referring to Gao (2004).
where are the model coefficients obtained from Eq. (6) after the log transformation of both sides.
b) DM & N post-anthesis transfer coefficients
Parameters related to DM, NA, and remobilization within wheat plants (Ercoli et al., 2008) were calculated as follows:
- Post-anthesis DM and N (PDM, PN) as the difference between DM or N content at anthesis and physiological maturity.
- DM remobilization (DMR) = DM at anthesis (DM)-DM of leaves, culms, and chaff at maturity (SDM)
- Nitrogen remobilization (NR) = N content of aboveground vegetation at anthesis (NA)-Ncontent of leaves, culms, and chaff at maturity (SN);
For the estimation of DMR and NR, it was assumed that all the DM and N lost from vegetative plants were remobilized to develop the grain.
DM and N post-anthesis transfer coefficients were calculated based on the above parameters in the same way: and (PN-SN)/NA. Furthermore, GY and GNA could be derived based on two coefficients: DMand From these definitions, should be more influenced by post-anthesis growth (PDM and PN) and genetic differences (SDM and SN) rather than pre-anthesis growth (DM and NA) since the pre-anthesis stage has finished considering the model prediction time.Given that the three cultivars were similar in gluten type and a sufficient irrigation regime was applied for all treatments, the values were believed to be affected by post-anthesis meteorological factors to a larger extent. To avoid negative values in the calculation, which makes the interannual comparison complex when metrological factors are involved, values were changed into ratios (i.e., and following the transformations and . and were constrained in the range of 0-1, with the calculated values outside the range set as O or 1, depending on which was closer.
After definition, and were predicted using the preferential binary linear regression method. By comparing the two-variable combination results from four potential parameter candidates (i.e., CLND, LAI, SLW, and EWT), LAI and SLW were finally chosen with the following linear equations:
where CLND is the canopy leaf nitrogen density, SLW is the specific leaf weight, EWT (mm) is the leaf equivalent water thickness (Yilmaz, 2008), and and are the model coefficients.
where CLDM (kg ) is the top two leaf DM at anthesis, CLNC is the leaf nitrogen content corresponding to CLDM, LDM ( ) is the leaf DM at anthesis, and are model coefficients.
c) Meteorological factors
The effects of weather conditions on wheat GY have been extensively studied (Ferris et al., 1998; Landau et al., 2000; Sadras et al., 2003; Schillinger et al., 2008). After long-term adaptation to the local environment, high GY should be achieved if the growing season weather is identical to the historical average climate conditions. Based on this assumption, the meteorological factors for DM at anthesis and GY were calculated following the algorithms of Lakatos (1997):
where (1) (dimensionless) is the weighting function; (2) is the climate data, including T, SRAD, and standard precipitation index (SPI) (Mckee et al., 1993); (3) is the historical average value of climate indices over the growing season; (4) and are the minimum and maximum values of the historical climate indices over the growing season, respectively; and (5) and are the probable values corresponding to and , respectively, calculated by the probability density function of the standard normal distribution based on the historical long-term data series.
where (1) AMF (dimensionless) is the accumulated meteorological factor for DM and GY, (2) is the time, and is the number of ten-day periods in the growing season. A month can be divided into three ten-day periods and the rest of the days as the last ten-day period except for the first two ten-day periods. AMF and AMF can thus be calculated based on Equation 14 to determine the aboveground DM at anthesis and GY at maturity, respectively.
and are meteorological factors for and , respectively, and were defined in the same way as and . Based on cultivar Jing 9428, and were calculated using four model establishing experiments. After comparing the correlation coefficients between multiple meteorological factors during anthesis and maturity and and , was identified as the best candidate variable for prediction, as follows:
where is the rainfall ratio of the entire growing season to the period during anthesis and maturity, and and are model coefficients.
The coefficients of the above equations were based on the experimental data for the four growing seasons, which are listed in Table 1. As shown in the table, except for the nonsignificant sub-model of , all the other sub-models reached significant or even higher levels.
| Parameters | Log(DM) | BN | RβC | RβN | Log(LDM) | MFRβC | MFRβN |
| Constant | 3.228(***) | -0.497(ns) | -0.298(ns) | 0.061(ns) | 2.576(***) | 0.032(ns) | 0.151(ns) |
| OLAlsum | 0.032(***) | - | - | - | - | - | - |
| CF | 0.249(ns) | - | - | - | - | - | - |
| DM | - | 0.693(0.05) | - | - | - | - | - |
| LAI | - | - | -0.036(ns) | -0.085(*) | 0.137(***) | - | - |
| SLW | - | - | 17.656(*) | 14.404(ns) | - | - | - |
| CLND | - | - | - | - | 0.003(**) | - | - |
| Raintot/Rainfill | - | - | - | - | 0.135(*) | 0.124(ns) |
III. MATERIALS AND METHODS
a) Treatments
Six growing season experiments were conducted at the National Research and Demonstrating Base of Precision Agriculture, Beijing, China (40°11' N, 116°27' E, 36 m elevation). The experimental design and treatments are summarized in Table 2, and the winter wheat and summer maize rotation systems remained the same for each experiment. During the later period of the growing seasons, the accelerated growth and development produced identical anthesis dates for all treatments, thus showing only one set of meteorological data for the three sowing date treatments. Seeding rates were referenced to local production practices ranging from 375 to 600 seedsm . Sprinkler irrigation was adopted after 2005 relative to the previous border irrigation mode. One irrigation before the overwintering period was applied, and another 3-4 irrigations were applied during the re-green, jointing, anthesis, and grain-filling growth stages with an average of 60-75 mm each time.
Four experiments, 2003/2004, 2004/2005/, 2005/2006, and 2009/2010, were used as model establishing experiments (Exp.1-3and Exp.5, respectively), and Exp.5 was the main establishing experiment. Only cultivar Jing 9428 was planted in Exp.1-3. In Exp. 5, three winter wheat cultivars were adopted: Jing 9428, Nongda 195, and Jingdong 13, and the former two were classified as strong-gluten cultivars and the remaining as medium-gluten cultivars. Together with Exp. 5, Exp.1-3 provided data for constructing the meteorological factor sub-models. Two field experiments covering the 2008/2009 and 2010/2011 growing seasons (Exp. 4 and 6, respectively) were used for validation.
| Growing Season | Sowing date | Seeding rate (seeds m-2) | N fertilization (kg N ha-1) | From sowing to anthesis | From anthesis to maturity | |||||||||||
| Sowing | Jointing stage | Water supply (mm) | Global radiation (MJ m-2) | Average daily temperature (°C) | Water supply (mm) | Global radiation (MJ m-2) | Average daily temperature (°C) | |||||||||
| N1 | N2 | N3 | N4 | Rainfall | Irrigation | Rainfall | Irrigation | |||||||||
| Exp.1 | S1 | 460 | 146 | 70 (N1-N4) | 158 | 210 | 2264 | 6.4 | 52 | 38 | 941 | 23.3 | ||||
| Exp.2 | S1 | 454 | 146 | 105 (N1-N4) | 78 | 240 | 2402 | 6.2 | 81 | 0 | 945 | 21.9 | ||||
| Exp.3 | S1 | 527 | 146 | 88 (N1-N4) | 26 | 284 | 2426 | 6.8 | 53 | 0 | 672 | 23.5 | ||||
| S1 | 0 | 53 | 105 | 158 | 96 | 2431 | 6.8 | |||||||||
| S2 | 450 | 45 | 270 | 96 | 68 | 929 | 24.0 | |||||||||
| Exp.4 | S3 | (S1-S3) | (S1-S3) | 105 (N1-N4) | 78 | (S1-S3) | 2326 | 6.4 | (S1-S3) | (S1-S3) | (S1-S3) | (S1-S3) | ||||
| 105 (N1-N4) | 74 | 2167 | 5.8 | |||||||||||||
| S1 | 375 | 0 | 26 | 53 | 79 | 113 | 2410 | 5.3 | ||||||||
| Exp.5 | S2 | 525 | 56 | 53 | (N1-N4) | 108 | (S1-S3) | 2293 | 4.6 | 95 | 68 | 898 | 24.2 | |||
| S3 | 675 | 53 | (N1-N4) | 108 | 2173 | 4.0 | (S1-S3) | (S1-S3) | (S1-S3) | (S1-S3) | ||||||
| S1 | 0 | 74 | 2612 | 5.6 | ||||||||||||
| Exp.6 | S2 | 600 | 114 | (S1 | 59 | 118 | 177 | 51 | 327 | 2521 | 5.3 | 43 | 144 | 893 | 23.7 | |
| S3 | (S1-S3) | (S1-S3) | - | (S1- | (S1- | (S1- | (S1- | (S1-S3) | (S1-S3) | (S1-S3) | (S1-S3) | (S1-S3) | ||||
| S3) | S3) | S3) | S3) | 51 | 2436 | 5.0 | ||||||||||
Because of the extremely low values presumably caused by sampling or measuring errors, two LAI and two GPC values were deleted from Exp. 5 and 4, respectively. To establish the biomass N submodel, only13 treatments with top-dressing N fertilization were considered, ignoring the other three niltop-dressing N fertilization treatments. The cultivars used for Exp.4 and 5 were the same, except for Jingdong 13 in Exp. 5, which was replaced with Jingdong 8 in Exp.4. In Exp. 6, a quasi-four-level orthogonal table design, that is, , was used with three cultivars (Jing 9428, Nongda 195, and Yannong 19), four nitrogen fertilizer rates, and three sowing dates (Table 3). However, the cultivar Jing 9428 was mistakenly replaced by Jing 9843 in plots 3, 4, 7, and 8. Seven additional local popular cultivars planted on the S1 date and with an N3 fertilizer rate were Jing 9843, Jingdong 17, Zhongyou 206, Jingdong 12, Nongda 3432, Nongda 211, and Zhongmai 175. Only 12 treatments from the S1 date, which were far away from the weed-affected treatments, were viewed as suitable for validation because other treatments were affected by weed spread from adjacent freeze-injury treatments in another study. Two of the 12 treatments were removed further for abnormal or missing LAI values.
| Num. | Sowingdate | Cultivar | Nfertilization | Num. | Sowingdate | Cultivar | Nfertilization |
| 1 | S1 | C1 | B+N1 | 9 | S2 | C1 | B+N2 |
| 2 | S1 | C2 | B+N3 | 10 | S2 | C2 | B+N4 |
| 3 | S1 | C3 | B+N4 | 11 | S2 | C3 | B+N3 |
| 4 | S1 | C3 | B+N2 | 12 | S2 | C3 | B+N1 |
| 5 | S1 | C1 | B+N4 | 13 | S3 | C1 | B+N3 |
| 6 | S1 | C2 | B+N2 | 14 | S3 | C2 | B+N1 |
| 7 | S1 | C3 | B+N1 | 15 | S3 | C3 | B+N2 |
| 8 | S1 | C3 | B+N3 | 16 | S3 | C3 | B+N4 |
b) Sample measurement
Field samples from the center rows) were collected at ground level at the jointing, heading, and anthesis stages in each plot, which was separated into four parts: culm, upper two leaves, lower leaves, and ear. Aboveground NA was calculated by summing the individual organ values obtained by multiplying the organ biomass with the corresponding N concentration. At maturity, two samples of from the central rows in each plot were cut to measure GY. Each sample was first oven-dried at 105 °C for 15–20 min, then oven-dried at 70 °C for 24 h and weighed. After drying, all samples were ground in a mill to pass through a 1-mm screen.
GPC and grain moisture content were determined by NIT spectroscopy using an Infratec 1241 grain analyzer (FOSS-Tecator, Hogenäs, Sweden). Soil organic matter was analyzed by potassium dichromatesulfuric acid titration using a vario MACRO cube elemental analyzer (Elementar, Hanau, Germany). The total nitrogen content in the soil was analyzed using the Semi-Micro-Kjeldahl method with a KJELTEC 2300 Auto analyzer (FOSS Tecator, Hogenäs, Sweden). Soil nitrate-nitrogen was analyzed using the phenol disulfonic acid colorimetric method with a Helios Alpha double-beam ultraviolet spectrophotometer (Thermo Fisher Scientific Inc., MA, USA). All measured and estimated values related to DM, GY, and GPC were based on dry mass.
c) Weather data collection and calculation
Long-term daily sunshine duration (h), T , and precipitation (mm) data covering a 30-60-year period for the Beijing area were obtained from the China Meteorological Data Sharing Service System (China Meteorological Data Service Centre, 2010). SRAD were calculated using the procedures described by Allen et al. (1998). Monthly SPI values were simulated using SPI_SL_6 (National Drought Mitigation Center, 2011) software. Standard values of the SRAD, T, and SPI data series were derived from the standard normal distribution transformation.
d) Model assessment
Model performance was assessed using normalized root mean squared error (nRMSE,%) (Rinaldi et al., 2003):
where and are the estimated and observed values, respectively, is the mean observed value. The model performance was considered excellent if the nRMSE was , good if it was , fair if it was , and poor if the nRMSE was .
III. RESULTS
a) Effects of NF and sowing date
In Exp. 4, the three-factor experimental design of the study was not a complete factorial design; however, two two-factor complete factorial designs could be derived from it (i.e., cultivar) on the S1 date and 3(sowing date) cultivar) under N3 application). Cultivar factors could be viewed as replicates because of their similar gluten types. DM at anthesis, DM post-anthesis transfer coefficients , N post-anthesis transfer coefficients , and GY were calculated by averaging the values of the three cultivars, and the results were not significant between NF levels ; Table 4). Generally, DM showed an opposite trend relative to and with N rates; with DM rising and and falling. As for GY, N2 corresponded to the highest GY (4006 kg ha ), and GY decreased in cases of higher or lower NF compared to N2.
NA at anthesis increased with N application rates; NA was significantly higher for N4 than for N1 , and the former value was double the latter one . GPC was significantly higher in N2 and N4 than in N1. For the remaining three N rate treatments, the increasing GPC trend from 12.6 to indicated the strong positive effects of NF on GPC. In contrast, the sowing date had no significant effects on any of the five traits .
| Treatment | Dry matter (kg ha-1) | Nitrogen accumulation (kg ha-1) | Dry matter post-anthesis transferring coefficient | N accumulation post-anthesis transferring coefficient | Grain yield (kg ha-1) | GPC (%) |
| N application rate | ||||||
| N1 | 6431 | 68.6a | 0.299 | 0.658 | 3602 | 12.6a |
| N2 | 6985 | 110.1ab | 0.311 | 0.518 | 4006 | 15.7b |
| N3 | 6903 | 119.6ab | 0.255 | 0.398 | 3525 | - |
| N4 | 7336 | 138.9b | 0.257 | 0.419 | 3700 | 17.4b |
| Sowing date | ||||||
| S1 | 6903 | 119.6 | 0.255 | 0.398 | 3525 | - |
| S2 | 6708 | 121.2 | 0.270 | 0.436 | 3471 | 16.4 |
| S3 | 7106 | 141.0 | 0.250 | 0.370 | 3467 | 16.2 |
b) Model simulations
In Exp. 4, for DM and NA at anthesis, of correlation between observation and prediction were 0.23 and 0.56, reaching a significant level ( ) and extremely significant level ( ), respectively (Figure 1 (a), (b)). However, the majority of the DM was underestimated, with a larger deviation toward higher DM. In comparison, a higher consistency existed between the estimation and observation of NA. A similar phenomenon was observed for DM and NA simulations in Exp. 6 compared with those in Exp. 4, while neither of the values reached a significant level ( ) (Figure 1 (c), (d)).
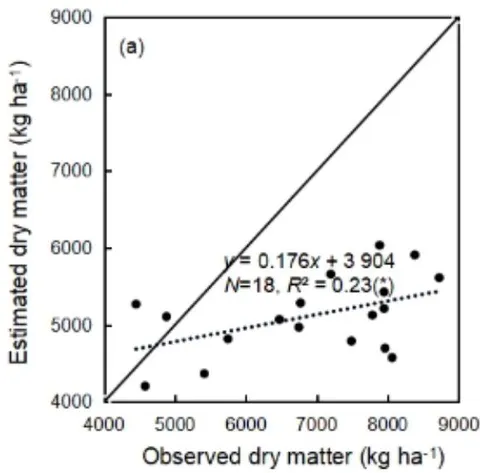
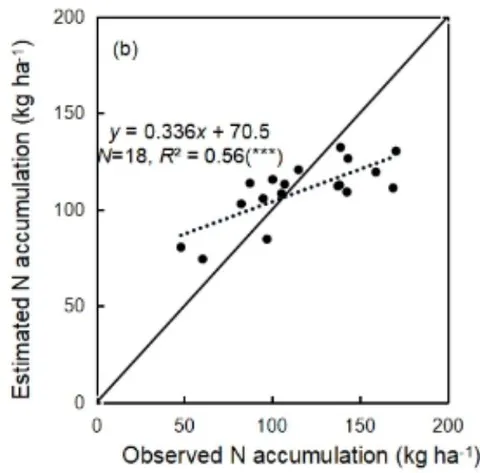
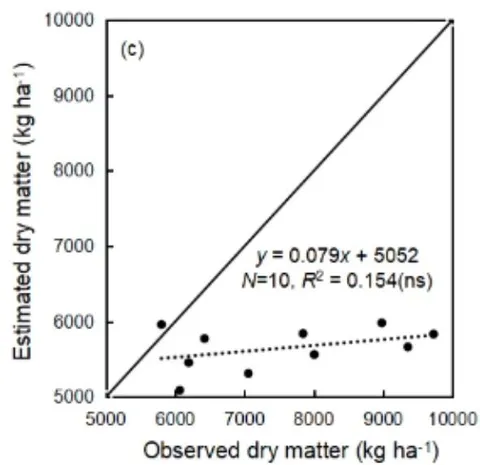
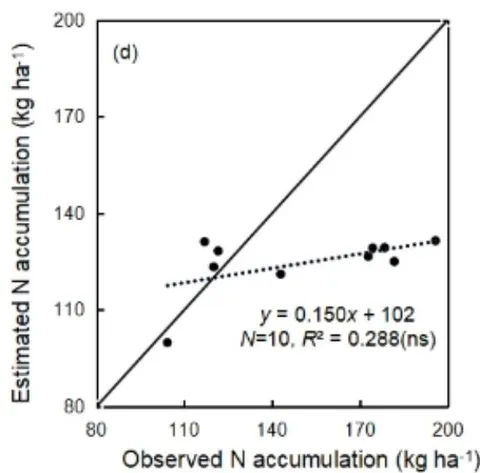
indicates the number of samples. The solid lines represent . The dashed lines are the fitted simple linear regression models with estimation and observed values as dependent and independent variables, respectively. The same as below.
The average GY of Exp. 2 and 3 and identical NF of N2 in Exp. 4 and N3 in Exp. 5 were compared with the accumulated meteorological factor of GY (Figure 2(a)). Exp. 2 and 3 had the highest and lowest GYof 4677 and , respectively, and Exp. 4 and 5 had GY of 4006 and , respectively. Except for an obvious underestimation in Exp. 2, perfectly captured the GY trend of Exp. 3-5. The underestimation was attributed to higher N rates in Exp. 2-3 than in Exp. 4-5, producinga high GY inExp. 2-3. The lowest global radiation during the grain-filling period in Exp. 3 among the four experiments corresponded to higher GYloss compared to the other three experiments (Table 2). Both meteorological factors of post-anthesis transfer coefficients were positively correlated to (Fig.2(b)). had a higher than at 0.90 and 0.84, reaching significant and nonsignificant levels , respectively.
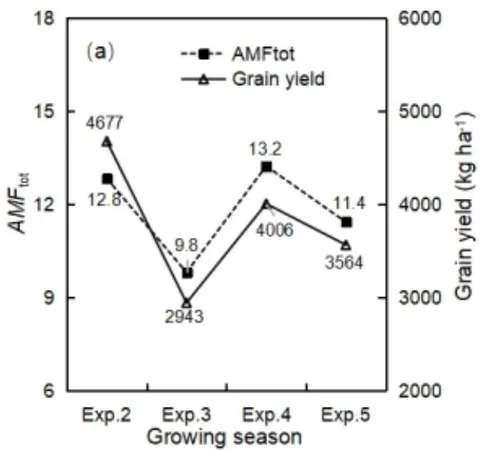
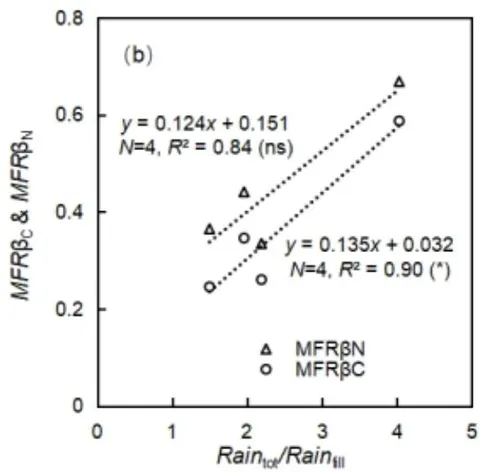
AMF tot indicates accumulated meteorological factors for grain yield; Exp. 2-5 indicate 2004/2005, 2005/2006, 2008/2009, and 2009/2010 growing seasons, respectively; MFR and MFR are the meteorological factors of dry matter and post-anthesis transfer coefficients, respectively; Rain tot /Rain fill, the rainfall ratio of the whole growing season to the period during anthesis and maturity.
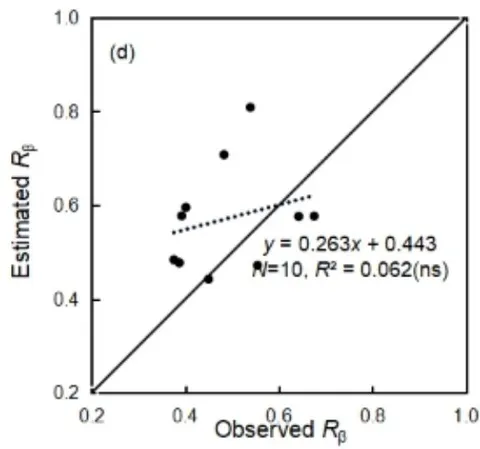
In Exp. 4, for DM and N post-anthesis transfer coefficients, values were similar at approximately 0.56, reaching an extremely significant level ( ) (Figure 3 (a), (b)). All 18 treatments overestimated the DM post-anthesis transfer coefficients. The N post-anthesis transfer coefficient performed much better, except for one apparent underestimation possibly caused by sampling errors. In Exp. 6, neither of the values were significant ( ) (Figure 3 (c), (d)).
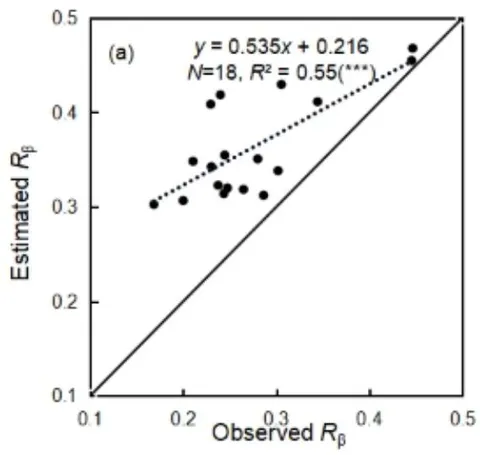
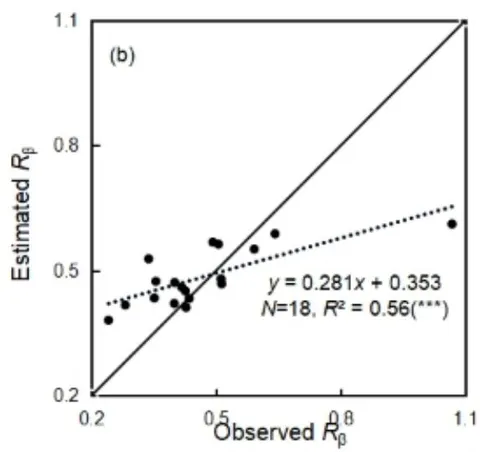
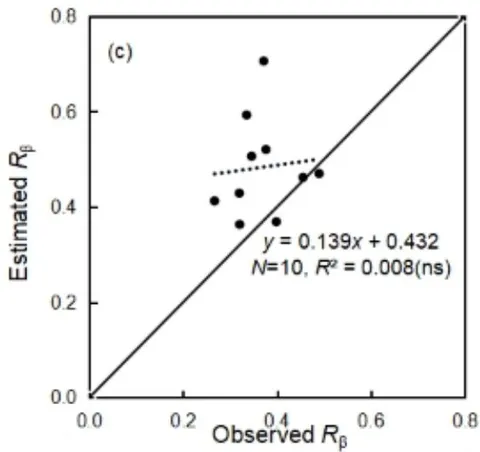
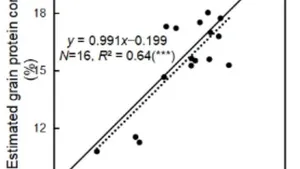
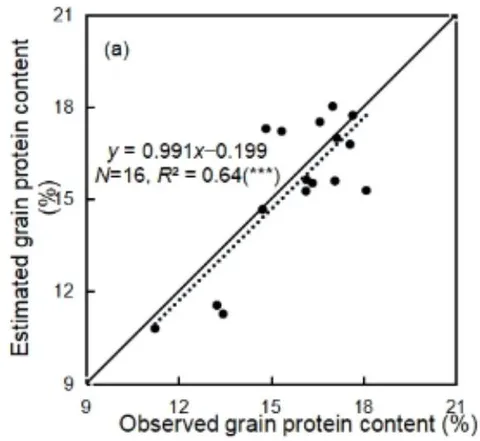
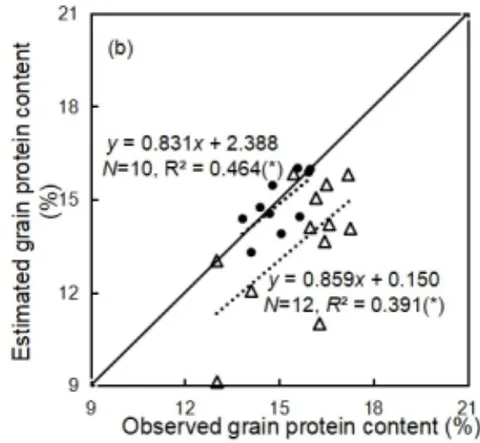
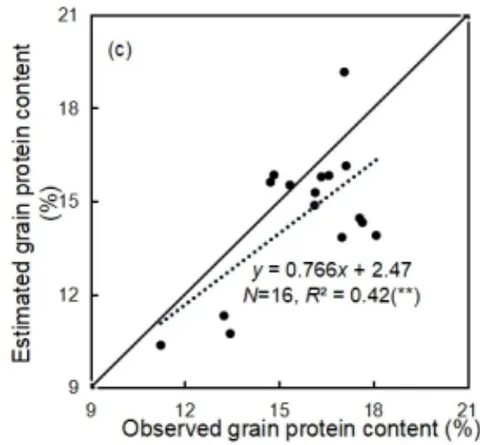
A simple linear model has been widely applied to GPC forecasting because of its convenient application in remote sensing; thus, a simple linear model was established for comparison with leaf nitrogen content at anthesis as an independent variable. In Exp. 6, only 10 treatments of the S1 date, free from weed invasion, were selected as validation data. The and nRMSE of the semi-empirical model for Exp. 4 and 6 and the simple linear model for Exp. 4 were 0.64 and
8.91, 0.45 and 4.50, and 0.42 and 13.3, respectively (Figure 4). The semi-empirical model had higher interannual prediction stability than the linear model, with average deviations of and , respectively. However, under the optimal sowing date and late sowing date conditions in Exp. 4, the GPC tended to be underestimated and overestimated by the semi-empirical model to an extent as high as and , respectively.
V. DISCUSSION
By conducting multi-year field experiments and introducing the climate and soil N effects, the semiempirical GPC prediction model established here fulfilled its intended role of demonstrating superiority over the simple linear model regarding the intra-annual GPC prediction. However, the inner ratio form and empirical method of the modeling also constrained further improvement of GPC prediction accuracy.
a) GPC simulations
The GPC was generally underestimated by both the semi-empirical and the simple linear models. This could be a result of the different climate conditions during the pre-anthesis period for the establishment and validation experiments. A higher precipitation and lower average temperature were observed in the establishing experiment than in the validation experiment. Similar results were obtained in a study conducted in England during 1975–1995 (Smith and Gooding, 1999): GPC was negatively correlated with the rainfall from 31 Dec.-3 Feb. (winter) and 4 Mar.-26 May. (spring). The negative effects of rainfall before anthesis were attributed to the following two aspects: soil nitrogen reserve dilution by vegetative proliferation and soil N loss, and leaf life extension during grain growth favoring carbohydrate assimilation and translocation more than N. Subedi et al. (2007) showed that GPC increased by for all late planting dates, consistent with the sowing date trend effects, as simulated by the semi-empirical model (i.e., overestimation for later sowing conditions and underestimation for optimum sowing conditions).
The semi-empirical model proposed here has a limited dataset in terms of cultivar parameters and growing season experiments, which could be partly compensated by long-term historical climate data to overcome interannual GPC fluctuations with a relatively satisfactory nRMSE below . In comparison, Weiss and Moreno-Sotomayer (2006) reported an nRMSE range of with GPC simulation results of the CERES-Wheat crop model. As illustrated by Pan et al.
(2006a), the meteorological factors affecting GPC were incorporated by genotypic parameters, including a number of traits such as characteristic GPC, physiological vernalization time, temperature sensitivity, photoperiod sensitivity, and rainfall sensitivity. Li et al. (2020) found that the regression coefficients of first-layer models could be used to construct second-layer models and proposed a hierarchical linear modeling method for GPC. The first-layer model was a multilinear model with vegetation growth indices as independent variables. The fitted coefficients, such as intercept and slopes, became the dependent variables for the second-layer model, which is also a multilinear model with otherwise meteorological factors as independent variables.
b) Post-anthesis transfer coefficients and corresponding meteorological factors
Post-anthesis DM and the N transfer coefficient were significantly correlated with SLW and LAI at anthesis, respectively. positively correlated with SLW. In comparison, the correlations between and LAI were negative (Table 1). These results agree with the findings of Hóránnová (1975) and Marini and Barden (1981), who reported that SLW is an important indicator of leaf photosynthetic rate. In addition, the post-anthesis photosynthetic rate is an important factor for GY, as the assimilate contributes at least of the GY at maturity (Bidinger et al., 1977; Wang and Shangguan, 2015). Thus, SLW plays an important role in GY by affecting the intermediate DMpost-anthesis transfer coefficient. In contrast, a higher LAI at anthesis decreased the post-anthesis N-transfer coefficient . In parallel with the findings of Pan et al. (2006b) and Xu et al. (2009), N remobilization from leaves was assumed to decrease with increasing LAI for both wheat and barley. Przulj and Momcilovic (2001) reported that of the N accumulated in wheat grain originates from the translocation in vegetative tissue after anthesis. Halloran (1981) suggested that nitrogen translocation from leaf tissue is more difficult than that from culm or glume tissue. As a result, a larger LAI at anthesis indicates greater nitrogen loss with the senesced leaves at maturity. In contrast, it delays maturity owing to staying green effects.
The relative rainfall portion with regard to pre-anthesis and post-anthesis can considerably determine post-anthesis DM and N assimilation and translocation in the study, which were chosen to establish meteorological factors of post-anthesis transfer coefficients . As shown in Table 1, was both positively and significantly correlated with , and positively correlated with . Identical to the results of Nakagami et al. (2004), who observed relatively low soil moisture conditions during the later growth cycle, heavier wheat DM and GY could be achieved because of the high photosynthesis rate and leaf area during leaf senescence and enhanced root system. Similarly, Soon et al. (2008) showed that the ratio of rainfall in May and June. (the pre-anthesis period for wheat in Canada) compared to the average in history was highly correlated with the amount of remobilized nitrogen. Palta and Fillery (1995) also demonstrated that N remobilization within the plant can provide most of the grain N required to synthesize grain protein under postanthesis water deficit. However, under severe postanthesis water stress, N remobilization is reduced by approximately (Ercoli et al., 2008).
c) Further model improvement
Ideal GPC and yield usually occur under favorable environmental and management conditions, and in most cases, an inverse relationship, known as the "dilution phenomenon," exists between GPC and yield (Soon et al., 2008; Stewart et al., 1990). For some genotypes, high GPC and GY can be achieved, which is called grain protein deviation (Monaghan et al., 2001; Bogard et al., 2010). GPC mostly depends on the relative fluctuations in NA and DM to a greater extent than the corresponding absolute values. Thus, key processes around critical periods are crucial for GPC modeling (Mcmullan et al., 1988). The inaccuracies related to DM estimation were partly correlated with the simplified modules of DM and N uptake and translocation. The current prediction accuracy could be accepted given that the model is used to predict regional GPC before harvest and assist graded purchases for processing enterprises. Particularly, this holds true for Exp. 6 where the majority of different cultivars were introduced but with good model performance, suggesting a sound theoretical basis and regional application prospect. However, more field experiments should be carried out to improve the DM and N flow modules by incorporating specific meteorological factors for critical stages or adopting multi-factor regression. Comparing the prediction nRMSE of 6.87 by Li et al. (2020) with two-layer multifactor regression models and considering the cultivar effects, the semi-empirical model showed a larger annual prediction nRMSE at 8.91 and 4.50 and needs further improvement.
VI. CONCLUSION
The priority task of establishing the semiempirical GPC model was to realize prediction ahead of maturity with higher accuracy. Anthesis was deemed suitable for the ahead-of-time prediction stage, which ends vegetative growth and launches the grain filling period, whereby the whole growth period was divided into pre-anthesis and post-anthesis periods. The DM and NA and translocation involved in the two periods were separately modeled based on the experimental data. Parameters such as LAI, SLW, and CLND, mainly acquired at the anthesis stage, were adopted as independent variables for the sub-model establishment. Meteorological factors were defined and calculated for prediction and reference growing seasons, and the ratio of meteorological factors involved in the two growing seasons was assumed to be climate effects, which were incorporated into relevant modeling. With independent evaluation data from two growing seasons, the semi-empirical GPC model performed better with normalized nRMS Values of 8.91 and 4.50. Interannual uncertainty accompanied by a simple linear model was overcome with the semi-empirical model, which shows a promising future when combined with remote sensing technology. However, complex physiological processes involved with DM and NA and translocation were simplified with empirical equations by the study, which constrains the model prediction accuracy. More experiments should be conducted to determine critical parameters for key growth processes affecting GPC.
ACKNOWLEDGEMENTS
This research was financially supported by the National Nature Science Foundation (Grant No. 41171281), and was helped and advised by H. Chang, W. G. Li, Research scientist Z. H. Ma and J. H. Guo, PhD.
X. S. Luo, H. L. Tang, and Y. K. Zhang for their. On the occasion, the authors would also like to thank everyone.
Competing interests
The authors declare there are no competing interests.
Author contribution
Q. Wang: Conceptualization, Formal analysis, Investigation, Methodology, Writing-original draft. Cunjun Li: Funding acquisition, Supervision, Investigation. Yuan-fang Huang: Supervision, Writing-review & editing. Wu-de Yang: Methodology, Writing-review & editing. Wen-jiang Huang: Project administration, Investigation. Ji-hua Wang: Supervision, Funding acquisition, Writing-review & editing.
Data availability statement
Primary data were stored in the database of the institute if they agreed that they could be accessed.