Fish farming can help meet the ever-increasing demand for seafood and offer nutritious protein to people in underdeveloped countries, while additionally minimizing pressure on wild fish. The global population is supported economically by the fishing industry and related sectors for 10-12% of the total. Presently, cutting-edge technologies such as AI, Machine Learning, Automated Planning, Data Analytics, and IoT are being used in fish farming to increase production, efficiency, and sustainability. In this research, we proposed an IoT-based improved technique for fish feeding and monitoring that will enhance the efficiency of fish farming and increase production while avoiding threats to the environment. This proposed approach uses a microcontroller ESP32 that gathers data from temperature, turbidity, pH, and ultrasonic sensors, alongside a Wi-Fi webcam detecting fish movement. It will be linked to the Blynk app, which gathers and sends this data, informing users about water conditions.
## I. INTRODUCTION
In the last 50 years, global fish production has surged, with aquaculture now surpassing wild catch, underscoring its vital role in meeting the rising demand for protein-rich food amid dwindling wild fish stocks. Approximately 700 million people keep fish in tanks, aquariums, or ponds worldwide for aesthetic, economical, or protein purposes. The bulk of fish keepers are focused on upholding the water quality and
feeding system, which must be done on time each day [1]. Yet, struggle to feed due to the inefficiency of time, which may cause fish to be under stress and fish mortality. One technological development that can help fish keepers with these problems in the rapidly evolving digital world is the Internet of Things (IoT).
IoT is an idea that allows for effective data interchange and control by tying up various physical objects, sensors, and computer systems via an internet network [2]. An automated fish feeder may be utilized to ensure adequate feeding at specified times while also monitoring and maintaining the environment suitably. For example, whenever the pH level and temperature of the waterfall are below the minimal values, an automated system should be present to fix the water parameters issues [3]. A concept for feeding fish through the Internet of Things has been released, however, they neglected to include a water monitoring system, which is crucial [4]. Fish are extremely sensitive to alterations in the water's purity. Monitoring variables including pH, dissolved oxygen, temperature, nitrate levels, and ammonia levels helps guarantee that the aquatic environment is still conducive to the health and welfare of the fish.
In light of this sensation of fish, [5-7] has suggested a system to enable the Internet of Things-based smart monitoring for fish farming in one of the earliest and most conventional forms of aquaculture which is pond farming. Economic progress is aided by this pond farming, yet pond aquaculture is also highly costly. Considering raising fish as a leisure activity, some prefer to maintain them in aquariums rather than ponds.
Fish aquarium maintenance is a challenging task that involves cleaning and feeding among other things. Important parts of this method include turning off the power head of the aquarium, feeding by hand, and restarting the air circulation afterward [8]. To decrease the need for manual feeding and observation an automated aquarium with two ultrasonic sensors: one for the fish tank and the other for the feedback was developed research. If either of the sensors detects low levels, the user will be notified via an app and instructed to take appropriate action [9]. Overfeeding needs to be addressed because it might lead to water pollution. To prevent water degradation and guarantee fish welfare, authorities should give priority to activities like
illumination maintenance, water replenishment, and attending to various details.
This study focuses on IoT-based fish feeding using the ESP32 microcontroller integrated with a Wi-Fi module. Sensors and the Blynk app facilitate remote monitoring of aquariums, allowing owners to check parameters like pH, temperature, water level, and clarity. A webcam provides real-time views, and a water pump automates water replenishment. Despite occasional internet connectivity issues causing delays, the system effectively monitors and feeds aquarium fish.
The main objective of our proposed prototype is to deliver meticulous care for the aquatic inhabitants by leveraging IoT technology. This includes monitoring the fish's movement, observing water conditions suitable for their well-being, and automatically adjusting or replacing the water if it is not optimal.
The list of prior initiatives for an Internet of Things-based smart aquarium monitoring system is displayed in Table 1 in which this research has filled in the gaps. The last portion of this table shows the contributions made throughout the investigation.
Table 1: Analyzing Previous Studies and this Research
<table><tr><td>Research</td><td>Servo Motor</td><td>Temperature Sensor</td><td>Water level check sensor</td><td>Turbidity sensor</td><td>pH sensor</td><td>NodeMCU</td><td>Water pump</td><td>Web cam</td></tr><tr><td>[1]</td><td>Yes</td><td>No</td><td>Yes</td><td>No</td><td>No</td><td>Esp8266</td><td>No</td><td>No</td></tr><tr><td>[2]</td><td>Yes</td><td>Yes</td><td>No</td><td>No</td><td>Yes</td><td>No</td><td>No</td><td>No</td></tr><tr><td>[3]</td><td>Yes</td><td>Yes</td><td>Yes</td><td>No</td><td>Yes</td><td>Esp32</td><td>Yes</td><td>Yes</td></tr><tr><td>[4]</td><td>Yes</td><td>Yes</td><td>No</td><td>Yes</td><td>Yes</td><td>No</td><td>No</td><td>No</td></tr><tr><td>[5]</td><td>No</td><td>Yes</td><td>No</td><td>Yes</td><td>Yes</td><td>Esp8266</td><td>No</td><td>No</td></tr><tr><td>[6]</td><td>No</td><td>Yes</td><td>Yes</td><td>Yes</td><td>Yes</td><td>No</td><td>No</td><td>No</td></tr><tr><td>[7]</td><td>No</td><td>Yes</td><td>No</td><td>No</td><td>Yes</td><td>Esp8266</td><td>Yes</td><td>No</td></tr><tr><td>[8]</td><td>Yes</td><td>Yes</td><td>Yes</td><td>Yes</td><td>Yes</td><td>Esp8266</td><td>No</td><td>No</td></tr><tr><td>[9]</td><td>Yes</td><td>Yes</td><td>Yes</td><td>No</td><td>No</td><td>Esp8266</td><td>No</td><td>No</td></tr><tr><td>Proposed
Prototype</td><td>Yes</td><td>Yes</td><td>Yes</td><td>Yes</td><td>Yes</td><td>Esp32</td><td>Yes</td><td>Yes</td></tr></table>
This research synthesizes the constraints identified in existing research to inform the direction of our study. By integrating insights from prior work, we aim to address gaps and advance understanding in our field which is the merit of this research. Also, this proposed prototype has the enticing feature of being able to use the Internet of Things to replace and replenish water in the event of contamination while also tracking the movement of the fish.
## II. RELATED WORK
In the process of developing this work, we conducted a comprehensive analysis of recent research articles. These scholarly papers serve as invaluable resources, offering our project a wealth of insightful information that encapsulates the forefront of current research within our field. Through diligent examination and scrutiny of these articles, we have fortified our understanding and enhanced the execution of our work, thereby ensuring that we are positioned at the leading edge of innovation and knowledge advancement in our domain.
To enhance aquatic lives a sensor-equipped real-time monitoring system was presented by Balaji et al. [10]. Nevertheless, neither Wi-Fi modules nor fish-feeding functionality were included in their system. Its lack of these qualities may limit its usefulness in some applications, even with its sensor-based monitoring
capabilities. Authors [11] used a Raspberry Pi to develop a mobile application-based method for self-feeding, to enable self-feeding, this approach combines a Raspberry Pi with a mobile application. It lacks the vital sensors needed to monitor the water. In 2019, Cheng et al. [12] utilized Arduino and esp8266 for temperature and water quality monitoring. The pH sensor, which is crucial for fish health, was not used in this study. The design and development of an automatic fish feeder system with various sensors were proposed by Izzeldin et al. [13], however, they could not measure the water temperature and alter the water. The feeding method used by the authors [14] correctly scheduled fish meals and had a $1\%$ error rate. Bin et al. [15] employed a system with remote water monitoring with pH and ultrasonic sensors. They lacked a turbidity and temperature sensor. A turbidity sensor is used in the automated aquarium system that the authors of [16] built but they didn't make extensive use of the other required sensors. Shweta et al. [17], designed an IoT Smart Fish Tank with customizable feeding and water change scheduling but they didn't use a temperature sensor which is important for fish farming. Conversely, though, Albert et al. [18], proposed a system that didn't address issues like scalability, data security, and power consumption. In 2020a study suggested an IoT-based smart aquarium prototype with NodeMCU and Arduino MEGA controllers for smartphone-controlled fish feeding
and pH monitoring. It aimed to maintain optimal pH levels for specific fish types. Using an analog pH sensor, the result is shown on a liquid crystal display (LCD) [19]. Murizahet al. [20] developed an IoT System for dynamic fish feeders based on fish existence for agriculture aquaponics breeders.
Their system included waterproof ultrasonic sensors, humidity sensors, and ultrasonic sensors. They lacked a pH and temperature sensor as well as a means for restoring or changing the water. An autonomous fish feeder was created by Shafie et al. [21] using a real-time clock. For timed feeding, this method ignores the use of sensors in favor of a real-time clock mechanism that offers more functionality and flexibility. A wireless sensor network was proposed by Chen et al. [22] to simulate circumstances found in fish farms. With the use of technology and sensors, they can detect temperature, measure water level, calculate pH, and calculate the amount of dissolved oxygen. When the dissolved oxygen value falls below the range the central processing system will automatically send a signal to start the load to improve the amount of dissolved oxygen in the water by inflator and when the temperature drops, the heater automatically increases the temperature. They could not detect fish movement and lacked a technique for changing or restoring the water. In 2019, Abdullah et al. [23] suggested a smart feeder monitoring system for automated and manual fish feeding. It focuses on small-scale breeders with few employees and information on fish pellet intake. For development, Firebase and Arduino Uno are utilized. The study assesses the benefits of the system over manual data feeding and storage techniques. They didn't employ several of the required sensors. A smart aquarium architecture was developed by Hafid et al. [24] and incorporates hardware with sensors providing data to mega 328 microcontrollers. It makes use of sensors for light, humidity, and water levels. The software provides an online interface for aquaponics system monitoring. Another aquaculture 4.0 was created by European research projects. They employed PROTEUS sensors for Internet of Things (IoT)-based water monitoring, which was economical in Ghana's WAZIUP case and ecologically benign and clever in the IMPAQT project [25]. Haryanto et al. [26] developed a smart aquaponics system featuring a mobile app for water monitoring. Despite its capabilities, the system fell short in detecting fish movement. IOT-based fish feeders and monitoring systems were introduced in [27-30]. They were mainly focused on feeding and food storage. They have not focused on water monitoring.
This research has made an effort to get over the aforementioned constraints and flaws. Separate sensors are lacking in separate research. Certain papers have excessive costs, some don't have a water monitoring system, and some are manual systems without IoT. This
project has combined all these constraints to overcome each one and enhance its efficiency.
## III. PROPOSED METHOD
The proposed IoT-based fish feeder system seeks to provide an affordable, efficient, and observant means of providing fish with food in aquaculture environments. To automate the feeding of fish, this system combines hardware and software components, resulting in accurate feeding and decreased labor needs. Since water temperature is crucial to fish rearing, the temperature sensor measures the water's temperature in Celsius. It should continue to be between 25 and 28 degrees Celsius. A turbidity sensor gauges how hazy the water is. Obstacles such as food waste or fish waste can cause cloudiness in the water. There shouldn't be more than eight NTUs (Nephelometric Turbidity Units) of cloudiness. The water's distance is measured by the ultrasonic sensor, which aids in estimating the water level. The aquarium needs to be filled with new water as the distance increases, as this indicates that the water level is dropping. Since fish farming is now one of the main sources of seafood production, the pH and other mechanisms utilized in this work aim to be used in aquaculture, or bigger surfaces.
Figure 1 depicts the overall design of the suggested IoT-based fish feeding and monitoring system for fish rearing. The first step in operating the system is to launch the Blynk app. From there, the motor can be rotated and dispense food by pushing the ON button on the Blynk app. The temperature, turbidity, PH, and ultrasonic sensor information will be shown on the Blynk app too. The water's state can be determined after examining all the data. Water may be changed using a servo motor via the Blynk app once the water's quality is assessed by the turbidity sensor.
### a) System Model
The project underwent extensive planning before moving into its practical phase. The circuit layout was carefully followed by the hardware components, and cables from the servo motor were used to connect the Arduino Uno to the temperature and turbidity sensors. Effective power and ground connections on the bread board were guaranteed by a shortcircuit. After that, the code was uploaded to the Arduino IDE, fusing the separate programs for every part. The hardware operated smoothly as soon as it was deployed, turning on the servo motor continuously and showing real-time sensor readings on the serial monitor of the Arduino IDE.
Subsequently, the emphasis turned to creating an interface for the Blynk app on smartphones. A button and gauge were integrated to show the analysis of water condition and send commands to the servo motor. A critical step after the design stage was connecting the ESP 32 to the Blynk app so that sensor data could be
transmitted and stored. The user's commands to rotate the motor for fish feeding and changing water were made easier with the ESP 32.
The synchronization between the hardware and software is depicted in Figure 2. The user can quickly
check the water quality by logging into his mobile device. Additionally, a notice system will be in place for when the quality of the water deteriorates.
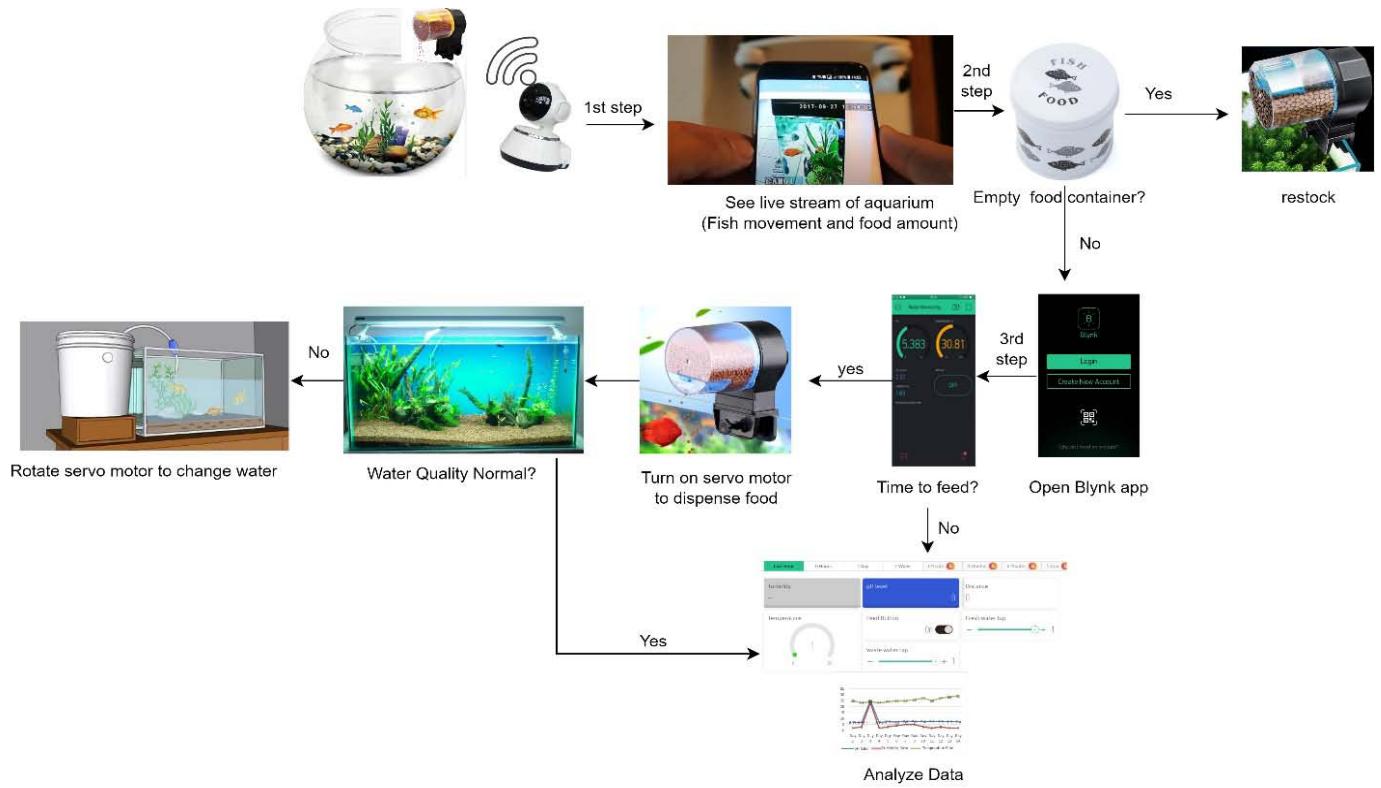
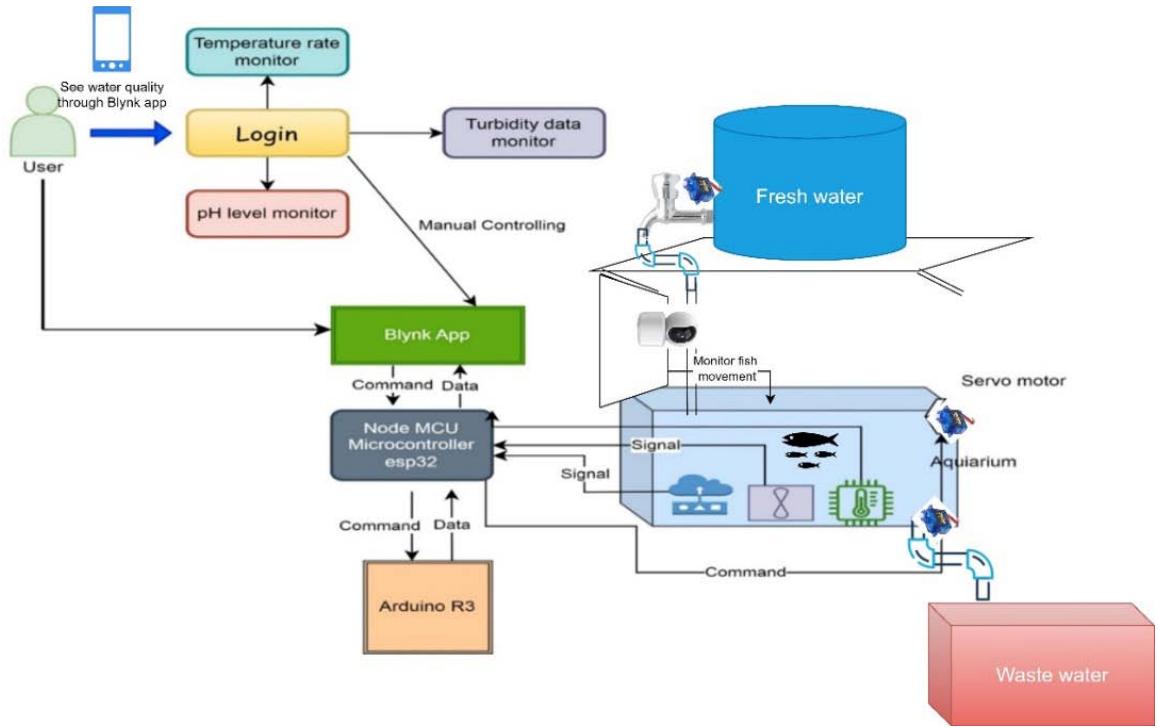
Figure 1: System Design of the Proposed Structure
With the aid of all these characteristics, a user can raise healthy fish without worrying about how he will care for them when he is away from home. Let's provide a clearer demonstration of the system model.
## i. Hardware Design
The project commenced its practical phase following comprehensive preparations. Every component of the hardware was assembled in accordance with the circuit schematic. Subsequently, the temperature sensor and turbidity sensor were connected to the Arduino Uno through cables originating from the servo motor. To establish a power source and ground connection for both rows of the breadboard, a short circuit was constructed at the power and ground points. All the hardware used in this project played an important role in overcoming the obstacles of other research.
1. Temperature sensor: The TMP36 is a low voltage, precision centigrade temperature sensor. It provides a voltage output that is linearly proportional to the Celsius temperature. This sensor has measured the temperature of the water where the fish are kept. The perfect water temperature for fish is around $25^{\circ}$ Celsius to $27^{\circ}$ Celsius.
2. Turbidity Sensor: DC5V has determined the turbidity of a liquid solution, this turbidity sensor uses an optical approach. A turbidity sensor is used to detect the clearness of water. As healthy fish need a healthy environment, for rearing fish the turbidity level of water should not be more than 8 NTU (Nephelometric Turbidity Units) of cloudiness.
3. Waterproof Ultrasonic Distance Sensor: MOD-00231 sensor is used to detect the water level. It detects the water level in the aquarium so that the owner of the aquarium can change the water according to the result.
4. pH sensor: The pH sensor is used to measure the pH level of water. The main motive for using the pH sensor is implementing it when the proposed project is taken to the next level like fish farming. For aquariums, pH can be avoided as the water quality has already been measured through the turbidity sensor.
5. Servo motor: There have been three servo motors utilized in this project. The first is for turning the food container around. The second one is for clearing the way to dump the effluent. The third one will open the pathway that will allow fresh water to enter the aquarium must be opened as the final step.
6. Wi-Fi webcam: The purpose of applying the V380 Wi-Fi Camera 720P is to monitor fish movement, whether they are alive or not.
Figure 3 shows the conceptual framework of the proposed project:
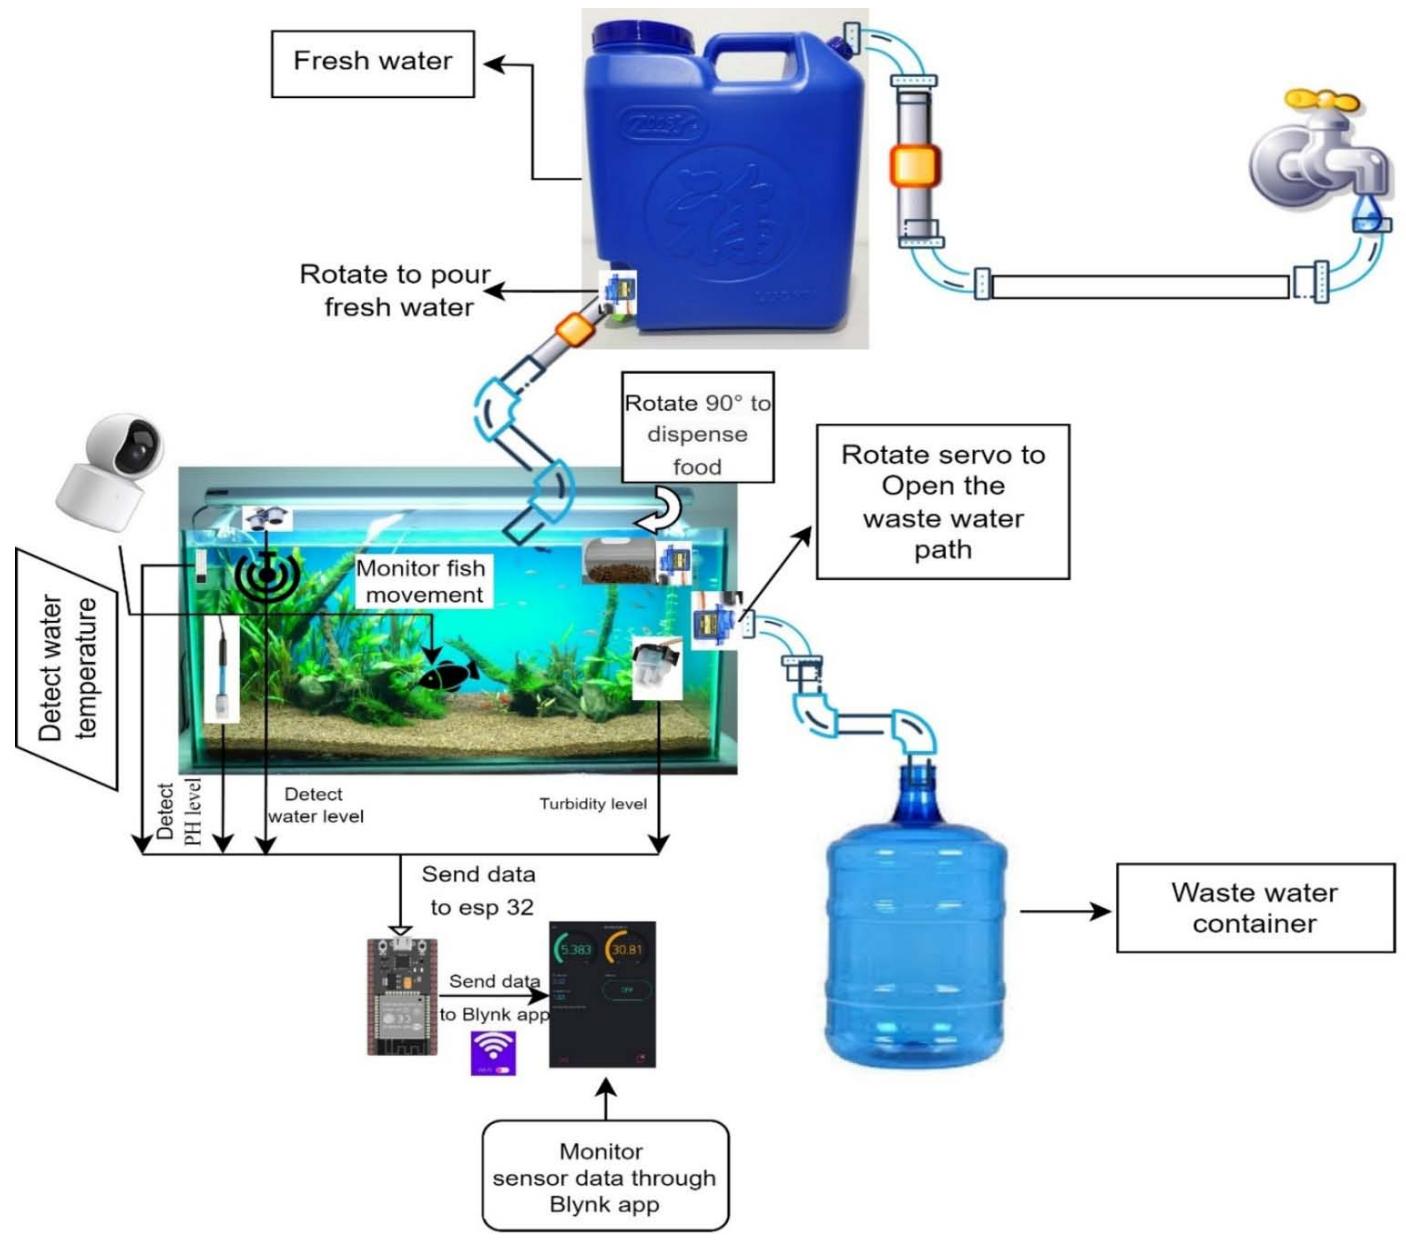
Figure 3: Hardware Design of the Proposed Structure
## ii. Circuit layout
The team meticulously created a circuit design, taking into consideration all the nuances of the procedure, to guarantee accurate and flawless hardware connections. Tinker CAD's use was crucial in increasing output and simplifying tasks since it made it possible to pre-design each connection. The accompanying graphic meticulously presents the circuit schematic (see Figure 4), a visual depiction of the electronic layout of the project. This calculated technique improved overall productivity and simplicity of labor in addition to enabling precise hardware connections.
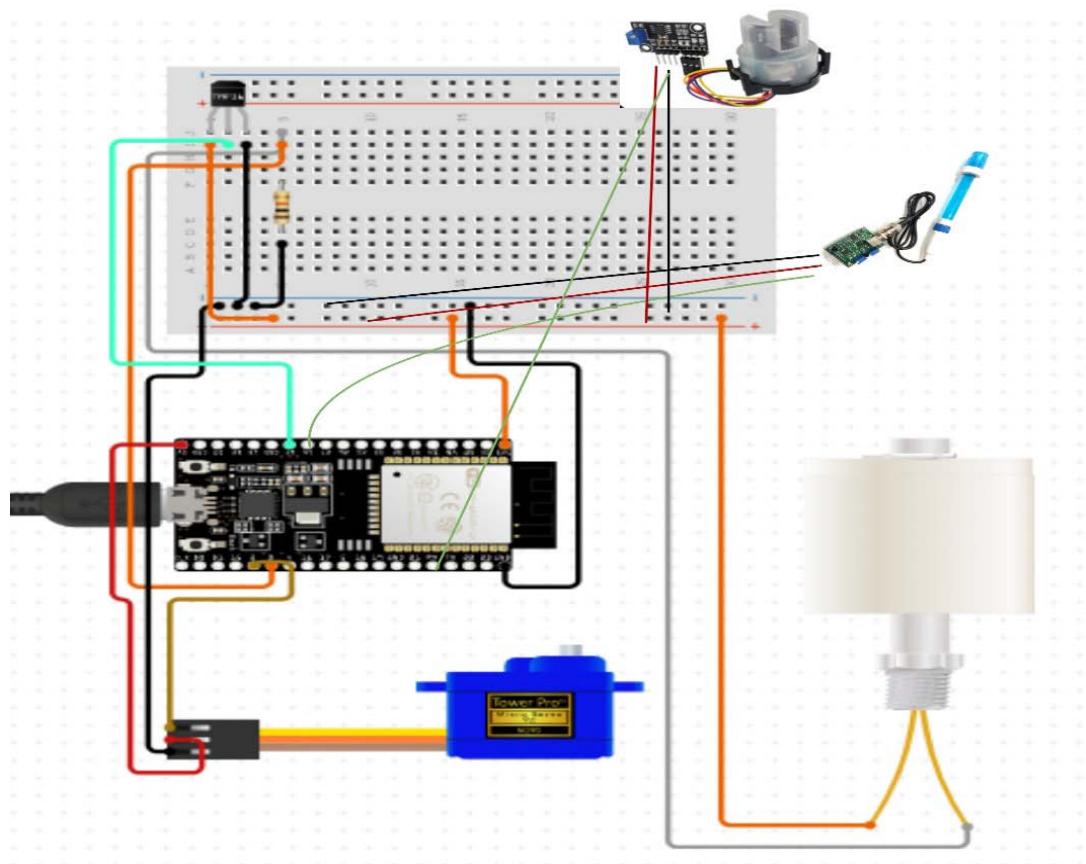
Figure 4: Circuit Diagram of Proposed System
## iii. Software Implementation
Blynk, designed for the Internet of Things, facilitates storage, visualization, and remote operation of hardware, including sensor data display. The app offers diverse widgets for creating impressive project interfaces, with communication between the smartphone and hardware managed by the Blynk Server. This built-in program has switches, gauges, and other features as shown in Figure5, that let the owner customize the surface to their choice and needs. After the hardware was connected to the Blynk app, which allowed the user to operate the aquarium and get real-time water condition updates, this system truly came to life.
The installation of software links for the Internet of Things-based fish feeding and monitoring system was a major advancement, taking the research to a new level of accuracy. This project included learning the nuances of Blynk app creation for the smartphone interface in addition to creating and uploading code into the Arduino IDE. To put it simply, the addition of software connections increased the project's level of complexity and guaranteed that the fish feeding and monitoring system functioned with a high level of precision, responsiveness, and controllability. During this stage, hardware and software came together to provide a comprehensive and effective Internet of Things solution for managing aquatic habitats.
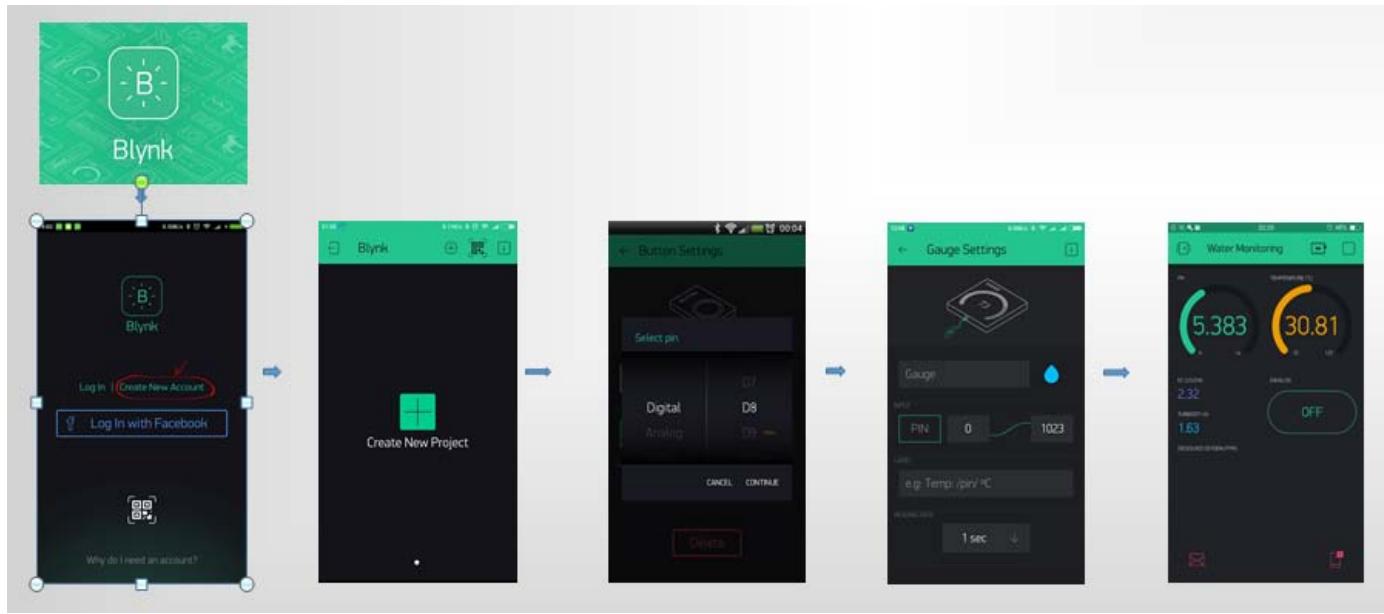
Figure 5: Blynk App Setting and Interface
## IV. RESULT
The superiority of this research lies in developing a user-friendly system equipped with all essential tools and sensors for comprehensive fish and water monitoring. Its most unique feature is that it possesses the capability to track fish movement with precision while simultaneously ensuring water replenishment through meticulous examination of both label information and water quality parameters. This section presents the results of the experiments carried out to evaluate the performance of the proposed system. These outcomes rely on two categories of analysis. Among them are the following:
1. Based on waiting time.
2. Based on success or error rate.
### a) Waiting Time
Some of these analyses give results on the waiting time such as the Wi-Fi connection, servo motors rotation, and turbidity testing. A concise explanation is given in the following tables:
## i. Testing of Wi-Fi Connection to NodeMCU ESP32
Test Wi-Fi connections to a NodeMCU ESP32 were examined with intervals of waiting, and the outcomes of the assessment are delineated in Table 2.
Table 2: Testing the ESP32's Wi-Fi Connectivity
<table><tr><td>Testing</td><td>Condition</td><td>Waiting Time (s)</td><td>Accuracy (%)</td></tr><tr><td>1stTest</td><td>Connected</td><td>5</td><td>Medium</td></tr><tr><td>2ndTest</td><td>Connected</td><td>4</td><td>Good</td></tr><tr><td>3rdTest</td><td>Connected</td><td>6</td><td>Medium</td></tr><tr><td>4thTest</td><td>Connected</td><td>3</td><td>Good</td></tr><tr><td>5thTest</td><td>Connected</td><td>4</td><td>Good</td></tr><tr><td>6thTest</td><td>Connected</td><td>4</td><td>Good</td></tr><tr><td>7thTest</td><td>Connected</td><td>5</td><td>Medium</td></tr><tr><td>………</td><td>………</td><td>……</td><td>……</td></tr><tr><td>15thTest</td><td>Connected</td><td>5</td><td>Medium</td></tr></table>
## ii. Servo motor for feeding
The Servo motor can feed successfully at a $90^{\circ}$ - $0^{\circ}$ angle which is shown in Table 3. The pivotal component of this system, the servo motor, has proven to be highly effective in facilitating successful feeding at a versatile range of angles, specifically within the $90^{\circ}$ - $0^{\circ}$ spectrum.
Table 3: Servo Motor Testing for Feeding
<table><tr><td>Testing</td><td>Condition</td><td>Waiting time(s) of Servo motors</td><td>Servomotor angle</td></tr><tr><td>1st</td><td>Successful feeding</td><td>4</td><td>90°- 0°</td></tr><tr><td>2nd</td><td>Successful feeding</td><td>3</td><td>90°- 0°</td></tr><tr><td>3rd</td><td>Successful feeding</td><td>2</td><td>90°- 0°</td></tr><tr><td>4th</td><td>Successful feeding</td><td>5</td><td>90°- 0°</td></tr><tr><td>5th</td><td>Successful feeding</td><td>4</td><td>90°- 0°</td></tr><tr><td>6th</td><td>Successful feeding</td><td>3</td><td>90°- 0°</td></tr><tr><td>7th</td><td>Successful feeding</td><td>4</td><td>90°- 0°</td></tr><tr><td>......</td><td>Successful feeding</td><td>......</td><td>......</td></tr><tr><td>15th</td><td>Successful feeding</td><td>3</td><td>90°- 0°</td></tr></table>
## iii. Water-Changing Servo Motors
To change the water, two servo motors successfully rotated. The cork opens and allows water to fall into the second container beneath the aquarium when the motor rotates from $90^{\circ}$ to $0^{\circ}$. Subsequently, an
additional servo motor will be turned, allowing the container situated above the aquarium to open and allow water to fall into it. Table 4indicates that the waiting time affects how well the outcomes are produced.
Table 4: Testing the Water-Changing Servo Motor
<table><tr><td>Testing</td><td>Condition</td><td>Waiting Time (s)</td><td>Servo motor angle</td></tr><tr><td>1st</td><td>Successful water change</td><td>2</td><td>90°- 0°</td></tr><tr><td>2nd</td><td>Successful water change</td><td>3</td><td>90°- 0°</td></tr><tr><td>3rd</td><td>Successful water change</td><td>4</td><td>90°- 0°</td></tr><tr><td>4th</td><td>Successful water change</td><td>2</td><td>90°- 0°</td></tr><tr><td>5th</td><td>Successful water change</td><td>4</td><td>90°- 0°</td></tr><tr><td>6th</td><td>Successful water change</td><td>2</td><td>90°- 0°</td></tr><tr><td>7th</td><td>Successful water change</td><td>3</td><td>90°- 0°</td></tr><tr><td>......</td><td>Successful water change</td><td>......</td><td>......</td></tr><tr><td>15th</td><td>Successful water change</td><td>4</td><td>90°- 0°</td></tr></table>
## iv. Turbidity Sensor Testing
An extensive analysis of the results is given in Table 5. The overall environmental conditions of the fish aquarium can be evaluated using this data as a useful indication. This integrated turbidity sensor has been very
helpful in determining the water's quality. In contaminated water, fish cannot survive. The purpose of this sensor is to guarantee that the fish remains in clean water. Figure 6 shows the turbidity rate over 15 days through a chart.
Table 5: Testing Turbidity Sensor
<table><tr><td>Testing</td><td>Water-Condition (NTU)</td><td>Waiting time(s)</td><td>Accuracy (%)</td></tr><tr><td>Day 1</td><td>2.4</td><td>4</td><td>Good</td></tr><tr><td>Day 2</td><td>2.6</td><td>3</td><td>Medium</td></tr><tr><td>Day 3</td><td>2.6</td><td>2</td><td>Medium</td></tr><tr><td>Day 4</td><td>2.7</td><td>5</td><td>Good</td></tr><tr><td>Day 5</td><td>2.7</td><td>4</td><td>Medium</td></tr><tr><td>Day 6</td><td>2.9</td><td>3</td><td>Good</td></tr><tr><td>Day 7</td><td>2.0</td><td>4</td><td>Medium</td></tr><tr><td>………</td><td>………</td><td>………</td><td>………</td></tr><tr><td>Day 15</td><td>2.8</td><td>3</td><td>Medium</td></tr></table>
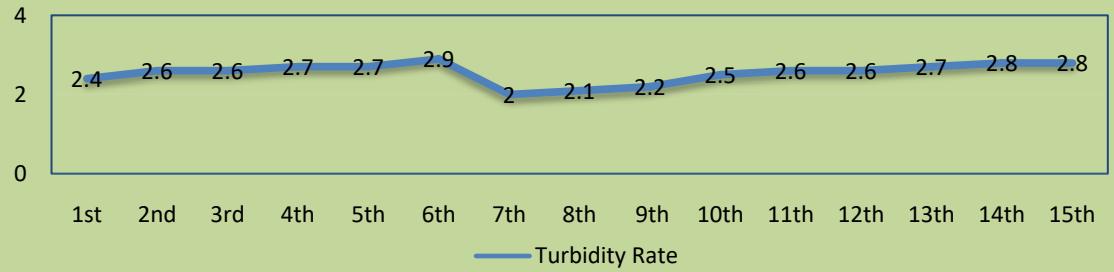
Analyzing Turbidity Rate Figure 6: Turbidity Rate Chart
### b) Result Based on Success or Error Rate
By the aqueous state's efficacy or error ratio, the temperature, JSN-SR04T sensor, and pH sensors yield discernment.
## i. Evaluation of pH in Water
A comparison is made between the sensor data and the digital pH meter displayed in Table 6. The
results of testing the pH sensor for the acidity (pH) meter throughout 15 tests indicate that the biggest error value is $7.59\%$ and the smallest value is $0\%$.
This test's objectives are to calibrate the pH sensor and gauge the water's acidity in the aquarium or container. The pH rate during the 15 days is displayed in Figure 7.
Table 6: Testing the pH Sensor
<table><tr><td>Testing</td><td>pH sensor</td><td>Digital pH meter</td><td>Success (%)</td><td>Error (%)</td></tr><tr><td>1st</td><td>6.6</td><td>6.68</td><td>98.80</td><td>1.19</td></tr><tr><td>2nd</td><td>6.71</td><td>6.82</td><td>98.39</td><td>1.61</td></tr><tr><td>3rd</td><td>6.75</td><td>6.9</td><td>97.82</td><td>2.17</td></tr><tr><td>4th</td><td>6.83</td><td>7</td><td>97.57</td><td>2.43</td></tr><tr><td>5th</td><td>7.30</td><td>7.9</td><td>92.41</td><td>7.59</td></tr><tr><td>6th</td><td>7.60</td><td>7.60</td><td>100</td><td>0</td></tr><tr><td>7th</td><td>7.60</td><td>7.60</td><td>100</td><td>0</td></tr><tr><td>……</td><td>……</td><td>……</td><td>……</td><td>……</td></tr><tr><td>15th</td><td>7.51</td><td>7.6</td><td>98.82</td><td>1.18</td></tr></table>
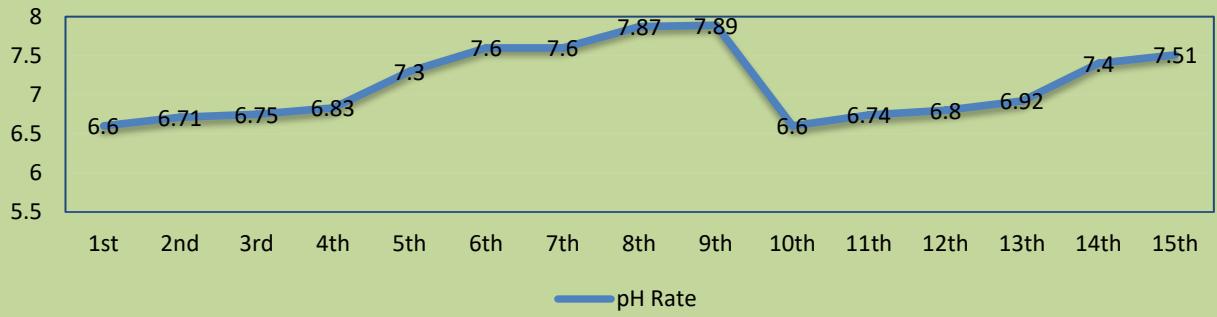
Analyzing pH Rate Figure 7: pH Rate Chart
## ii. Temperature Sensor Testing
Temperature sensor data, which has been painstakingly documented and organized in Table 7, offers important insights into the ideal temperature maintenance that this system achieves. Based on Table 7, the results of testing the temperature sensor over the 15 tests show that the biggest error value is $4.95\%$ and the smallest value is $0\%$.
The accurate measurement of water temperature is greatly aided by this built-in temperature sensor. The water must be at the proper temperature for the fish. The chart of Figure 8 shows the temperature during the 15 days, expressed in degrees Celsius.
Table 7: Testing Temperature Sensor
<table><tr><td>Testing</td><td>Temperature sensor</td><td>Digital Thermometer</td><td>Success(%)</td><td>Error(%)</td></tr><tr><td>1st</td><td>28 °C</td><td>27.2 °C</td><td>97.14</td><td>2.85</td></tr><tr><td>2nd</td><td>27 °C</td><td>27 °C</td><td>100</td><td>0</td></tr><tr><td>3rd</td><td>25 °C</td><td>26 °C</td><td>96.2</td><td>3.8</td></tr><tr><td>4th</td><td>26 °C</td><td>26.5 °C</td><td>98.11</td><td>1.89</td></tr><tr><td>5th</td><td>26 °C</td><td>25 °C</td><td>96.15</td><td>3.85</td></tr><tr><td>6th</td><td>26.3 °C</td><td>26.3</td><td>100</td><td>0</td></tr><tr><td>7th</td><td>26.3 °C</td><td>25 °C</td><td>95.06</td><td>4.95</td></tr><tr><td>……</td><td>……</td><td>……</td><td>……</td><td>……</td></tr><tr><td>15th</td><td>27</td><td>26.1 °C</td><td>96.7</td><td>3.3</td></tr></table>
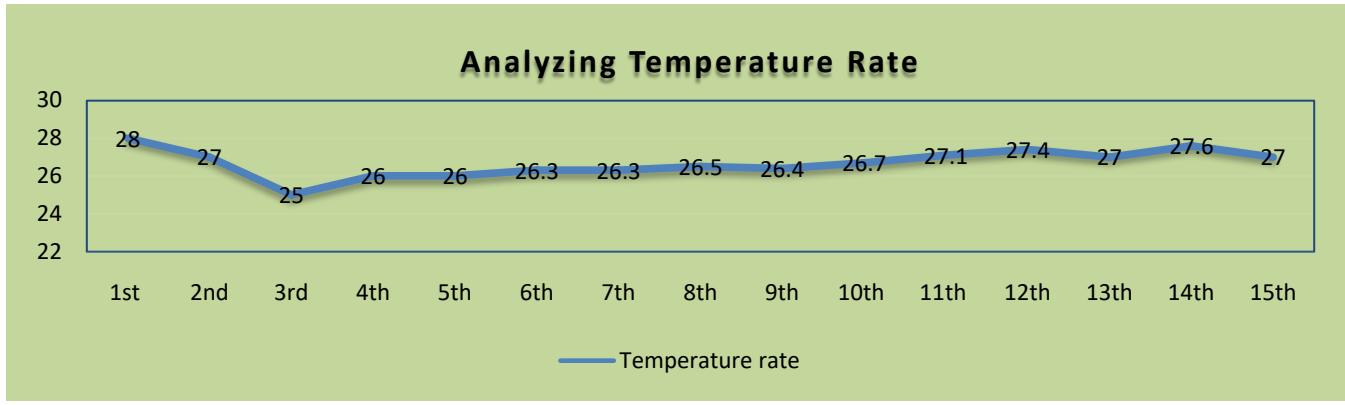
Figure 8: Temperature Rate Chart
## iii. JSN-SR04T Sensor Testing
It is clear from the results of tests that the JSN-SR04T sensor has performed correctly. The test results in Table 8 showing the readings of the ultrasonic sensor for the water level are accurate. Figure 9 indicates a progressive increase in distance. This indicates that the
aquarium's water level is dropping slowly. Knowing how much water is remaining allows for replenishment. To analyze the water quality, see Figure 10. Combining all the data, the result shows the water quality in the chart. (see Figure 11).
Table 8: Testing Water level
<table><tr><td>Testing</td><td>Water level JSN-SR04T sensor(cm)</td><td>Manual (cm)</td><td>Success (%)</td><td>Error (%)</td></tr><tr><td>1st</td><td>7</td><td>7.3</td><td>95.9</td><td>4.1</td></tr><tr><td>2nd</td><td>8</td><td>8</td><td>100</td><td>0</td></tr><tr><td>3rd</td><td>8</td><td>8.2</td><td>97.56</td><td>2.4</td></tr><tr><td>4th</td><td>9</td><td>9</td><td>100</td><td>0</td></tr><tr><td>5th</td><td>10</td><td>10</td><td>100</td><td>0</td></tr><tr><td>6th</td><td>11</td><td>11</td><td>100</td><td>0</td></tr><tr><td>7th</td><td>12</td><td>12.4</td><td>96.8</td><td>3.2</td></tr><tr><td>……</td><td>……</td><td>……</td><td>……</td><td>……</td></tr><tr><td>15th</td><td>12</td><td>12</td><td>100</td><td>0</td></tr></table>

Figure 2: Use Case Diagram of IoT based Fish Feeding System
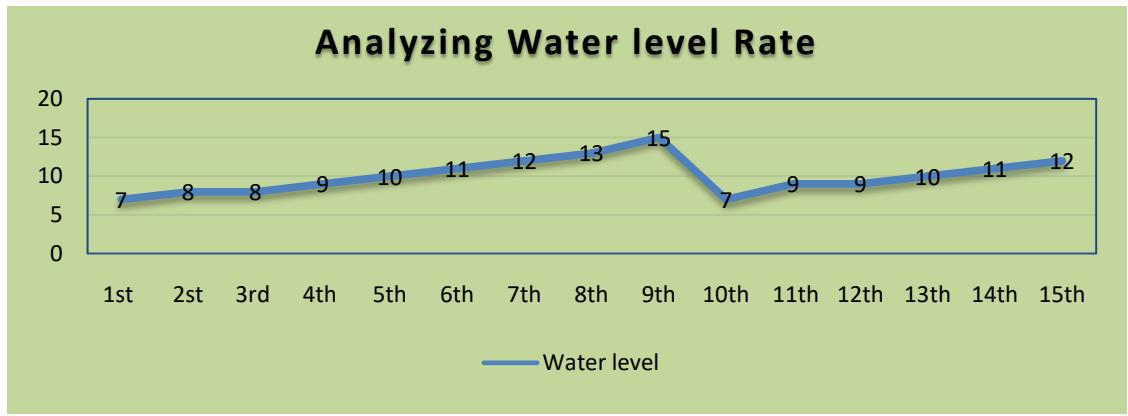
Figure 9: Water Level Chart
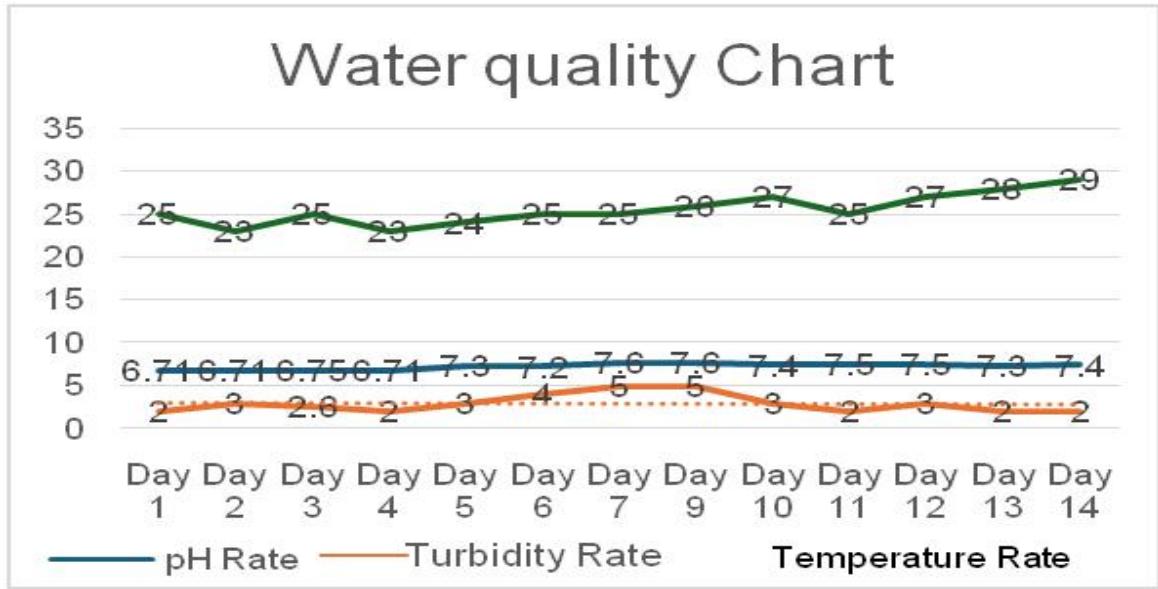
Figure 10: Analyzing Water quality
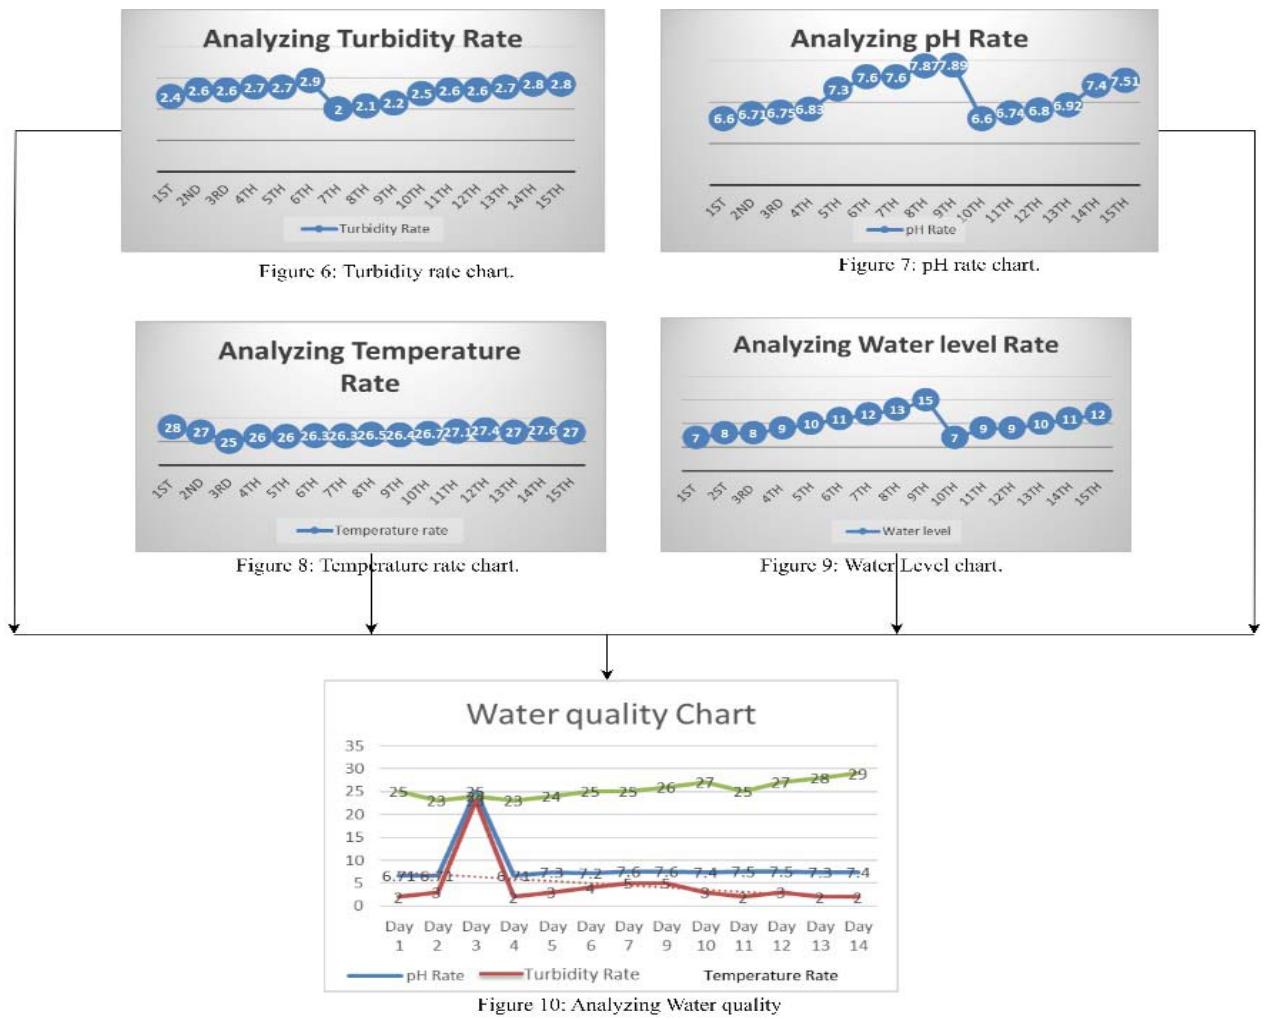
Figure 11: Combination of all Sensor Chart Data
By conducting essential tests on various types of water, as outlined in Table 11, we can ascertain the suitability of the water for the fish and ensure the aquarium maintains an adequate water level. The entirety of this process is facilitated seamlessly through IoT, effectively fulfilling our objectives. The advantageous feature of this research that sets it apart from earlier studies is that all available sensors were employed to enable mobile device monitoring of the fish's health and water quality as well as remote feeding of the fish. A more efficient comparison is shown in Table 1.
## V. CONCLUSION
This implementation aims to mitigate the challenges associated with feeding inefficiencies arising from temporal constraints, stress-induced responses in fish, and subsequent mortalities among the piscine population. The proposed IoT-based system utilizes esp32 to collect data from temperature, turbidity, pH, and ultrasonic sensors. It also employs a Wi-Fi webcam to monitor fish activity and water changes and refill through servo motors according to one's preferences.
All Information is transferred to the Blynk app, enabling remote control of the aquarium's water monitoring and fish feeding. This research stands out from others since it not only overcomes the obstacles that many other studies have faced but also successfully tracks fish movements and replenishes water, setting it apart from earlier research efforts.
### a) Future Work
This research was primarily designed for small-scale aquariums but could also be implemented on a larger scale. For future work, we wanted to enhance our idea to cover pond size by employing pond-specific sensors built for fish farming.
#### Declarations:
#### Conflict of interest:
The authors have no conflicts of interest to declare that they are relevant to the content of this article.
Ethics approval: Not applicable
Consent to participate: Not applicable
Consent to Publish: Not applicable
Availability of data and materials: Not applicable
Funding: There is no funding for this research.
Generating HTML Viewer...
References
30 Cites in Article
Bagas Dewantara,Indah Sulistiyowati,Jamaaluddin Jamaaluddin (2023). Automatic Fish Feeder and Telegram Based Aquarium Water Level Monitoring.
M Handoko Putra,H Imron,T Adhitya,B Wibowo (2023). Automatic fish feeders for fish farming in aquariumsbased on the Internet of Things (IOT).
Loo Han,Ilanur Noor,Syed Bahrin,Raed Abdula (2023). Automatic Aquarium Water Change System With Real Time Monitoring Through IoT.
V (2023). IoT Based Fish Food Dispenser.
Abdallah Al-Mutairi,Kasim Al-Aubidy (2023). IoT-based smart monitoring and management system for fish farming.
Nelly Masnila,Indra Isa,Hendradinata Hendradinata,Riana Mayasari (2021). IoT-Based Technological Innovation in Improving the Productivity of Macan Kumbang Fish Cultivator.
A Natividad,C Miranda,J Valdoria,D Balubal (2023). An IoT Based pH Level Monitoring Mobile Application on Fishponds using pH Sensor and Waterproof Temperature Sensor.
F Shaikh,U Bhaskarwar (2022). Smart Aquarium using IoT.
K Dinesh (2022). IOT BASED AUTOMATED FISH TANK MONITORING SYSTEM.
B Bs (2022). REAL TIME MONITORING OF AQUACULTURE USING IOT.
D Prangchumpol (2018). A Model of Mobile Application for Automatic Fish Feeder Aquariums System.
No ethics committee approval was required for this article type.
Data Availability
Not applicable for this article.
How to Cite This Article
Ferdaus Anam Jibon. 2026. \u201cAn Improved IoT-based Prototype for Fish Feeding and Monitoring System\u201d. Global Journal of Computer Science and Technology - B: Cloud & Distributed GJCST-B Volume 24 (GJCST Volume 24 Issue B1): .
Explore published articles in an immersive Augmented Reality environment. Our platform converts research papers into interactive 3D books, allowing readers to view and interact with content using AR and VR compatible devices.
Your published article is automatically converted into a realistic 3D book. Flip through pages and read research papers in a more engaging and interactive format.
Fish farming can help meet the ever-increasing demand for seafood and offer nutritious protein to people in underdeveloped countries, while additionally minimizing pressure on wild fish. The global population is supported economically by the fishing industry and related sectors for 10-12% of the total. Presently, cutting-edge technologies such as AI, Machine Learning, Automated Planning, Data Analytics, and IoT are being used in fish farming to increase production, efficiency, and sustainability. In this research, we proposed an IoT-based improved technique for fish feeding and monitoring that will enhance the efficiency of fish farming and increase production while avoiding threats to the environment. This proposed approach uses a microcontroller ESP32 that gathers data from temperature, turbidity, pH, and ultrasonic sensors, alongside a Wi-Fi webcam detecting fish movement. It will be linked to the Blynk app, which gathers and sends this data, informing users about water conditions.
Our website is actively being updated, and changes may occur frequently. Please clear your browser cache if needed. For feedback or error reporting, please email [email protected]
Thank you for connecting with us. We will respond to you shortly.