Dhaka is one of the most densely populated megacities of the world with demography of over 20 million people. With an annual population growth rate of 4.2% Dhaka is set to face the challenges of habitat crisis, lack of communal facilities, and constant pressure on transportation and infrastructure. In response to the demand of the rapidly growing population and scarcity of developable land, urban consolidation through vertical expansion was carried out without any proper diagnosis of the sites or any contextually appropriate densification policy. The unguided nature of densification not only brought a transformation in the urban landscape but also in the built form itself by infusing the concept of compactness into them. The compactness of multistoried dwellings is often found to compromise with the livability condition posing questions on residential sustainability.
## I. INTRODUCTION
Densification has become a widely practiced method to decrease urban land consumption through concentrated development. The dense compact city is argued to leverage a range of social, environmental, and economic benefits leading to sustainable development (Haughey, 2005; Jenks & Dempsey, 2005; Owen, 2009; Urban Task 2 C.T. Boyko, R. Cooper/ Progress in Planning 76 (2011) 1-61
Force, 1999, 2005; Williams, Burton, & Jenks, 2000). The compact urban form benefits city dwellers by providing services and amenities within walking distance and thereby reducing the need for automobile traffic, reducing GHG emissions, and saving energy (Williams, 2000; Kamal-Chaoui & Robert, 2009). It also fosters community cohesion through increased social interaction. Other co-benefits of high density are linked with urban vitality and diversity of streets promoting safety and security to its residents (Jacobs, 1961; Sung & Lee, 2015). The growing body of literature indicates density as a fundamental constituent of sustainable urban form but its successful application to attain sustainable development is critical. This is partly due to the complexity inherent to the nature of the phenomenon of density itself. As pointed out by Churchman (2009) density encompasses both objective and subjective attributes. The objective aspect is measurable and is generally measured in two ways: population density and dwelling density. The dwelling density can be expressed through measures like net residential density, gross residential density, floor area ratio, and so forth. Nonetheless, the complexity in quantifying density lies not only in its measuring metrics but also in the concepts of mid, low, and high densities subjected to regional and cultural variations. The subjective aspect of density is the perceived density which is defined as an individual's perception of density in a given area where the perception is shaped by a city's age, history, context, culture, geography, policies, attitudes, and economy (Smith, 1984). However, the negative connotation of density is crowding which is created when the perceived density is experienced as too high.
Densification operations when undertaken by merely increasing the number of dwellings may not always lead to sustainability. Sustainable urban development through densification can be achieved by addressing the qualitative aspect of density embedded in the social and cultural context. The design of higher-density development should focus on improving the quality of life through incorporating culturally responsive quality design, higher land use mix, increased accessibility, and greater connectivity to avoid any unintended outcome. Instead of maximizing density planners should focus on optimizing density to keep proceeding in the trajectory of sustainable development. Densification of residential areas in Dhaka started gaining momentum in the mid-1990s in response to the growing population due to natural growth and rural-urban migration. According to the World Population Review since independence in 1971, the population of Dhaka grew from 1,523,000 to over 18 million in 2016. The government responded to the housing crisis by densifying the existing residential areas without a proper diagnostic study of the site condition or projection of any future development scenarios. In the absence of any densification policy urban consolidation commenced in two phases: first by the transformation of the low-rise buildings up to six stories followed by the construction of higher buildings in the next phase with the introduction of Floor Area Ratio (FAR). This ongoing trend not only transformed the urban fabric but has brought significant changes in the spatial quality and living environment of the residential areas of Dhaka. This paper, therefore, intends to investigate the spatial quality of the residential built environment of Dhaka at both the building and block levels.
## II. METHODOLOGY
The study is an explorative research. To investigate the densification process three residential areas i.e., Uttara (Ward No. 1), Dhanmondi (Ward No. 49), and Luxmi Bazaar (Ward No.78) of varied density, age, and street patterns have been selected as study areas from the inner old city core, middle and peripheral locations of Dhaka. Ward is the smallest municipal administrative unit of Dhaka city under the jurisdiction of the City Corporation. The older settlement of Luxmi Bazaar represents one of the highest densities while the relatively newer residential areas of Dhanmondi and Uttara have medium and low density. The density of the residential areas was taken from the gross density profile of DAP 2010. For a detailed examination of the building densification process, four blocks from each study ward were selected. But as the old residential area of Luxmi Bazaar is characterized by an organically developed street network the physical boundary of any block was difficult to demarcate. Therefore, instead of blocks three lanes with plots flanking on both sides were selected (as shown in Fig 1, 2, & 3) to conduct the detailed studies. Fieldwork employed block survey documenting the design characteristics of the built forms in terms of Floor Area Ratio (FAR), land coverage at plot and block level, height, building form, and height, land use pattern, and net residential and population density at block level, provision of natural ventilation, daylight and view, spatial quality of the residential environment. Land coverage values at plot and block levels are calculated from building footprints and land boundaries of individual plots and block boundaries respectively. The trend of densification in the study blocks were studied through analyzing the satellite imagery. Sketches and photographic registration enhanced the qualitative insights. Interviews with government officials provided information on the building by-laws and area redevelopment scheme. Secondary data includes maps, land use plans, and government records collected from Dhaka North City Corporation and Dhaka South City Corporation, as well as newspaper articles, journals, and relevant published literature. Analysis was carried out through simple descriptive statistics tools (frequency distribution) to assemble or reconstruct the data in a meaningful and comprehensive manner and was presented in the form of tables, charts, graphs, etc. contributing to a better understanding of the trend of densification taking place in the residential areas.
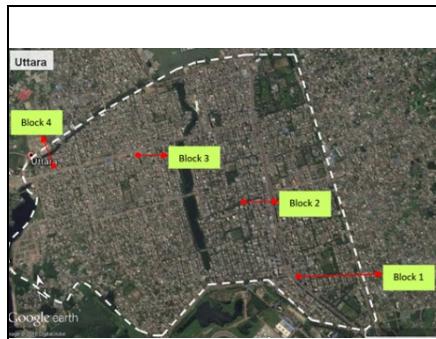 Fig. 1: Location of study blocks, Uttara
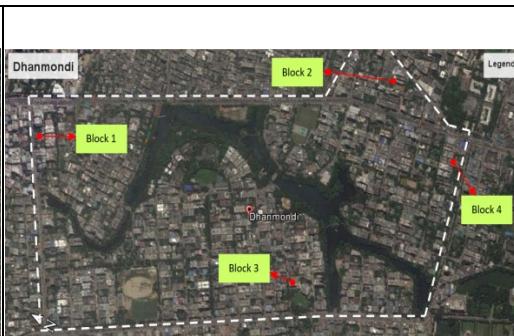 Fig. 2: Location of study blocks, Dhanmondi
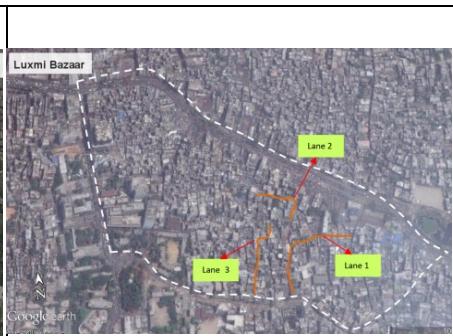 Fig. 3: Location of study lanes, Luxmi Bazaar
### a) Uttara Residential Model Town (Ward No. 01)
i. Land use Pattern and Building Guidelines for Uttara Uttara was planned as a satellite town with the aim of decongesting the inner city and provides accommodation for the low and middle-income group. In 1965 Dhaka Improvement Trust (DIT) acquired 2344 acres of flood free high land at the northern periphery of
Dhaka along the major north south corridor (DhakaMymensingh Road). In the original plan around $53\%$ of the land area was assigned for residential accommodation and $47\%$ for civic administration, light industries and recreation, playfields. But later more residential plots were added at the expense of the existing open spaces due to political intervention.
Despite Open Spaces and Wetland Protection Act 2000, much of the Uttara lakeside open spaces were converted to residential use in the process while open spaces of sector 1 was sold to developers by Capital Development Authority (RAJUK) (Nilufar, 2013). Consequently, the original number of plots were subdivided into 4302 serviced plots and distributed in 5, 7.5, 4 and 3.25 kathas (1 katha = 720 sq.ft.) to upper middle income govt. officials instead of the initially intended low-income class. Uttara originally had 14 sectors distributed on both sides of the thoroughfare. Later expansion took place on the far west with new sectors (Uttara Residential Area (3rd Phase). The grid iron street pattern has divided the western part of Uttara into rectilinear blocks with more than 44 plots per block arranged in two rows. However, the oblong blocks of eastern part has relatively larger plots. In response to the growing demand the initial narrow commercial strip on the primary road was later expanded by assigning the commercial land use in the road front blocks on both side of Dhaka-Mymensingh Road. In addition, the plots along the secondary roads of Jashimuddin Avenue and Sonargaon Janapath were later assigned for commercial ribbon development. Though the commercial activities on the secondary road of Ravindra Sharani are intensifying it is still not declared as commercial zone.
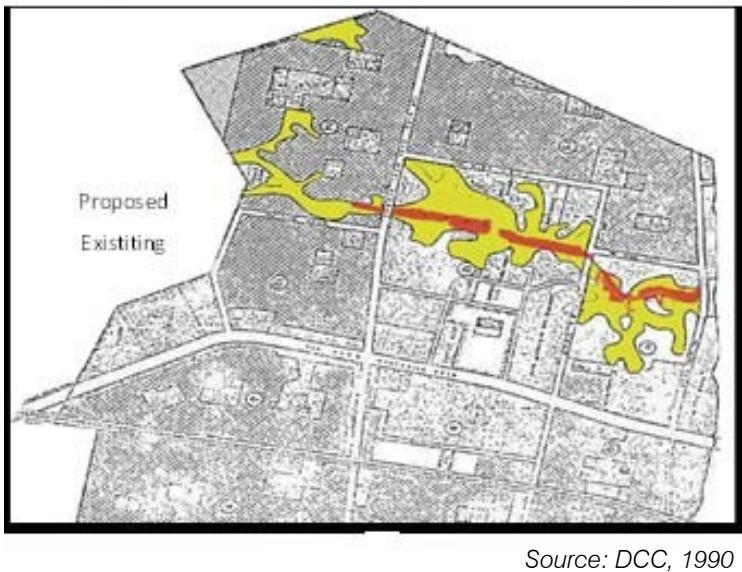 Fig. 4: The encroach ent of water body, Uttara
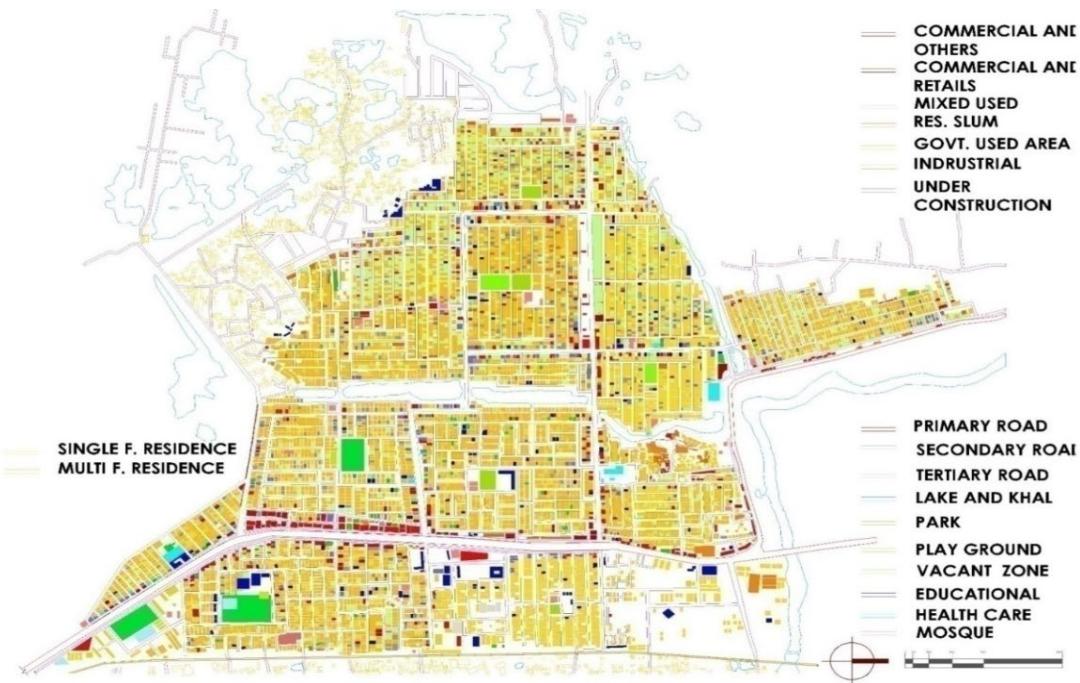 Figure 5: Land use map of Uttara
Source:Field Survey,2016
## ii. Changing landscape of building heights in Uttara
Most of the allotters belonged to the affluent class, government officials and offshore residents who had kept their allotted land vacant for over a decade for land speculation and construction of post-retirement homes. As a result, more than half of the plots remained vacant till the late 1970s. During that time the density of Uttar was very low. Only the sectors 1 to 9 were inhabited with dispersedly located tin shade row houses and single-story houses. With the completion of road network and access to utility services by 1984-85 the construction of 2 storied buildings exacerbated in all the sectors. However, up until the end of the 1980s the area was still sparsely inhabited and predominated with 1-2 story houses. Higher building construction activity initiated from the 1990s by real estate developers with profit maximizing agenda. The plot owners opted to construct multi-storied buildings in collaboration with private developers for monetary benefits. Although the height restriction of civil aviation authority did not allow buildings above 6 story the emergence of this trend diminished the construction of single and two storied buildings and by 2001 about $67\%$ of the vacant plots were occupied with 6 storied buildings. A second wave of transformation started from the onset of 2014 with the promulgation of Building Construction Rule (MINB2008) that eliminated the height restriction with the introduction of FAR. This rule stimulated rapid redevelopment activity with taller buildings reaching up to 12 to 14 stories, mostly in the vacant plots and in plots adjacent to the secondary roads both permitted and unpermitted for commercial activities. This development trend contributes to a generation of isolated vertical habitats (7-14 storied) developed amidst clusters of low-rise and 5-6 storied buildings in Uttara (Table 1).
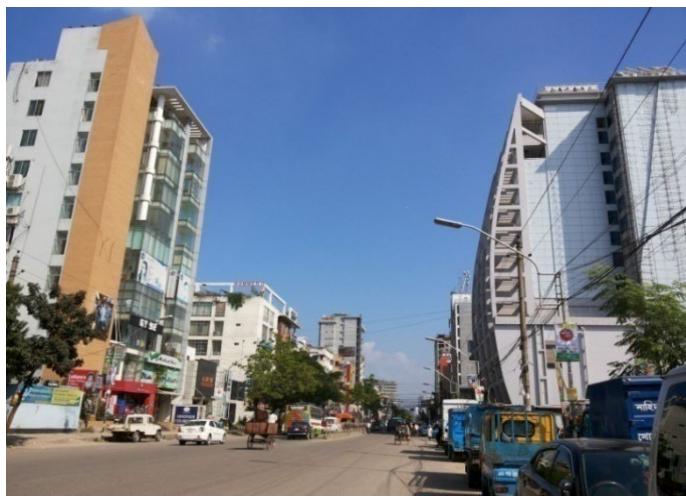 Figure 6: Emerging high rise commercial buildings along the secondary street of Uttara
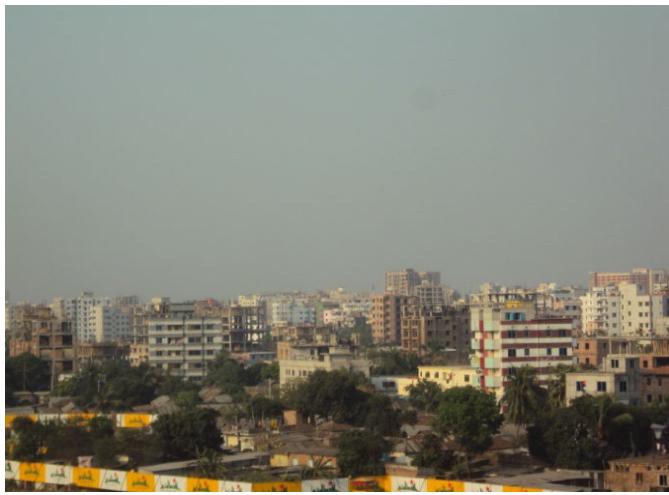 Figure 7: Jagged skyline of Uttara
Table 1: Trend of building height change in Uttara (2004 - 2016)
<table><tr><td rowspan="2">No. of
Stories</td><td colspan="3">Block 1</td><td colspan="3">Block 2</td><td colspan="3">Block 3</td><td colspan="3">Block 4</td></tr><tr><td>2004</td><td>2010</td><td>2016</td><td>2004</td><td>2010</td><td>2016</td><td>2004</td><td>2010</td><td>2016</td><td>2004</td><td>2010</td><td>2016</td></tr><tr><td>1</td><td>1</td><td>2</td><td>3</td><td>4</td><td>2</td><td>2</td><td>-</td><td>-</td><td>-</td><td>-</td><td>-</td><td>4</td></tr><tr><td>2</td><td>1</td><td>2</td><td>2</td><td>3</td><td>4</td><td>2</td><td>2</td><td>2</td><td>2</td><td>-</td><td>-</td><td>-</td></tr><tr><td>3</td><td>3</td><td>3</td><td>2</td><td>2</td><td>3</td><td>3</td><td>-</td><td>-</td><td>-</td><td>1</td><td>1</td><td>1</td></tr><tr><td>4</td><td>-</td><td>1</td><td>1</td><td>1</td><td>2</td><td>1</td><td>1</td><td>1</td><td>1</td><td>-</td><td>-</td><td>1</td></tr><tr><td>5</td><td>2</td><td>2</td><td>2</td><td>2</td><td>4</td><td>4</td><td>1</td><td>1</td><td>1</td><td>-</td><td>3</td><td>4</td></tr><tr><td>6</td><td>5</td><td>5</td><td>5</td><td>2</td><td>2</td><td>2</td><td>7</td><td>8</td><td>16</td><td>-</td><td>5</td><td>20</td></tr><tr><td>7</td><td>-</td><td>-</td><td>2</td><td>-</td><td>-</td><td>-</td><td>-</td><td>5</td><td>9</td><td>-</td><td>4</td><td>9</td></tr><tr><td>8</td><td>-</td><td>-</td><td>-</td><td>-</td><td>-</td><td>1</td><td>-</td><td>3</td><td>3</td><td>-</td><td>1</td><td>1</td></tr><tr><td>9and
above</td><td>-</td><td>-</td><td>1</td><td>-</td><td>1</td><td>4</td><td>-</td><td>-</td><td>2</td><td>-</td><td>1</td><td>1</td></tr><tr><td>Total</td><td>12</td><td>15</td><td>18</td><td>14</td><td>18</td><td>19</td><td>11</td><td>20</td><td>34</td><td>1</td><td>15</td><td>41</td></tr></table>
In the four blocks where detailed studies were conducted, the number of 6 and above 6 story houses were 5, 2,7 and 0 in Block 1, 2, 3 and 4 respectively in 2004 which turned to 5,3,16 and 11 in 2010 and 8, 7, 30 and 31 in 2016. The vacant plots of the study blocks gradually started filling up from 2004 while the low-rise houses were replaced by 6 and above 6 storied buildings (Table 1). However, the vacant plots of peripheral blocks like Block 4 is subjected to construction of high rise buildings from 2010 and onwards. Overall, the number of vacant plots ranges from 1-13 in about $18\%$ blocks of Uttara at present. The large number of vacancies in the peripheral blocks until 2008 indicates that densification started relatively at a later phase in Uttara i.e. after 2014.
## iii. Floor Area Ratio (FAR)
The maximum floor area ratio for older buildings observed in Block 1, 2, 3, 4 ranges from 0.3 to 5.6 while in Block 3 the highest FAR observed for new buildings was 9. The approved ratio of older buildings ranges from 4.2- 4.8. This indicates violation of the allowable limit set by the Building Construction Rules 1996 (BCR). On the other hand, the newly constructed buildings have a floor area ratio ranging in between 4.8 to 5.9 which shows a slight deviation from the permissible range of MINB 2008. Out of 112 surveyed in Uttara 55 mid- and high-rise buildings are built according to the new FAR rule, where 6 are commercial and the rest are residential buildings.
Table 2: Floor Area Ratio of Blocks 1, 2, 3 and 4 Uttara (2016)
<table><tr><td>FAR</td><td>Block 1</td><td>Block 2</td><td>Block 3</td><td>Block 4</td></tr><tr><td>0.1 – 0.5</td><td>-</td><td>1</td><td>-</td><td>4</td></tr><tr><td>0.5 – 1.0</td><td>2</td><td>-</td><td>-</td><td>-</td></tr><tr><td>1.0 – 1.5</td><td>1</td><td>3</td><td>-</td><td>-</td></tr><tr><td>1.5 – 2.0</td><td>2</td><td>1</td><td>-</td><td>-</td></tr><tr><td>2.0 – 2.5</td><td>1</td><td>2</td><td>-</td><td>1</td></tr><tr><td>2.5 – 3.0</td><td>-</td><td>2</td><td>-</td><td>-</td></tr><tr><td>3.0 – 3.5</td><td>1</td><td>-</td><td>1</td><td>-</td></tr><tr><td>3.5 – 4.0</td><td>2</td><td>3</td><td>-</td><td>1</td></tr><tr><td>4.0 – 4.5</td><td>-</td><td>1</td><td>4</td><td>13</td></tr><tr><td>4.5 – 5.0</td><td>5</td><td>-</td><td>6</td><td>17</td></tr><tr><td>5.0 – 5.5</td><td>1</td><td>1</td><td>11</td><td>-</td></tr><tr><td>5.5 – 6.0</td><td>2</td><td>1</td><td>8</td><td>4</td></tr><tr><td>6.0 – 6.5</td><td>1</td><td>-</td><td>4</td><td>-</td></tr><tr><td>6.5 – 7.0</td><td>-</td><td>1</td><td>1</td><td>-</td></tr><tr><td>7.0 – 7.5</td><td>-</td><td>1</td><td>-</td><td>-</td></tr><tr><td>7.5 – 8.0</td><td>-</td><td>-</td><td>-</td><td>-</td></tr><tr><td>8.0 – 8.5</td><td>-</td><td>1</td><td>-</td><td>-</td></tr><tr><td>8.5 – 9.0</td><td>-</td><td>1</td><td>-</td><td>-</td></tr><tr><td>Total</td><td>18</td><td>19</td><td>35</td><td>40</td></tr></table>
## iv. Plot coverage
Field work results from Uttara indicate that most of the plots with 6 storied buildings had higher plot coverage of $75\% -80\%$ which is above the recommended setback of BCR 1996. While the recommended maximum ground coverage was 70 percent, field observations showed that out of 112 surveyed plots, 27 of the older buildings had 81 to $90\%$, 47 new buildings had $71 - 80\%$ percent and the rest had 61 to 70 percent coverage. In general, the plot coverage of $40\%$ of the surveyed buildings are beyond the recommended limit of BCR 1996 and MINB 2008. The high coverage is mostly evident in $60\%$ of plots where buildings were constructed before the introduction of FAR. Even $10\%$ of the buildings currently undergoing construction are still following the former setback rule as their plan had been approved before the promulgation of MINB 2008. According to the guidelines construction work should commence within 3 years of plan approval otherwise new approval is required. But the delayed construction of these earlier approved buildings indicates another violation of the law.
Table 3: Plot coverage in Uttara
<table><tr><td>Plot coverage (%)</td><td>Number of Plots</td><td>Percentage</td></tr><tr><td>50 or less</td><td>3</td><td>2.61</td></tr><tr><td>51-60</td><td>6</td><td>4.21</td></tr><tr><td>61-70</td><td>32</td><td>27.8</td></tr><tr><td>71-80</td><td>47</td><td>40.8</td></tr><tr><td>81-90</td><td>27</td><td>23.4</td></tr><tr><td>91-100</td><td>-</td><td>-</td></tr><tr><td>Total</td><td>112</td><td>100.0</td></tr></table>
## v. Ground Coverage at block level
Overall, the blocks of Uttara show a modest ground coverage because some blocks still have a few numbers of single and double storied dwellings with less footprint while a significant number of plots in many blocks are still vacant which reduces the overall land coverage at block level. However, blocks with greater number of mid-rise buildings (e.g., Blocks 1&2) have a block coverage of around $76\%$ as the mid-rise buildings have plot coverage of $80\%$ which is beyond the set limit of $70\%$ according to BCR 1996.
Table 4: Land coverage at block level in Uttara
<table><tr><td>Block</td><td>Total area (sq.ft)</td><td>Total built up area (sq.ft.)</td><td>Land coverage per block (%)</td><td>Average Block coverage</td></tr><tr><td>1</td><td>79200</td><td>60480</td><td>76.3</td><td rowspan="4">67.9%</td></tr><tr><td>2</td><td>36000</td><td>27360</td><td>76</td></tr><tr><td>3</td><td>126360</td><td>77922</td><td>61.6</td></tr><tr><td>4</td><td>64800</td><td>48060</td><td>57.8</td></tr></table>
Block 2 has a greater number of commercial and mixed-use buildings (10 out of 19) as it is located along Ravindra Sharani Road. Most of the older mid- and high-rise buildings have a plot coverage (90%) exceeding the ratios recommended in the former setback rule of 1996. The zoning ordinance along the secondary street of Ravindra Sharani is not permitted for commercial use yet. But due to the paucity of designated commercial plots in the Master Plan, many of the influential plot owners had acquired the permit of converting their residential plot to commercial use on basis of public demand or through exerting political influence on the local authority. The findings indicate a flexibility and non-compliance in adherence of the Master Plan and BCR rules by the developers and plot owners. However, Block 2 has one of the lowest net residential densities (97 units/ hectare) due to the increased number of commercial and mixed-use buildings.
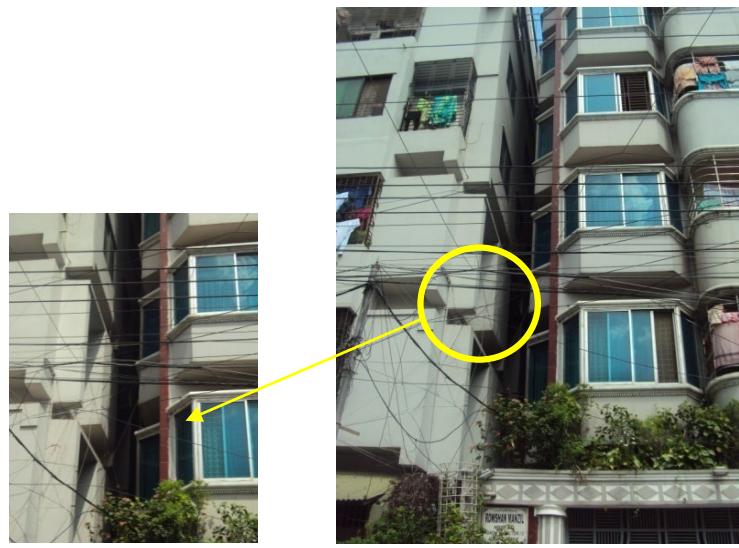 Figure 8: Dark alley between buildings
Table 5: Net Residential Density and Net Residential Population Density at block level in Uttara
<table><tr><td colspan="3">Uttara</td></tr><tr><td>Block</td><td>Net Residential Density (NRD) units/hectare</td><td>Net Residential Population Density (NRPD) persons /hectare</td></tr><tr><td>1</td><td>201</td><td>886</td></tr><tr><td>2</td><td>97</td><td>850</td></tr><tr><td>3</td><td>135</td><td>767</td></tr><tr><td>4</td><td>316</td><td>982</td></tr></table>
In Block 3 out of 44 plots (6 kathas) 22 plots are occupied with 6-7 storied buildings, 12 plots have buildings of older construction while 9 plots are still vacant. The plot coverage is around $65\% -70\%$ in the MINB 2008 abiding buildings and a highest of $80\%$ - $90\%$ in the older buildings exceeding the prescribed level. The peripheral Block 4 of Sector 12 has 54 plots with 13 vacant plots and is occupied by 6-7 storied residential buildings forming a continuous skyline. Around $97\%$ of the buildings have two units per floor making the net residential density relatively higher i.e., 316 units per hectare than the other study blocks. The buildings cast shadow on the adjacent access roads and causing dark alleys even in the afternoon. The plots are the smallest (3.25 kathas or 2340 sq.ft.) available in Uttara and permissible of higher plot coverage around $80\%$ according to FAR. Since high-rise buildings above
7 stories are not feasible for smaller lots the buildings are of 6-7 storied with plot coverage of $70\% -80\%$. Six plots have a maximum coverage ranging from $83\%$ to $85\%$ which is a violation of the law. Only 14 buildings out of 41 complied with MINB 2008 properly while others slightly violated by raising the height of the front porch and guard room. In addition, the dark narrow setback space between the buildings cannot provide any meaningful use. Much of the development activity in this block started after 2011 for its peripheral location and for the late completion of the secondary road of Sonargaon Janapath. Overall, the linear plot configuration of the elongated blocks as well as the close juxtaposition of similar height buildings does not offer adequate provision for solar access, airflow and privacy contributing to a cramped situation.
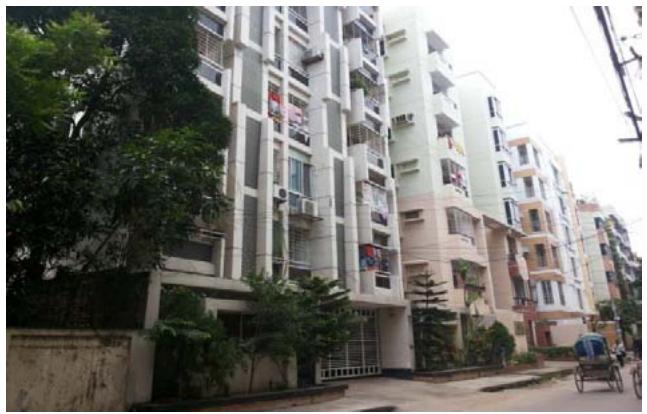 Figure 9: Block 1, Uttara
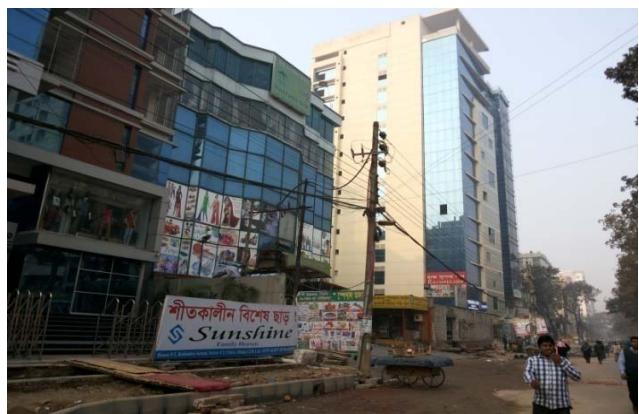 Figure 10: Block 2, Uttara
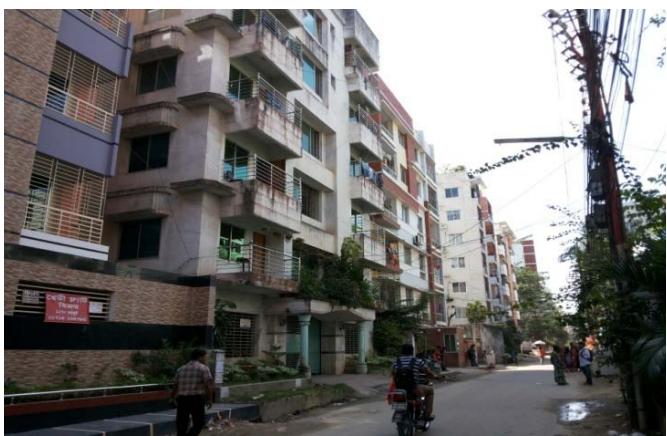 Figure 11: Block 3, Uttara
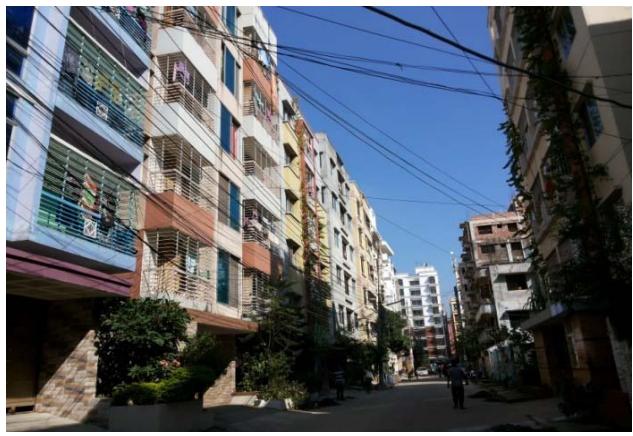 Figure 12: Block 4, Uttara
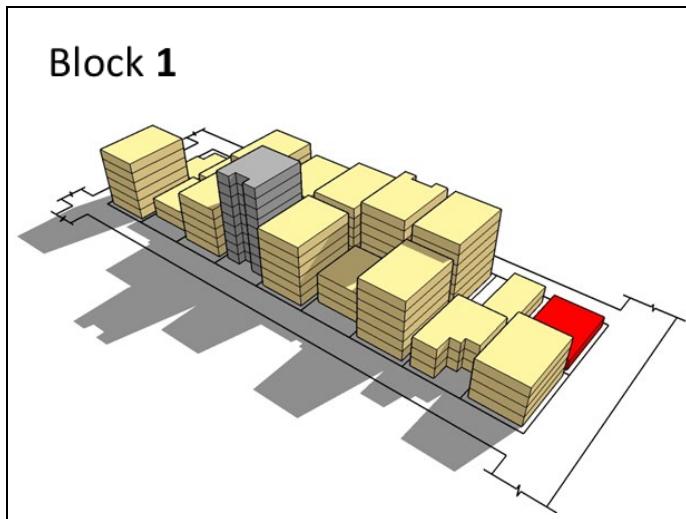
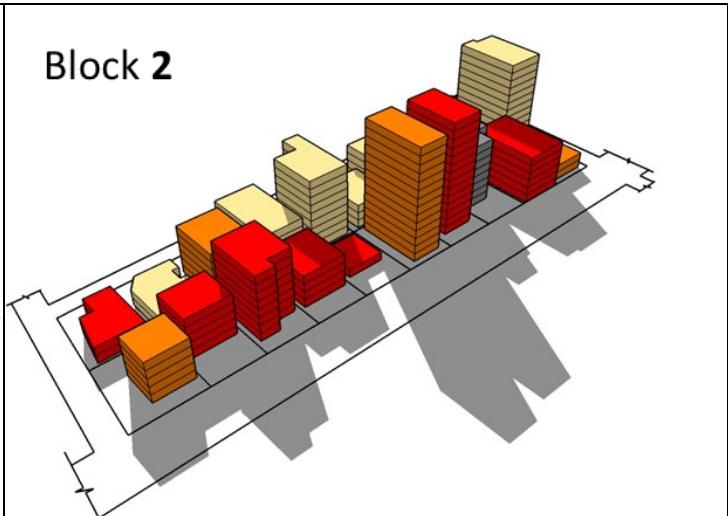
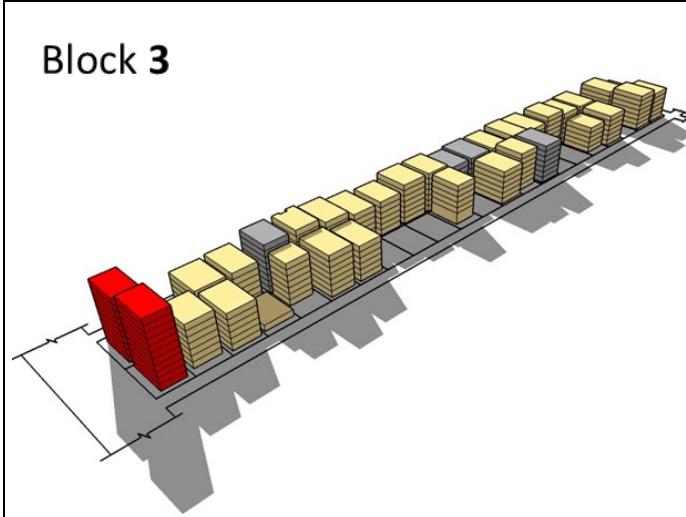
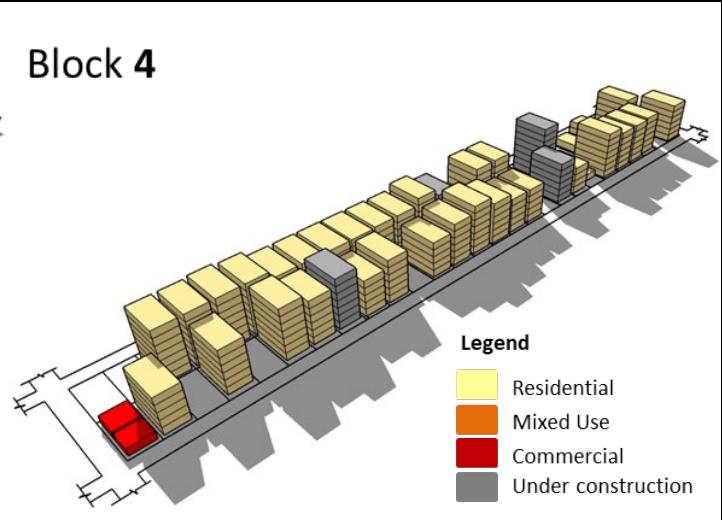 Figure 13: Shadowing of the blocks and adjacent roads, Uttara
Source:Field Survey,2016
## vi. Spatial growth pattern in Uttara
The emerging spatial growth pattern of Uttara depicts that the residential area is heading towards a compact settlement pattern with varying height, size, and plot coverage. Around $10\%$ of plots are still vacant and another $10\% - 15\%$ with 1-2 storied dwellings. The similar height buildings juxtaposed to each other is resulting in poor spatial qualities of the indoor living environment in most of the blocks. The problem is further intensified in the longer blocks having more than 20 plots in a row. This type of block layout reduces the plot frontage likely to create cramped development. Since development is taking place plot by plot basis two types of skylines seems to be emerging where blocks along the primary roadside are forming an informally broken skyline pierced by 10-14 storied towers at irregular intervals and the inner blocks having a uniform skyline formed by rows of 6-7 storied residential buildings. Overall, such a spatial development pattern causes jagged skyline. In addition, the tower blocks are casting shadow on the adjacent buildings and streets creating dark corridors and hampering privacy of the adjacent low and mid-rise buildings. Densification is still in its infancy stage in the sector 5, 10, 12 and 14 but in the rest of the 11 sectors it had reached the 'optimum stage' for the proliferation of commercial activities acting as catalyst to the densification process.
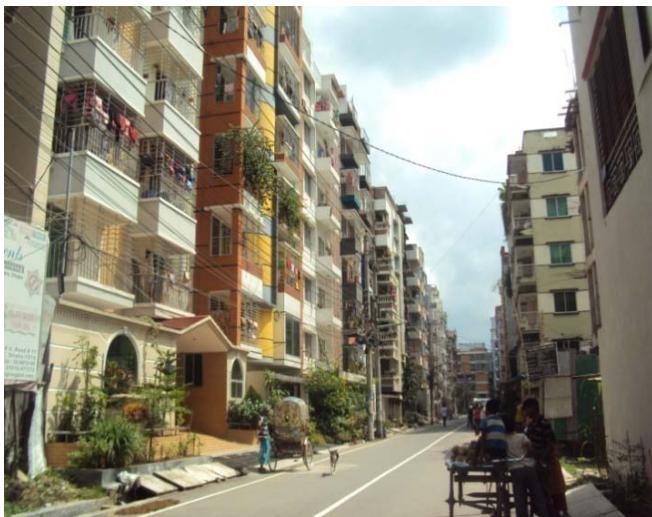 Figure 14: Closely juxtaposed buildings forming uniform skyline.
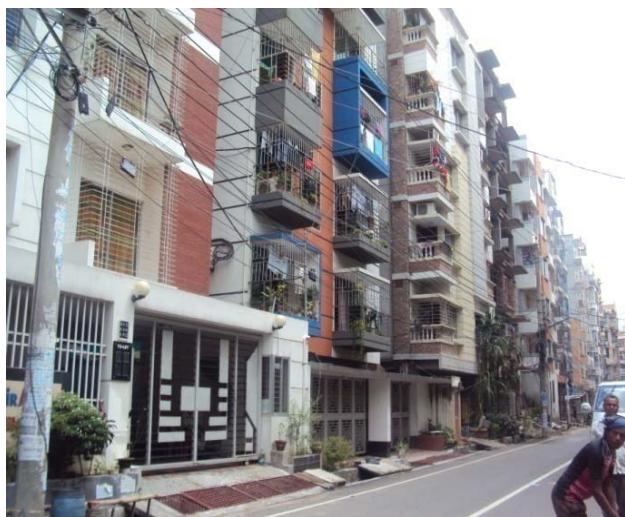 Figure 15: Mandatory open space is covered with roof of the extended porticos.
### b) Dhanmondi Residential Area (Ward No. 49)
## i. Land Use and Building Guidelines for Dhanmondi
development potential and its locational advantage, the diplomatic zone was moved to a peripheral location by the 1990s. This decision rapidly transformed the spatial landscape of Dhanmondi with a construction boom of 6 storied buildings in the following decade owing to the decrease in land value and developers' involvement in the housing sector encouraged by the neo-liberal policy model of the government. In absence of a redevelopment framework, the zoning, height ceiling was determined by using Government Notices, Orders and Circulars issued by the PWD and Ministry of Housing and Public Works during the period of 1995 to 1996. The bye law for subdivision of the plots laid out for Dhanmondi further accelerated the construction of 6 storied buildings. As the government does not allow subdivision of plots below 5katha (335 sq.m.) the second and third generation landowners of Dhanmondi had to either sell or construct multi-storied buildings with apartments distributed among the beneficiaries. In addition, the current landowners (successors of the original owner), who are economically obsolete find agreement with the developers to be an easy solution for redevelopment (Afrin et al., 2012). The PWD Circular of $1^{\text{st}}$ May 1996 allowed commercial activities compatible to neighborhood scale on all the plots on both sides of Mirpur Road, Satmasjid Road and Road No. 16(old 27) with $15\%$ "Conversion Fee". The establishment of modern shopping malls and hospitals like Rapa Plaza and Ganoshasto Bhaban further drove the development of commercial activities along Mirpur Road. The height limitation of 6 stories with no restriction on the number of flats was allowed according to the decision taken by the Jahiruddin Committee in 1996 and notified through a circular. Consequently, the overall density increased 3-fold times than the initial density with higher density gradients towards the primary roads. The proportion of single-story houses diminished to $42\%$ and further down to $65\%$ in 2000 and 2004 respectively
(Author's calculation from satellite imagery). In response to the growing demand and weak enforcement of guidelines the commercial activities of varied scale and nature started infiltrating into the inner blocks illegally. This type of commercial invasion started degrading the neighborhood livability by generating traffic concentrations. In 2008 with the introduction of FAR and elimination of height restriction further increased the density. Another phase of transformation is currently underway where the 6 storied buildings are increasingly being replaced by 12 to 14 storied mixed-use towers.
Table 6: Land Use of Dhanmondi Residential Area
<table><tr><td>Land Use</td><td>Area (acre)</td><td>Area (%)</td></tr><tr><td>Total residential area (plot)</td><td>298.3</td><td>61.4</td></tr><tr><td>Roads</td><td>89.6</td><td>18.4</td></tr><tr><td>Water body</td><td>44.6</td><td>9.2</td></tr><tr><td>Park and playground</td><td>44.7</td><td>9.2</td></tr><tr><td>Mosque</td><td>4.7</td><td>0.9</td></tr><tr><td>School (public and provided in the original plan)</td><td>4.4</td><td>0.9</td></tr><tr><td>Total Area</td><td>485.9</td><td>100</td></tr></table>
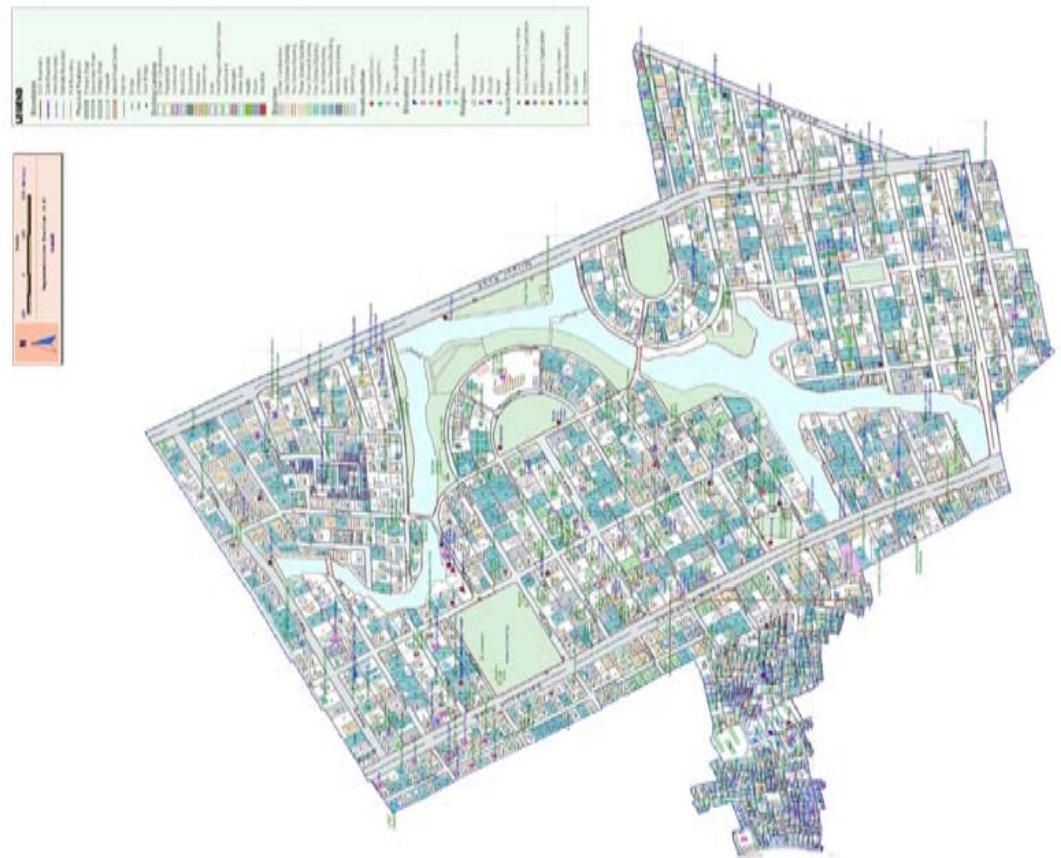 Figure 16: Land Use Map of Dhanmondi
Source: DSCC, 2011
## ii. Changing landscape of building height in Dhanmondi
During the 1970s the posh residential area was predominantly a low-rise low-density settlement surrounded by green spaces and water body. Most of the plots had 1-2 storied house form with ample space in the front and backyard for gardening. The pattern started changing from late the 1980s and rapid transformation took place in the following one and half decades forming a matrix of 6 storied buildings in the regular blocks formed by the grid iron pattern road network. From 2008 the uniform continuous skyline of 6-storied buildings started breaking haphazardly with 12 to 14 storied isolated towers of mixed use and commercial functions particularly along the primary and secondary roads of the area. Similar trend also emerged on the access roads (18-24 feet) of some inner blocks.
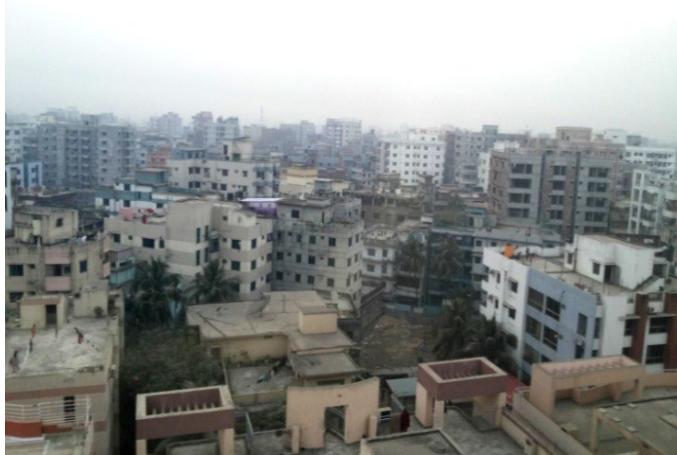 Figure 17: Dhanmondi
Table 7: Trend of building height change in Dhanmondi (2004 - 2016)
<table><tr><td rowspan="2">No. of Stories</td><td colspan="3">Block 1</td><td colspan="3">Block 2</td><td colspan="3">Block 3</td><td colspan="3">Block 4</td></tr><tr><td>2004</td><td>2010</td><td>2016</td><td>2004</td><td>2010</td><td>2016</td><td>2004</td><td>2010</td><td>2016</td><td>2004</td><td>2010</td><td>2016</td></tr><tr><td>1</td><td>10</td><td>5</td><td>6</td><td>-</td><td>-</td><td>-</td><td>5</td><td>2</td><td>1</td><td>5</td><td>4</td><td>4</td></tr><tr><td>2</td><td>4</td><td>8</td><td>3</td><td>1</td><td>2</td><td>2</td><td>4</td><td>2</td><td>2</td><td>6</td><td>4</td><td>3</td></tr><tr><td>3</td><td>3</td><td>2</td><td>2</td><td>1</td><td>1</td><td>3</td><td>2</td><td>4</td><td>1</td><td>3</td><td>1</td><td>1</td></tr><tr><td>4</td><td>-</td><td>-</td><td>-</td><td>1</td><td>1</td><td>-</td><td>1</td><td>1</td><td>2</td><td>1</td><td>1</td><td>1</td></tr><tr><td>5</td><td>-</td><td>-</td><td>-</td><td>1</td><td>1</td><td>1</td><td>-</td><td>-</td><td>1</td><td>4</td><td>4</td><td>4</td></tr><tr><td>6</td><td>4</td><td>4</td><td>6</td><td>1</td><td>9</td><td>11</td><td>5</td><td>6</td><td>6</td><td>6</td><td>10</td><td>11</td></tr><tr><td>7</td><td>1</td><td>1</td><td>1</td><td>-</td><td>-</td><td>-</td><td>-</td><td>1</td><td>1</td><td>-</td><td>-</td><td>-</td></tr><tr><td>8</td><td>-</td><td>-</td><td>-</td><td>-</td><td>-</td><td>-</td><td>-</td><td>-</td><td>-</td><td>-</td><td>-</td><td>1</td></tr><tr><td>9and above</td><td>-</td><td>4</td><td>6</td><td>-</td><td>-</td><td>1</td><td>-</td><td>1</td><td>5</td><td>-</td><td>2</td><td>4</td></tr><tr><td>Total</td><td>22</td><td>24</td><td>24</td><td>6</td><td>8</td><td>18</td><td>17</td><td>17</td><td>19</td><td>25</td><td>24</td><td>29</td></tr></table>
## iii. Floor Area Ratio (FAR)
The Floor Area Ratio (FAR) was found ranging from 2.50 to 6.25 in the surveyed blocks. For plot area above 5-6 katha the recommended maximum Floor Area Ratio for residential buildings is 3.75 and 3.50 for residential cum commercial uses according to MINB 2008. And for larger plots (Above 9-10 katha) the maximum recommended FAR is 4.00 and 6.00 for residential and commercial buildings respectively. One 6 storied building on the corner plot of Block 3 had a Floor
Area Ratio of 6.3. Though the building is constructed before 2008 but still the higher horizontal expansion is a violation of the allowable setback of BCR1996. Further observations in the areas zoned for mixed land use revealed an average Floor Area Ratio that ranged between 4.8 to 9.1 in the newly constructed buildings indicating the lack of monitoring to ensure the compliance of the recommended FAR (Table 4.14). Out of 95 buildings surveyed, 14 are recent construction.
Table 8: Floor Area Ratio in of Blocks 1, 2, 3 and 4 Dhanmondi
<table><tr><td>FAR</td><td>Block 1</td><td>Block 2</td><td>Block 3</td><td>Block 4</td></tr><tr><td>0.1 – 0.5</td><td>7</td><td>-</td><td>1</td><td>1</td></tr><tr><td>0.5 – 1.0</td><td>3</td><td>1</td><td>1</td><td>3</td></tr><tr><td>1.0 – 1.5</td><td>3</td><td>2</td><td>1</td><td>3</td></tr><tr><td>1.5 – 2.0</td><td>-</td><td>1</td><td>-</td><td>3</td></tr><tr><td>2.0 – 2.5</td><td>-</td><td>4</td><td>1</td><td>1</td></tr><tr><td>2.5 – 3.0</td><td>-</td><td>-</td><td>1</td><td>-</td></tr><tr><td>3.0 – 3.5</td><td>-</td><td>2</td><td>2</td><td>2</td></tr><tr><td>3.5 – 4.0</td><td>-</td><td>3</td><td>1</td><td>1</td></tr><tr><td>4.0 – 4.5</td><td>1</td><td>-</td><td>1</td><td>1</td></tr><tr><td>4.5 – 5.0</td><td>3</td><td>5</td><td>5</td><td>4</td></tr><tr><td>5.0 –5.5</td><td>1</td><td>-</td><td>-</td><td>5</td></tr><tr><td>5.5 –6.0</td><td>-</td><td>-</td><td>1</td><td>-</td></tr><tr><td>6.0 –6.5</td><td>-</td><td>2</td><td>1</td><td>1</td></tr><tr><td>6.5 –7.0</td><td>1</td><td>-</td><td>1</td><td>-</td></tr><tr><td>7.0 –7.5</td><td>2</td><td>-</td><td>-</td><td>1</td></tr><tr><td>7.5 –8.0</td><td>2</td><td>-</td><td>1</td><td>-</td></tr><tr><td>8.0 –8.5</td><td>2</td><td>-</td><td>1</td><td>-</td></tr><tr><td>8.5 –9.0</td><td>-</td><td>1</td><td>1</td><td>-</td></tr><tr><td>9.0 –9.5</td><td>-</td><td>-</td><td>-</td><td>3</td></tr><tr><td>Total</td><td>25</td><td>21</td><td>20</td><td>29</td></tr></table>
## iv. Plot coverage
Results from field observation revealed that around $52.4\%$ of the plots have plot coverage ranging between 71- $90\%$ while $17.9\%$ plots with low rise dwellings have modest coverage of less than $50\%$ to $60\%$. The new buildings maintained the mandatory open space with $25\%$ soak able ground. Only a few plots with buildings constructed before 2007 had higher coverage ranging from 91 to 100 percent. This indicates the tendency of the landowners and developers to illegally extend the plot coverage driven by profit maximization agenda.
Table 9: Plot coverage in Dhanmondi
<table><tr><td>Plot coverage (%)</td><td>Number of Plots</td><td>Percentage</td></tr><tr><td>50 or less</td><td>7</td><td>11.4</td></tr><tr><td>51-60</td><td>4</td><td>6.5</td></tr><tr><td>61-70</td><td>16</td><td>26.2</td></tr><tr><td>71-80</td><td>18</td><td>29.5</td></tr><tr><td>81-90</td><td>14</td><td>22.9</td></tr><tr><td>91-100</td><td>2</td><td>3.27</td></tr><tr><td>Total</td><td>61</td><td>100</td></tr></table>
## v. Ground Coverage at block level
Blocks 1 and 2 indicates modest ground coverage of about 65.2 and 63 percent respectively. However, the average block coverage is found to be
72.6%. This is partly due to the significant number of the remaining 1-2 storied dwellings and the new high-rise buildings following the MINB 2008 properly.
Table 10: Land coverage at block level in Dhanmondi
<table><tr><td>Block</td><td>Total area (sq.ft)</td><td>Total built up area (sq.ft.)</td><td>Land coverage per block (%)</td><td>Average Block coverage</td></tr><tr><td>1</td><td>792000</td><td>516600</td><td>65.2</td><td rowspan="4">72.6%</td></tr><tr><td>2</td><td>115200</td><td>55080</td><td>63</td></tr><tr><td>3</td><td>184400</td><td>158760</td><td>86.1</td></tr><tr><td>4</td><td>230400</td><td>175840</td><td>76.3</td></tr></table>
Block 1 provides a glimpse of the changing trend in terms of building function. This block had initially 18 plots (20 kathas) which were later sub divided into 24 plots. As being located along the secondary road (Road No. 27old/16new) Block 1 had been rezoned for commercial land use in 1996 through government circular and about $54.5\%$ of its buildings had been transformed from residential to mixed uses since then. Out of 24 plots 14 plots are occupied with high and mid-rise while the rest have 1-2 storied dwellings. The high-rise commercial buildings overlooking the adjacent low-rise buildings intrude on the privacy of these dwellings. Most of the new high-rise buildings comply with FAR rules by having a plot coverage ranging from 60 to 70 percent while the older constructions had violated the BCR 1996 rules.
In Block 2 the original nine (20 kathas) plots have sub divided into 18 plots. Out of 18 plots 15 are occupied with mid- and high-rise buildings, and the rest of the 3 plots with low rise buildings. In terms of plot coverage Block 2 indicates a pattern with a highest $78\% -80\%$ which is causing encroachment of privacy and blockage of ventilation and sunlight in the interior rooms. The block has a 4 storied school, karate training center and a heritage site (Shahi Eid Gah and 6 storied mosque). The school is housed in a residential building and is not permissible land use here. The access roads around this block are 18-20 feet wide, which is sufficient for the traffic caused by the school during peak hours. Furthermore, a significant portion of the effective of
width of the access roads around the school serves as parking spaces for the school buses which even worsens the situation.
Table 11: Net Residential Density and Net Residential Population Density at block level in Dhanmondi
<table><tr><td>Block</td><td>Net Residential Density (NRD) units /hectare</td><td>Net Residential Population Density (NRPD) persons /hectare</td></tr><tr><td>1</td><td>72</td><td>331</td></tr><tr><td>2</td><td>100</td><td>924</td></tr><tr><td>3</td><td>164</td><td>757</td></tr><tr><td>4</td><td>165</td><td>763</td></tr></table>
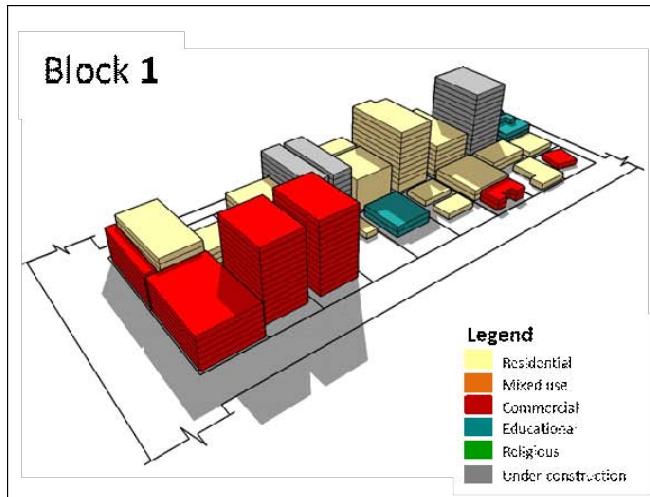
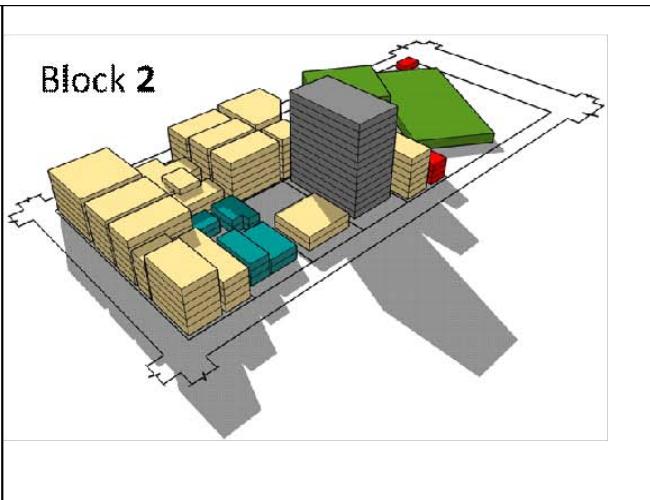
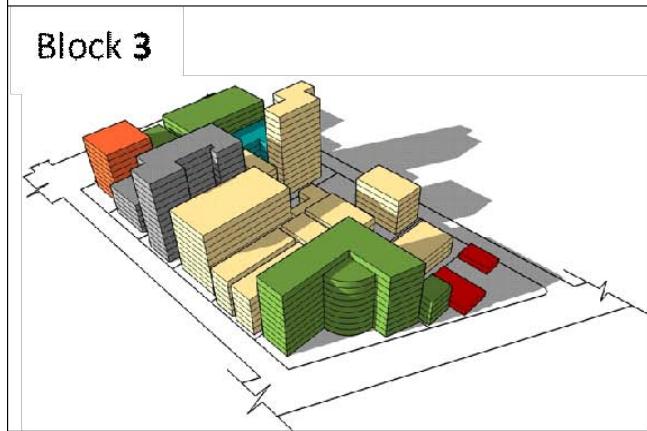
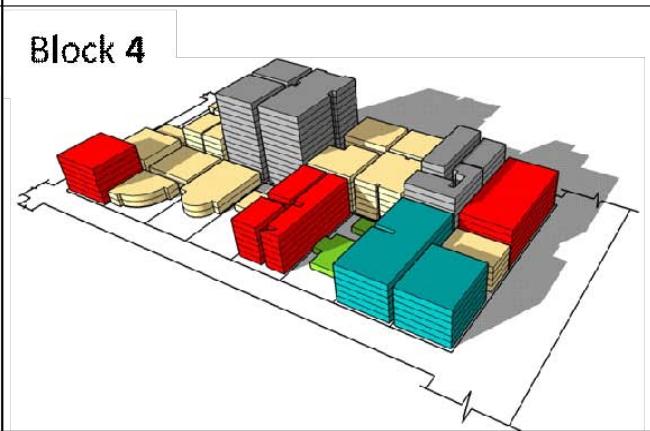 Figure 18: Shadowing of the buildings and the adjacent roads, Dhanmondi
Source:Field Survey,2016
Block 3 is located in between the primary (Mirpur Road) and secondary road (Green Road). The block had 12 blocks initially, but later subdivision resulted into a total of 19 plots. Out of the 19 plots, 8 plots have land coverage between 80 to 90 percent housing 4 to 10 storied buildings. The other 3 plots are undergoing the construction of 10-13 storied high-rise buildings complying with MINB 2008 while the older buildings did not adhere to the setback rules of BCR1996 with a land coverage ranging between 80 to constructed 14 storied residential apartments in the middle. These towers have followed the recommended FAR leaving ample setback spaces around. But still these high-rise towers are overshadowing the nearby road and adjacent houses which results in lack of sunlight and privacy in the adjacent buildings.
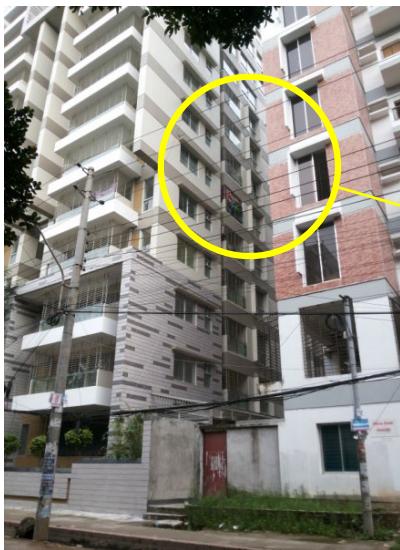
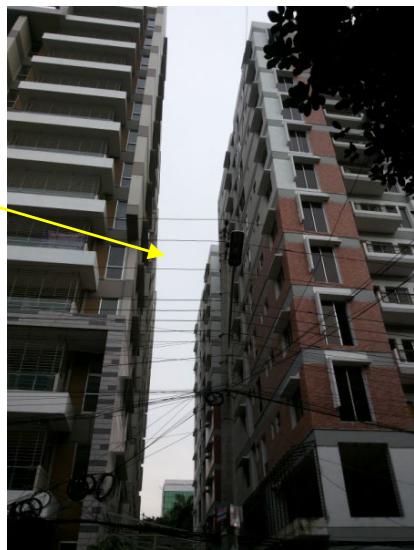 Figure 19: Requisite side setbacks maintained according to FAR between newly built high rise buildings blocks, Block-4, Dhanmondi
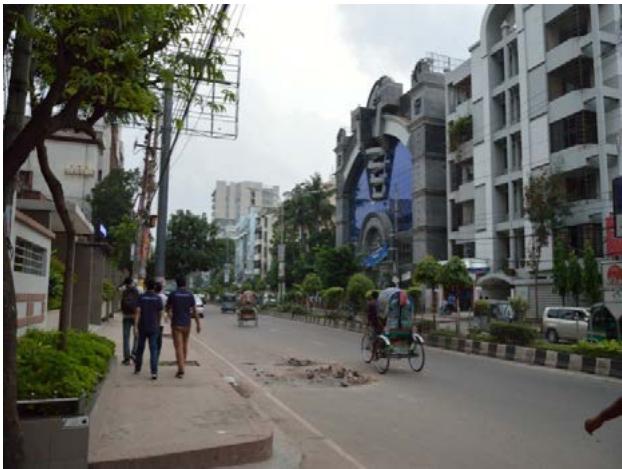 Figure 20: Block 1; Dhanmondi
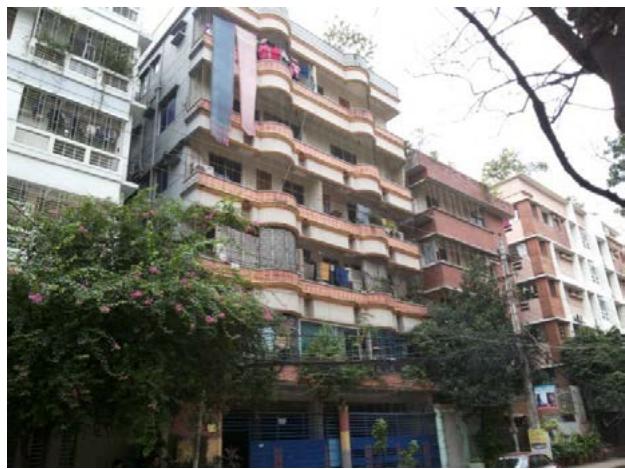 Figure 21: Block 2; Dhanmondi
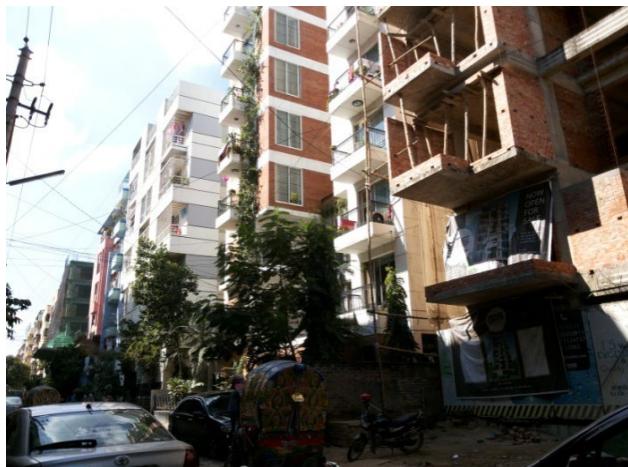 Figure 22: Block 3; Dhanmondi
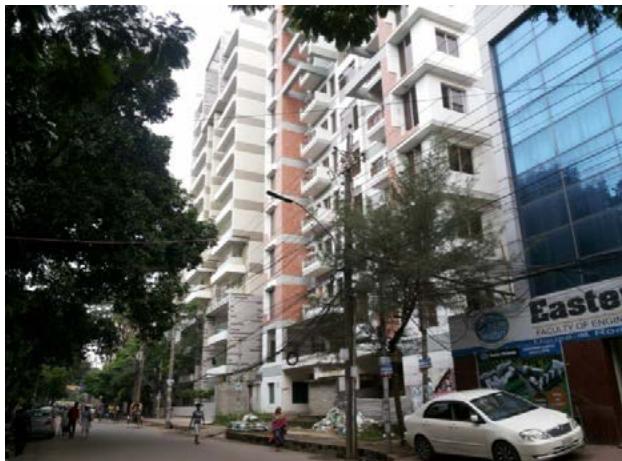 Figure 23: Block 4; Dhanmondi
## vi. Spatial growth pattern in Dhanmondi
The emerging spatial growth pattern in Dhanmondi depicts a compact form of settlement with uniform height pierced by a continuous belt of high-rise towers creating a buffer zone between the major transport arteries and the inner residential blocks. The trend of vertical expansion with mixed land use is relatively faster in the peripheral blocks along the primary (Mirpur Road) and secondary roads (Satmasjid Road, Road No. 27 and Road No. 2) than the inner blocks. Most of the commercial activities accommodated in these towers are not compatible with neighborhood scale. The weak enforcement of the law is leading to the illegal infiltration of commercial activities across the residential area causing negative externalities like increased traffic concentration, air, and noise pollution particularly intense at the peak hours.
### c) Luxmi Bazaar Residential Area (Ward No. 78)
## i. Land use and Building Guidelines for Luxmi Bazaar
Luxmi Bazaar of Ward No. 72 is one of the oldest residential settlements which predates to the
Mughal period. The area can be characterized with a complex organically evolved pattern of narrow winding street network forming the boundaries of different neighbourhoods or mohallas. The organic street pattern of Luxmi Bazaar results in a mosaic of plots with a rich diversity of irregular shapes and sizes. However, the settlement has no open spaces. The only open space in the vicinity is the poorly maintained historic Victoria Park. The area is a highly compact settlement predominated by high rise buildings ranging from 5-10 stories. In old Dhaka many structures constructed before partition of India, have been demolished and replaced with new buildings augmented both horizontally and vertically. Most of the buildings have been non-adherent to the Building Codes. However, the area still possesses some historic dwellings conforming to distinct architectural style from the Colonial Period and which are in a vulnerable state for lack of proper maintenance and preservation.
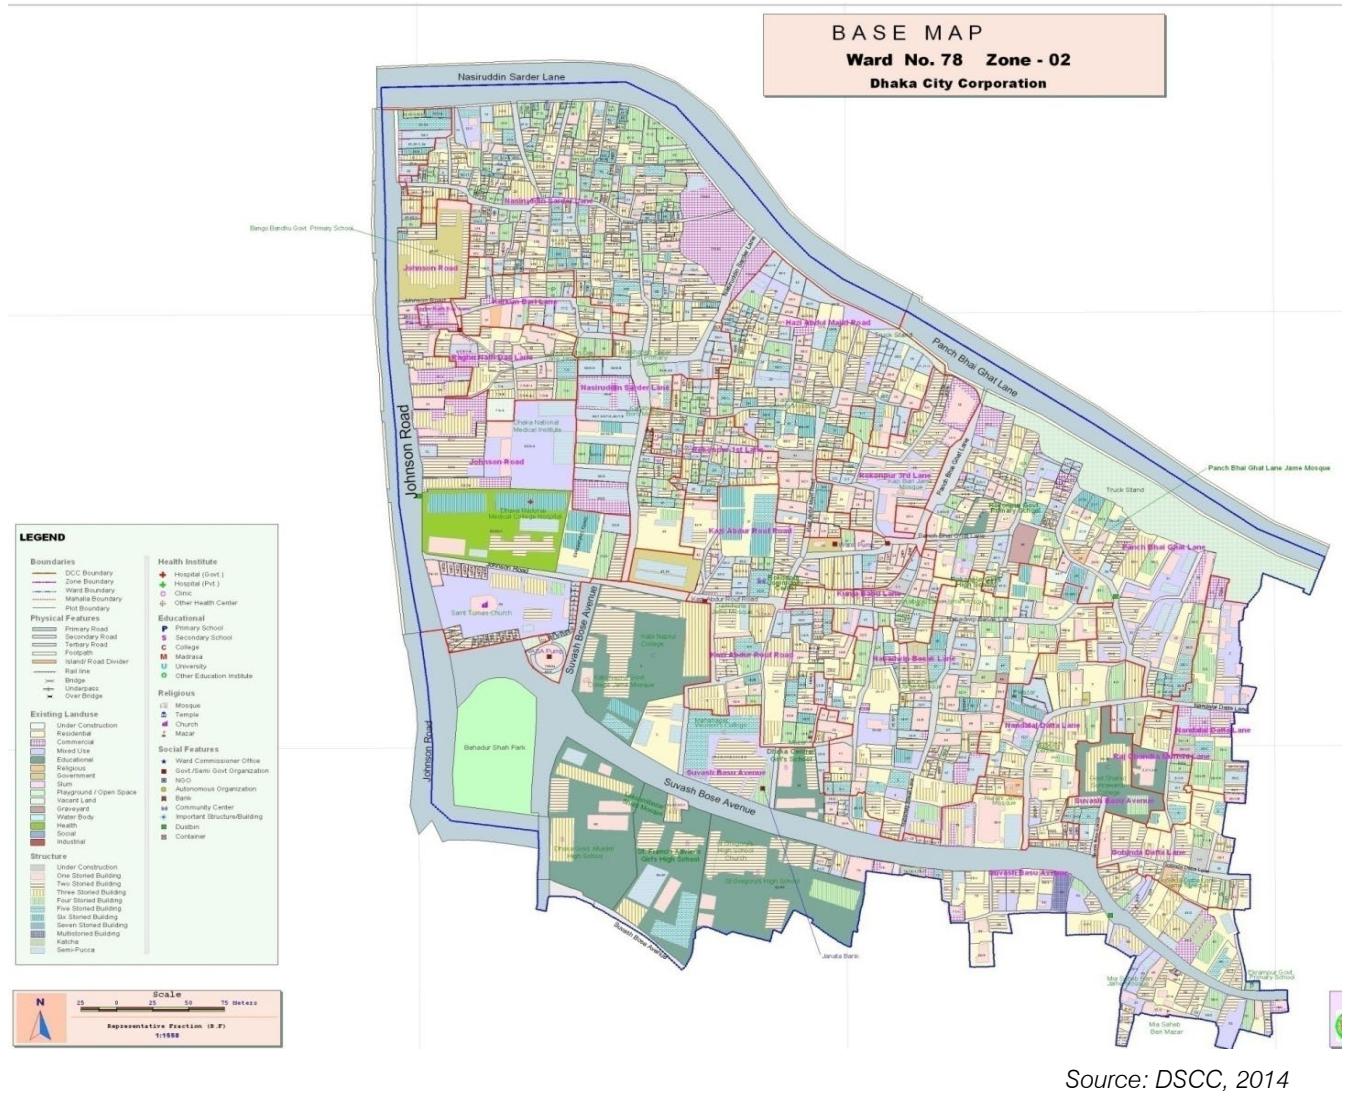 Figure 24: Land use map of Luxmi Bazaar
## ii. Changing landscape of building heights in Luxmi Bazaar
In the Colonial period the settlement was predominantly occupied by 1-2 storied houses. From the mid-1970s to 1990s, around $35\%$ of the houses were extended up to 3-4 stories. Due to the proximity to the Old CBD and educational facilities, this area has always been a preferable location for rental accommodation.
From the late nineties high rise buildings of 6-8 stories with mixed function started to emerge. At present approximately $80\%$ of the area is covered with high rise buildings out of which $30\%$ are 10-12 stories high. Some of the irregular narrow plots created some very slender high-rise buildings which are highly vulnerable to earthquake.
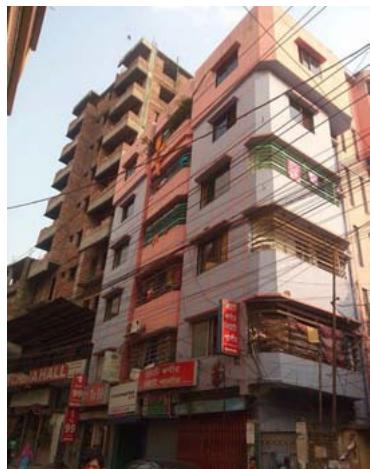 Figure 25: Emergent high-rise buildings in Luxmi Bazaar
Table 12: Trend of building height change in Luxmi Bazaar (2004 - 2016)
<table><tr><td>No. of Stories</td><td>2004</td><td>Lane 1 2010</td><td>2016</td><td>2004</td><td>Lane 2 2010</td><td>2016</td><td>2004</td><td>Lane 3 2010</td><td>2016</td></tr><tr><td>1</td><td>11</td><td>7</td><td>7</td><td>14</td><td>11</td><td>6</td><td>6</td><td>5</td><td>4</td></tr><tr><td>2</td><td>7</td><td>7</td><td>6</td><td>9</td><td>5</td><td>4</td><td>8</td><td>7</td><td>4</td></tr><tr><td>3</td><td>7</td><td>7</td><td>6</td><td>2</td><td>3</td><td>2</td><td>5</td><td>4</td><td>5</td></tr><tr><td>4</td><td>4</td><td>5</td><td>3</td><td>2</td><td>2</td><td>3</td><td>1</td><td>3</td><td>4</td></tr><tr><td>5</td><td>6</td><td>6</td><td>7</td><td>1</td><td>1</td><td>3</td><td>-</td><td>3</td><td>3</td></tr><tr><td>6</td><td>4</td><td>3</td><td>5</td><td>-</td><td>4</td><td>5</td><td>1</td><td>3</td><td>6</td></tr><tr><td>7</td><td>2</td><td>2</td><td>2</td><td>-</td><td>1</td><td>3</td><td>1</td><td>1</td><td>1</td></tr><tr><td>8</td><td>-</td><td>1</td><td>3</td><td>-</td><td>-</td><td>-</td><td>1</td><td>1</td><td>1</td></tr><tr><td>9 and above</td><td>-</td><td>-</td><td>1</td><td>-</td><td>-</td><td>-</td><td>-</td><td>-</td><td>-</td></tr><tr><td>Total</td><td>41</td><td>38</td><td>40</td><td>28</td><td>27</td><td>26</td><td>24</td><td>27</td><td>28</td></tr></table>
 iii. Plot Coverage
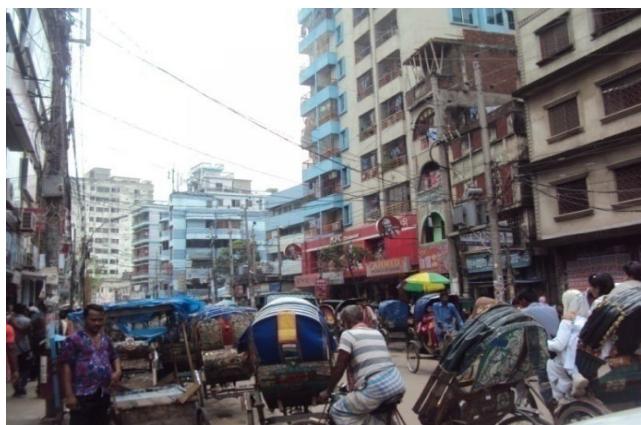
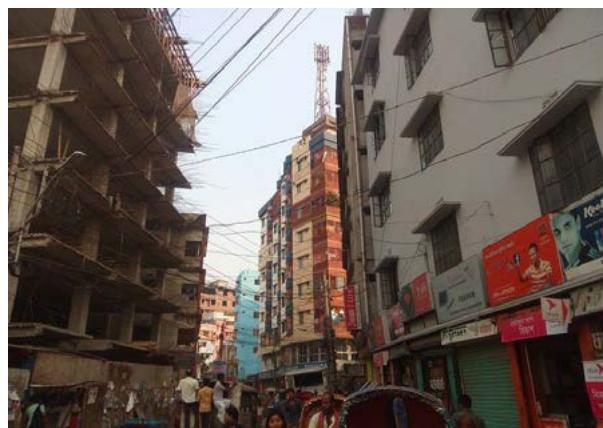 Figure 26: Streetscape of Luxmi Bazaar (Shubose Bose Road)
The existing road widths are less than 60 feet wide making the prevailing FAR guidelines inapplicable for this area. Survey shows that $77.6\%$ plots have plot coverage ranging from $81\%$ to $90\%$ while $9.6\%$ plots have ground coverage of $91\% - 100\%$. Many of these plots face roads which are 10-12 feet wide.
Table 13: Plot coverage in Luxmi Bazaar
<table><tr><td>Plot coverage (%)</td><td>Number of Plots</td><td>Percentage</td></tr><tr><td>50 or less</td><td>-</td><td>-</td></tr><tr><td>51-60</td><td>-</td><td>-</td></tr><tr><td>61-70</td><td>4</td><td>4.2</td></tr><tr><td>71-80</td><td>8</td><td>8.5</td></tr><tr><td>81-90</td><td>73</td><td>77.6</td></tr><tr><td>91-100</td><td>9</td><td>9.6</td></tr><tr><td>Total</td><td>94</td><td>100</td></tr></table>
## iv. Floor Area Ratio (FAR)
The Floor Area Ratio of the blocks surveyed in Luxmi Bazaar was observed to be ranging from 0.9 to 5.7 in older buildings while the new buildings have FAR ranging from 5.4 to 8. Both the former and recent constructions are violating the recommended FAR to a greater extent. Around $90\%$ of buildings are found not abiding the setback rule. Even high-rise buildings were found with shared external walls in Nobodip Bashak Lane.
Table 14: Floor Area Ratio for Blocks 1, 2 and 3 in Luxmi Bazaar
<table><tr><td>FAR</td><td>Nandolal Dutt Lane</td><td>Panch Bhai Ghat Lane</td><td>Nobodip Bashak Lane</td></tr><tr><td>0.5 – 1.0</td><td>4</td><td>1</td><td>5</td></tr><tr><td>1.0 – 1.5</td><td>-</td><td>1</td><td>-</td></tr><tr><td>1.5 – 2.0</td><td>5</td><td>6</td><td>3</td></tr><tr><td>2.0 – 2.5</td><td>5</td><td>1</td><td>1</td></tr><tr><td>2.5 – 3.0</td><td>2</td><td>3</td><td>1</td></tr><tr><td>3.0 – 3.5</td><td>3</td><td>5</td><td>-</td></tr><tr><td>3.5 – 4.0</td><td>2</td><td>1</td><td>5</td></tr><tr><td>4.0 – 4.5</td><td>4</td><td>2</td><td>1</td></tr><tr><td>4.5 – 5.0</td><td>1</td><td>2</td><td>1</td></tr><tr><td>5.0 – 5.5</td><td>4</td><td>3</td><td>6</td></tr><tr><td>5.5 – 6.0</td><td>1</td><td>2</td><td>-</td></tr><tr><td>6.0 – 6.5</td><td>1</td><td>-</td><td>1</td></tr><tr><td>6.5 – 7.0</td><td>1</td><td>1</td><td>1</td></tr><tr><td>Total</td><td>33</td><td>28</td><td>25</td></tr></table>
## v. Ground Coverage at block level
Results from the survey indicate that Luxmi Bazaar has the highest block coverage (89.4%) among the study areas. This implies that almost 90% of the dwellings employed the highest possible ground coverage forming an exceptionally dense settlement pattern. From the reconnaissance survey it was found that the spatial pattern of Luxmi Bazaar had inter woven tree like road networks with cul de sacs contributing to no defined block boundary. Instead of blocks the area is identified through the name of its lanes or streets. Therefore, for detailed study instead of blocks three lanes with the first row of plots along both sides of them had been selected. The aggregate plot areas is considered as the block area for this study.
Table 15: Land coverage at block level in Luxmi Bazaar
<table><tr><td>Lane</td><td>Total area (sq.ft)</td><td>Total built up area (sq.ft.)</td><td>Land coverage per block (%)</td><td>Average Block coverage</td></tr><tr><td>Nandolal Dutta Lane</td><td>140296</td><td>112629</td><td>89.2</td><td rowspan="3">89.4%</td></tr><tr><td>Panch Bhai Ghat Lane</td><td>101937</td><td>89500</td><td>87.8</td></tr><tr><td>Nobodip Bashak Lane</td><td>90064</td><td>82138</td><td>91.2</td></tr></table>
The result of the empirical observation indicates that Nobodip Bashak Lane has one of the highest ground coverages of $91.2\%$ at block level followed by
89.2 and $87.8\%$ in Nandolal Dutta Lane and Panch Bhai Ghat Lane respectively.
Table 16: Net Residential Density and Net Residential Population Density along the road front plots of the study lanes in Luxmi Bazaar
<table><tr><td colspan="3">Luxmi Bazaar</td></tr><tr><td>Lane</td><td>Net Residential Density
units /hectare</td><td>Net Residential Population Density
persons /hectare</td></tr><tr><td>Nandolal Dutta Lane</td><td>128</td><td>643</td></tr><tr><td>Panch Bhai Ghat Lane</td><td>140</td><td>701</td></tr><tr><td>Nobodip Bashak Lane</td><td>220</td><td>1104</td></tr></table>
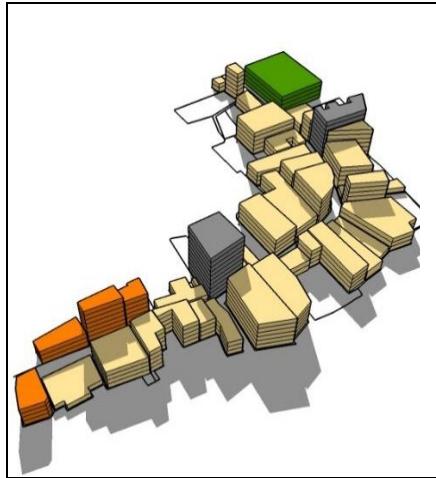 Figure 27: The emerging buildings of Luxmi Bazaar
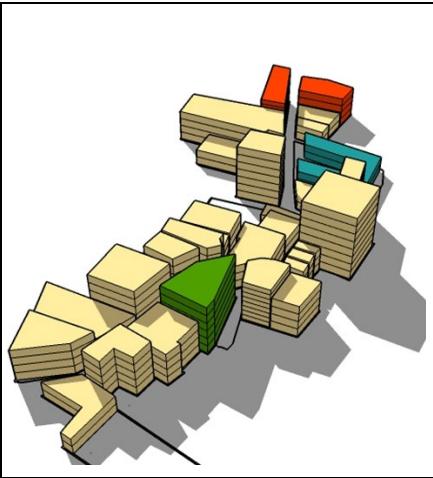
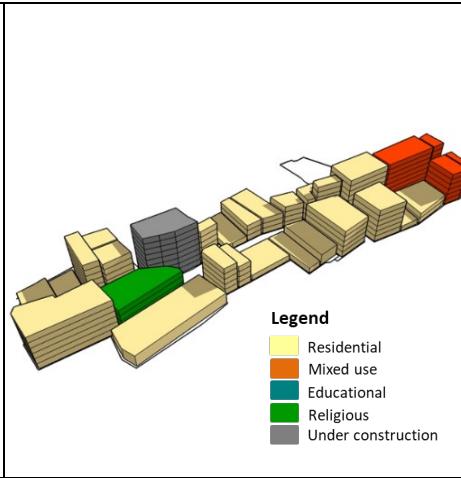 Figure 28: Shadowing of the buildings and adjacent alleys, Luxmi Bazaar
Source:Field Survey,2016
Nandolal Dutta Lane was inhabited by the elite class back in 1950s when this narrow lane was flanked with single and double storied colonial style courtyard houses. The lane has varying width where the highest width is 20 feet and lowest is 15 feet. A significant portion of its residents were wealthy Muslim refugees who migrated from India during partition and purchased property here through exchange system. Most of these Muslim residents were well educated and employed in public and private service (interview of a local resident, November 7, 2015). The residential density of the area increased substantially with the $2^{\text{nd}}$ and $3^{\text{rd}}$ generation of these inhabitants during the decades of the 1970s and 1980s. With the increase in the number of family
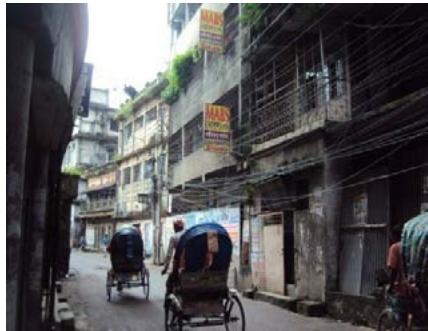 Figure 29: Nandolal Dutta Lane
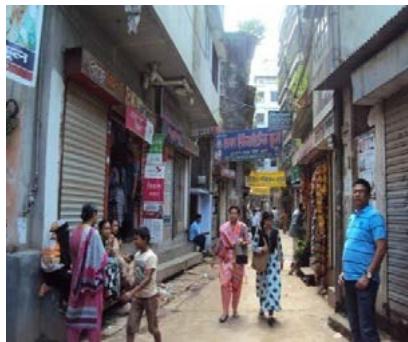 Figure 30: Nobodip Bashak Lane
members people were retrofitting their single-story dwellings with additional floor or rooms. By the end of 1980s a couple of low-rise dwellings were replaced by 5-6 storied mid-rise buildings. With the advent of the fourth generation during the 1990s the redevelopment activity exacerbated with mid- and high-rise buildings. By the end of 1990s around $80\%$ of the single and double storied houses were diminished. At present only $2\%$ of the single and double storied houses are remaining and high-rise buildings of 8-10 are under construction in some of the plots. Most of the new high-rise buildings have plot coverage above $80\%$ whereas the older 4-6 storied buildings have plot coverage ranging from $88\%$ to $89\%$.
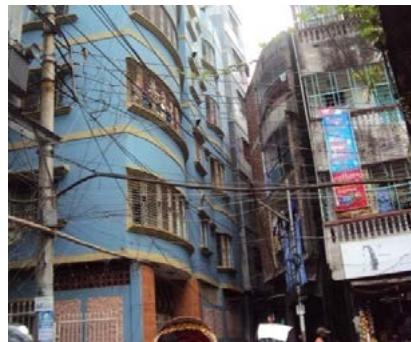 Figure 31: Panch Bhai Ghat Lane
Nobodip Bashak lane is characterized by a labyrinth of meandering narrow lanes 5-8 feet spreading out in various directions. Starting from the primary road (Shubas Bose Road) the lane is 16 feet wide at its entry point and 4.5 feet in its narrowest part. Both sides of the lane are flanked with 5-6 storied buildings with a maximum 1.5 feet setback space between buildings. In some cases, the distance of the balconies between facing buildings is less than 1.5 feet while two adjacent high-rise buildings are often found sharing the same external wall. The alleys are extremely narrow, often 4 feet wide with open drains on both sides. These alleys are only used as pedestrian pathways with 5-6 storied buildings overshadowing them. Various occupational groups reside here but a significant portion of them are service holders. There are a couple of mixed-use buildings in the entry point and a 4 storied mosque in the middle of the lane. The plot coverage ranges between 80 to 90 percent, in some cases even higher. With the highest plot and block coverage the high-rise dwelling of this dense neighborhood receives minimal solar access and natural ventilation.
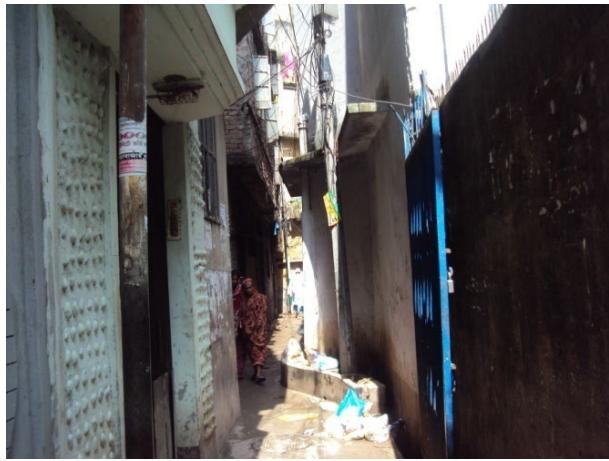 Figure 32: Narrow 4 feet wide alleys of Nobodip Bashak lane
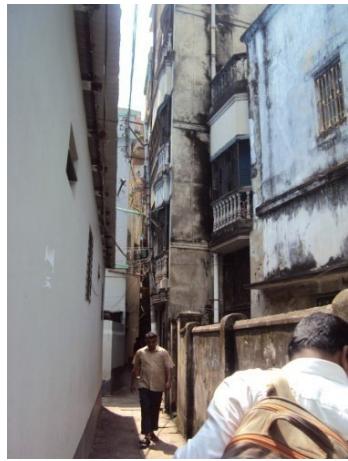 Figure 33: Indequate penetration of sunlight
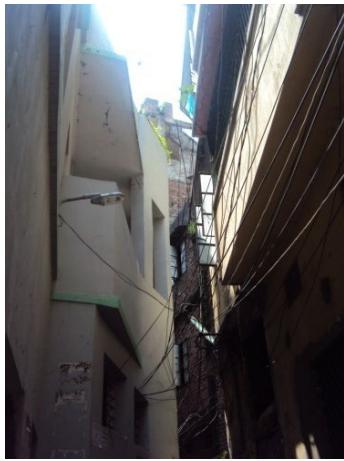 Figure 34: Very close juxtaposition of buildings
Panch Bhai Ghat Lane is dominated by mid and high-rise buildings throughout its length. There is a 6 storied mosque and 2 storied government primary school (Rokonpur Primary School) in this lane. With plot coverage ranging from $81\% - 87\%$ the buildings of this neighborhood are also devoid of adequate sunlight and privacy.
## vi. Spatial growth pattern in Luxmi Bazaar
The plots of Luxmi Bazaar show a wider range of variation in terms of plot sizes and shapes since the area developed organically. In addition, the plots were subdivided without any planning by-laws and largely guided by Muslim inheritance law. The unguided redevelopment of Luxmi Bazaar with its relatively smaller plot size, has led to crammed housing with highly compromising condition in terms of sunlight, natural ventilation, and privacy. The settlement has already reached the saturation stage with tall buildings forming a densely packed maze-like urban fabric. And if this trend continues unchecked the livability condition will further deteriorate. The means of access for fire rescue operation prescribed in Bangladesh National Building Code (BNBC) should not be less than 4.8m or 14.74 feet. But in many places the width of the narrow lane of Luxmi Bazaar is below standard which makes the settlement more vulnerable in case of fire hazard. The lack of open space and narrow evacuation routes is likely to cause a massive proportion of casualties in case of natural catastrophes like earthquakes.
## III. DISCUSSION
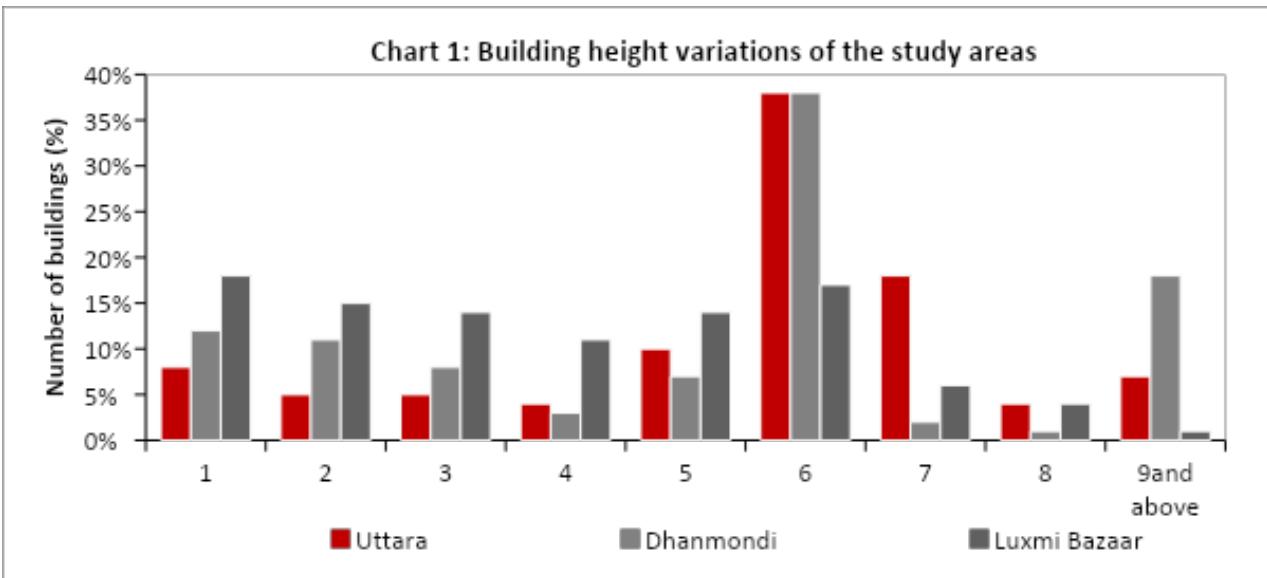
Overall, the densification process in Dhaka took place in three phases: firstly, by augmenting the low rise (1-2 storied) buildings with additional 1or 2 floors, secondly by infilling the vacant plots and replacing the low-rise buildings with mid-rise (6 stories) buildings and high-rise (above 6 stories) buildings and thirdly by encroaching wetlands for building high-rise residential complexes. The study areas revealed that, around the late 90s redevelopment activity in the existing low-rise buildings used to take place through horizontal expansion and construction of additional floors but in the later phase was done by replacing the low-rise dwellings with high rise buildings or filling up the vacant plots. By 2005 buildings above 7 stories were rampant across the city (STP 2005). In addition, the infiltration of commercial activities in the residential areas intensified the densification process by constructing mixed-use towers. The density gradient was found high along the arterial roads and receding in the inner blocks. Though the inner blocks of New Dhaka have moderate number of high-rise buildings (Chart 1) but if this trend continues unchecked it would deteriorate the spatial quality of both indoor and outdoor environment of the residential areas.
Table 17: Cross case analysis
<table><tr><td>Density Issues</td><td>Uttara</td><td>Dhanmondi</td><td>Luxmi Bazaar</td><td>Emerging Concerns</td></tr><tr><td>Building densification guidelines</td><td>Absence of any densification guidelineBCR 1996, MINB 2008 and Govt. circulars guide the setback, height, FAR and zoning modifications.</td><td>Absence of any densification guidelineBCR 1996, MINB 2008 and Govt. circulars guide the setback, height, FAR and zoning modifications.</td><td>There was no policy guidelines for densification</td><td>In New Dhaka developers were violating guidelines on coverage and FARWeak enforcement of zoning ordinance resulted in infiltration of commercial activities all over the settlement.In Old Dhaka no set back and land coverage rule is followed.FAR cannot be applied here for inadequate road width.</td></tr><tr><td>Changing urban fabric</td><td rowspan="2">Rapid transformation started from 2009Densification has reached 'optimum stage' in sector 2,4,6,8, 9,7,11 and 13 but densification is still in its infancy stage in sectors 5, 10, 12, 14Observed FAR 6.0-7.0 and maximum height 14 stories</td><td rowspan="2">Rapid transformation started in 2009.Densification has reached 'matured stage'Observed FAR 4.8 - 9.1 and maximum height 16 stories.</td><td rowspan="2">Rapid transformation started in 2005.Densification has reached 'saturation stage'Observed FAR 5.4-8 and maximum height 12 stories.</td><td rowspan="2">Violation of recommended standards by developers for maximizing profit.</td></tr><tr><td>Floor Area Ratio (FAR)</td></tr><tr><td>Plot Coverage</td><td>Observed maximum coverage in older buildings was 81% instead of recommended maximum plot coverage 70% (BCR 1996)Observed maximum plot coverage in new buildings was 78% instead of recommended 50-60% (MINB 2008)</td><td>Observed maximum coverage in older buildings was 85% instead of recommended maximum plot coverage 70% (BCR 1996)Observed maximum plot coverage in new buildings was 82% instead of recommended 50-60% (MINB 2008)</td><td>Observed maximum coverage in older buildings was 100%Observed maximum plot coverage in new buildings was 90% in absence of any applicable guideline</td><td>Violation of recommended standards by developers for maximizing profit.</td></tr><tr><td>Land coverage at block level</td><td>Recommended land coverage at block level was 75 and 80 percent for larger and smaller plot blocks respectively
Observed maximum land coverage at block level 76%</td><td>Recommended land coverage at block level was 75 and 80 percent for larger and smaller plot blocks respectively
Observed maximum land coverage at block level 86%</td><td>Observed maximum land coverage at block level 91%</td><td></td></tr><tr><td>Spatial growth pattern</td><td>Jagged skyline due to varying building heights comprising of low, mid and high rise building (10-14 stories) along the primary and secondary roads.
Most of the inner blocks have uniform skyline dominated with 5-6 storied buildings</td><td>Tall towers (10-12 stories) along the street forming more or less continuous skyline gradually receding towards the inner blocks.</td><td></td><td>Broken skyline leads to poor visual impression, unused spaces, and loss of privacy for low rise dwellings.
The broken skyline of Old Dhaka indicative of the crammed housing condition with dark alleys and uncomfortable indoor living condition in terms of natural ventilation, sunlight and privacy.</td></tr></table>
 Source:Field Survey,2016
## IV. CONCLUSION AND RECOMMENDATION
Unguided densification may adversely affect the spatial environment which is evident in this study. In the absence of any densification policy, the residential areas of Dhaka were densified with a single building type (high-rise building above six floors with a small footprint) which tends to decrease natural ventilation, solar exposure, visual and acoustic privacy, and obstruction of views. This further increased the need for artificial lighting and air conditioning, thus increasing energy consumption. Based on the observations the following recommendations are suggested. A comprehensive densification plan based on the site-specific projected density, site potential, land use mix, connectivity, and socio-cultural context needs to be formulated before any densification operation. Instead of sticking to high-rise buildings other housing types preferably mid-rise with high built-up densities suitable for tropical climates need
to be explored. A mix of high, medium, and low-rise buildings with high densities can be achieved through appropriate zoning policies which would decrease the cramped feeling. Plots of higher values may be combined to get the benefit of a higher Floor Area Ratio (FAR). Nonetheless, contextual density zoning for the residential areas of the city needs to be formulated to achieve the desired outcomes of densification.
[^6]: storied buildings have higher plot coverage around $85\%$ and 4 of the newly constructed buildings have plot coverage ranging from $68\%$ to $75\%$. This indicates a violation of both old and new law. The subsequent subdivision had created three rows of buildings in $30\%$ _(p.13)_
[^13]: storied buildings. In terms of land coverage Block 4 indicates $76.3\%$ with individual plot coverage ranging between $30 - 85\%$. Out of 29 plots 13 earlier constructed 4 _(p.13)_
[^90]: percent. Block 4 has one of the highest levels of densification with $80\%$ of its plots occupied with 4 _(p.13)_
Generating HTML Viewer...
References
18 Cites in Article
M Mahmudul Hasan,S Nawshad Hossain,Tanvir Ahmad (2008). Impact of Ribbon Development on Land Use along Dhaka Aricha Highway. The Case of Savar Upazila.
S Afrin,I Zerin,S Sharmin,K Morshed (2009). Transformation of Dhanmondi Residential Area-Causes, Effects and Proposal to Rejuvenate.
Bnbc (1993). Bangladesh National Building Code, Government of Bangladesh.
A Churchman (1999). Disentangling the concept of density.
R Haughey (2005). High-density development: Myth and fact.
J Jacobs (1961). The Death and Life of Great American Cities.
M Jenks,N Dempsey (2005). Future Forms and Design For Sustainable Cities.
(2009). Competitive Cities and Climate Change.
Minb (2008). NirmaN: An Online Construction Management System (OCMS).
F Nilufar (2013). Urban life and use of Public Space Study of responsive public open spaces for supporting urban life in Dhaka City.
D Owen (2009). Green Metropolis: Why Living Smaller, Living Closer, and Driving Less Are the Keys to Sustainability by David Owen (review).
W Smith (1984). Mass transport for high-rise high-density living.
Hyungun Sung,Sugie Lee (2015). Residential built environment and walking activity: Empirical evidence of Jane Jacobs’ urban vitality.
Arfan Uzzaman,Tahsina Akhter,Md Rahman,M Waliullah (2005). IMPACT OF GFMIS-DRIVEN FINANCIAL TRANSPARENCY ON STRATEGIC MARKETING DECISIONS IN GOVERNMENT AGENCIES.
The Urban Task Force (1999). Towards an Urban Renaissance.
The Urban Task Force (2005). Towards an Urban Renaissance.
(2000). Achieving sustainable urban form.
Katie Williams (2000). Does Intensifying Cities Make them More Sustainable?.
No ethics committee approval was required for this article type.
Data Availability
Not applicable for this article.
How to Cite This Article
Syeda Jafrina Nancy. 2026. \u201cAn Investigation of the Densification Process of the Residential Areas of Dhaka\u201d. Global Journal of Human-Social Science - B: Geography, Environmental Science & Disaster Management GJHSS-B Volume 23 (GJHSS Volume 23 Issue B4).
Explore published articles in an immersive Augmented Reality environment. Our platform converts research papers into interactive 3D books, allowing readers to view and interact with content using AR and VR compatible devices.
Your published article is automatically converted into a realistic 3D book. Flip through pages and read research papers in a more engaging and interactive format.
Our website is actively being updated, and changes may occur frequently. Please clear your browser cache if needed. For feedback or error reporting, please email [email protected]
Thank you for connecting with us. We will respond to you shortly.