The research team at ERAU and UTHSCSA analyzed the effects of suborbital flight stressors and various light conditions (red, white, no light) on the Arthrospira platensis (Spirulina), onboardBlue Origin’s New Shepard vehicle. Commercially available cyanobacterium species werecultivated and closely monitored in mother colonies several months before the suborbital flight mission. The aim of this study was to estimate the biomass production and growth as a potential dietary alternative for prospective human spaceflight’s life support system. Spirulina samples were flown in a NanoLab with adjacent avionics supporting the light conditions and sensors to monitor the temperature, relative humidity, and accelerations. The various flight parameters measured in the NanoLab were validated with the flight data gathered by Nanoracks, the flight integrator. Thus, we also assessed the effect of microgravity and different light conditions on the gene expression. Our data indicates that the Spirulina samples onboardthe rocket had significant (p < 0.01-0.0001) downregulation of majority of thegene expression.
## I. INTRODUCTION
Future human spaceflight exploration to expand and sustain human presence in low-Earth orbit (LEO) and eventually to the Moon requires hybrid systems that can support human health, life support and habitation systems, such as food preparation, processing, and preservation in various environments. These are several research factors that space agencies (NASA and ESA) are further exploring to better understand key technologies that can support and enhance human health performance and environmental control life support systems (Fahrion J, Mastroleo F, Dussap C-G & Leys, 2021). Plant growth has no major obstacles in space if its environment has proper ventilation, lighting, and temperature and humidity control. To promote a sustainable human presence in space, large scale food production is required (most food supplied to astronauts is ferried with space vehicles to the International Space Station) but large-scale test for food production in reduced gravity is still a paradigm since special electrical equipment sets a limit for the large-scale plant production (Poulet, Fontaine & Dussap, 2016)
Spirulina (Arthrospira sp.) is a blue-green microalgae dated back to 3.5 billion years and is the most well-known of algae among other types, such as the spirulina maxima and fusiformis (Moraes, Arruda, Maresca, Antune & Moraes, 2012). Spirulina is a filamentous cyanobacteria (micro-algae) characterized by cylindrical, multicellular trichomes in an open left-handed helix. Spirulina platensis has been used as human food in Africa, Asia, and South America, whereas Spirulina maxima is confined to Central America. Spirulina platensis flourishes around $25^{\circ}\mathrm{C} - 26^{\circ}\mathrm{C}$ with high alkaline pH (9.5-11).
Spirulina platensis is considered a potent nutrient-dense whole food with about $65\% -71\%$ protein content, rich in vitamins A in the form of beta carotene, B complex, and highly rich in minerals, such as potassium, calcium, zinc, magnesium, manganese, selenium, iron, and phosphorus (Mukhopadhyay, 2015). It is low in fat, but does contain vital essential fatty acids, including very high amounts of Gamma Linolenic Acid (GLA). GLA is a hormone precursor and is found conducive to healthy heart functioning and circulation. It also has anti-inflammatory properties, which are beneficial for skin and hair. It has been hailed as the "food of the future", besides being considered as an ideal food for astronauts by NASA (Poulet, 2016). Spirulina was consumed by the ancient Aztecs but became popular again when NASA proposed that it could be grown in space for use by astronauts.
With our present study, we intend to provide further insight of the environment in which our experiment was exposed to including preflight, launch site and post-flight operations after our experiment was successfully flown in the suborbital flight aboard Blue Origin's New Shepard vehicle launched on May 2, 2019, from West Texas Launch Site. This study also provides laboratory findings about the cultivation and production of biomass of the Spirulina platensis, ribonucleic acid (RNA) extraction and confocal microscopy – tools that can help maturing prospective experiments and leveraging flight operation efforts. Finally, in this study, we share our insights on gene expression analyses obtained from flown spirulina samples which were compared to the ground controls.
Previous work on the cultivation of Spirulina platensis up to 25 days conducted by Kumar, Kulshreshtha, and Singh (2011) has shown a wide range of temperature tolerance $(20.0^{\circ}\mathrm{C} - 40^{\circ}\mathrm{C})$ and various light intensity (lux) ranges (500 lux – 3,500 lux with dry weight of about $0.5\mathrm{g / L}$ and $0.6\mathrm{g / L}$ for 1,000 lux and 1,500 lux, respectively at the end of the $25^{\text{th}}$ day. The ideal temperature for Spirulina platensis is around $35^{\circ}\mathrm{C}$. Any deviation from this value will affect its productivity and at $17^{\circ}\mathrm{C}$, Spirulina can enter a dormant state where the biological processes stop but the viability continues (Keller et al., 2021).
Research by Delrue et al. (2017) conducted Spirulina platensis cultivation for 28 days (dry weight 0.7-1.1 g/L) and 40 days (dry weight 2-2.1 g/L). Research work by Yim et al. (2016) showed spirulina platensis cultivation times of 10 days under various light sources and light intensities (200 lux - 2,000 lux) with overall dry weight up from about 0.01 g/L to near 1.2 g/L and most cases around 0.4 g/L. Other studies by Kumari, Pathak and Guria (2015) showed the spirulina growth under various light emitting diodes intensities with yields between 0.8 g/L to 1.2 g/L after 18 days cultivation. More recent work by Prates, Radmann, Duarte, Greque de Morais and Costa (2018) revealed Spirulina platensis biomass production yields about 0.8 - 1.8 g/L for various LEDs for 10 days cultivation period. Research by Moraes et al. (2012) cultivated Spirulina platensis for 23 days under controlled temperature $(30^{\circ}\mathrm{C})$. Research work by Wang, Fu, and Liu (2007) provided Spirulina platensis dry weights of up to 0.4 g/L for 5 days cultivation period using several light intensities (l) and a mathematical growth model which can be used for our system.
$$
\mu_ {r e d} = 0. 0 2 \frac {g}{d a y} + \frac {0 . 4 4 \frac {g}{d a y} \cdot \left| \left(I - 3 9 1 . 3 \frac {\mu m o l}{s \cdot m ^ {2}}\right) \right|}{4 6 1 . 2 \frac {\mu m o l}{s \cdot m ^ {2}} + \left| \left(I - 3 9 1 . 3 \frac {\mu m o l}{s \cdot m ^ {2}}\right) \right|}
$$
$$
\mu_ {w h i t e} = 0. 0 2 \frac {g}{d a y} + \frac {0 . 3 2 \frac {g}{d a y} \cdot \left| \left(I - 3 9 8 . 4 \frac {\mu m o l}{s \cdot m ^ {2}}\right) \right|}{7 7 3 . 5 \frac {\mu m o l}{s \cdot m ^ {2}} + \left| \left(I - 3 9 8 . 4 \frac {\mu m o l}{s \cdot m ^ {2}}\right) \right|}
$$
Other research by Pandey, Tiwari, Singh, and Tiwari (2011) showed Spirulina maxima incubated at $30 \pm 2^{\circ}\mathrm{C}$.
## II. DESIGN, METHODOLOGY AND APPROACH
### a) Spirulina Feasibility Studies
Spirulina Alga-Gro seawater medium was obtained from Carolina Biological Supply Company. To make 1 L of Alga-Gro, we added 20 mL of concentrate to 980 mL of pasteurized seawater from Daytona Beach Shores. The Nitrogen, Phosphorus and Potassium (NPK) rating of the Alga-Gro is 10 ppm phosphates and 72 ppm nitrates (no potassium concentration is given). The optimum growth for this spirulina is $22^{\circ}\mathrm{C}$.
The algae were cultured in media prepared from "pasteurized" seawater heated to about $70^{\circ}\mathrm{C}$ for 45 minutes, then left undisturbed at ambient temperature for about 1 day before using with the algae concentrate. Two identical 2L tanks (40mL of concentrate and 1960 mL of pasteurized sea water in each tank) were used in the cultivation process (see Figure 1).
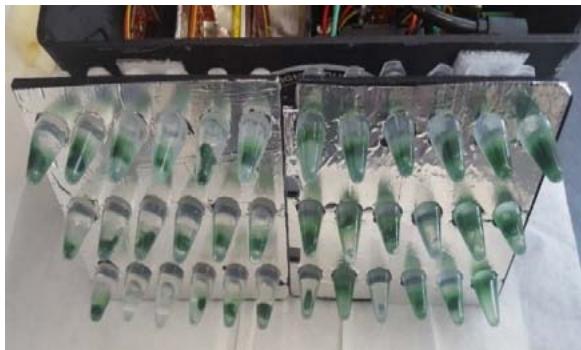
Before flight, cultivation (Figure 1) of the Spirulina platensis was conducted for about 27 days with a photoperiod of 12 hours light/dark provided by white fluorescent lamps at a light intensity of 2,500 lux and temperature of $24.0 \pm 2.0^{\circ}\mathrm{C}$. After 27 days, small samples of spirulina were taken and placed on $1.5\mathrm{ml}$ Eppendorf conical tubes and studied for feasibility before flight.
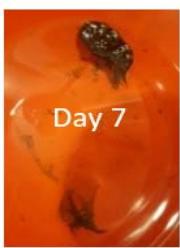
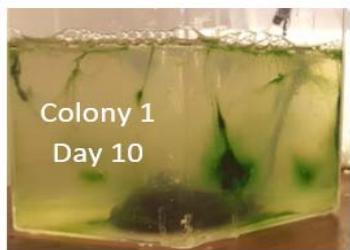
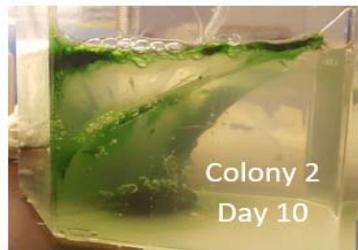
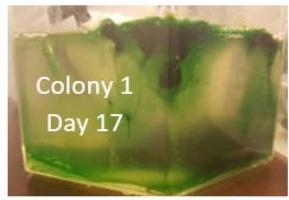
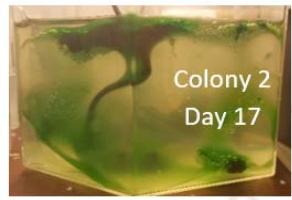
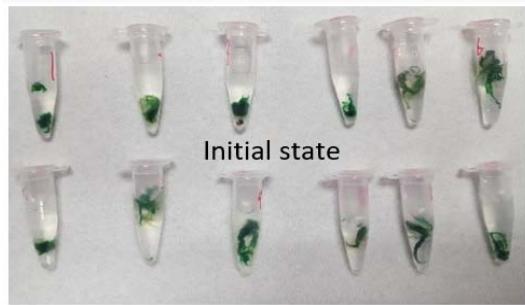
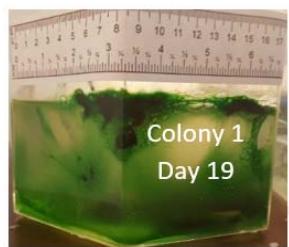
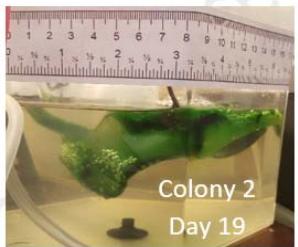
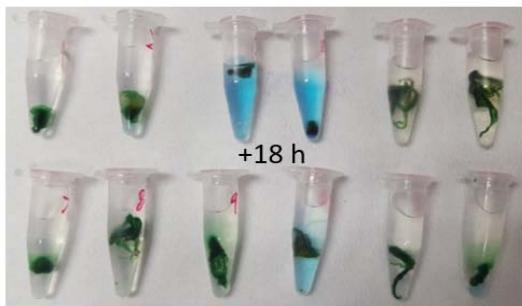
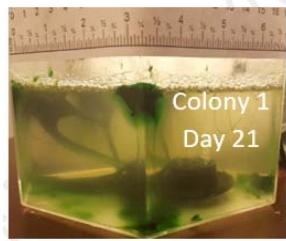
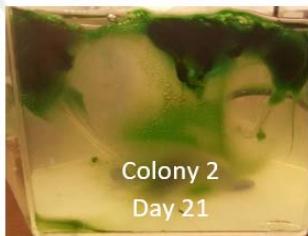
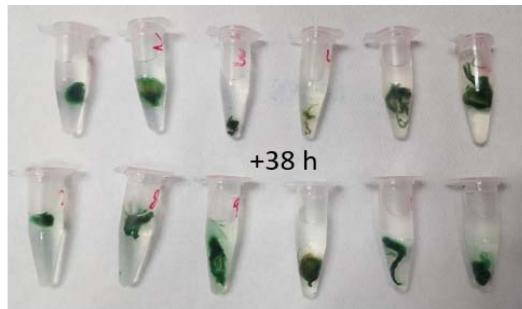
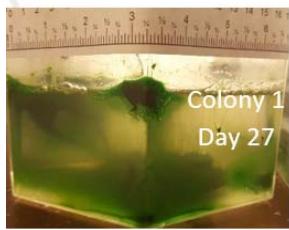
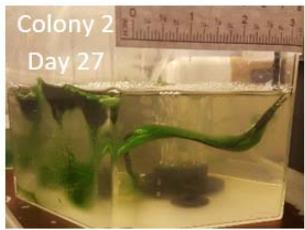 Figure 1: Spirulina growth chamber preflight feasibility studies. Day 1. Day 7. Day 10. Day 17. Day 19. Day 21. Day 27. Spirulina samples in tubes at initial state, after 18 hours (showing discoloration) and after 38 hours.
Two main colonies (Figure 1) for about 27 days were used to assess the preliminary survivability tests on the algae before flight. Both tanks have been cultured and were periodically replenished by sea water with added nutrients to allow the algae to grow and flourish.
We hypothesized the algae to survive for at least several days without showing any signs of deterioration. However, most samples showed signs of damage within the first day of the test or after 24 hours. The cause of this deterioration was present since the ratio of algae to water in the test tube was too high (0.5 g of algae and 1.0 ml of water), and thus the oxygen present within the water was used up rapidly, resulting in the early onset of algae damage and loss. The survivability test was repeated with less algae present in each test tube to gain more accurate results.
Some observations were extracted after the survivability test. Within 24 hours, most of the samples were already showing signs of damage. The expected damage could be observed in the algae slowly turning color from a healthy deep green to a light green and finally to a sickly brown (as seen in some samples after 38 hours in Figure 1). This change in color is to be expected in the algae that is suffering from a lack of light. However, we observed the algae turned from dark green to blue, and the watercolor changed from clear to a cloudy blue.
The blue discoloration is not from the algae, but from cyanobacteria present within the water with the spirulina algae. We know that cyanobacteria thrive within low oxygen environments and when in a low oxygen environment, the cyanobacteria multiply, turning the water within the test tube blue. This is not an ideal situation as cyanobacteria produce toxins which are harmful to algae and other forms of life, including humans. This blue discoloration is a sign that damage is being done to the algae and that consumption of the algae affected by cyanobacteria may be harmful to humans. Cyanobacteria toxins can cause skin irritation, gastrointestinal distress, allergic reactions, and life-threatening liver damage in humans. The emergence of a blue discoloration in the water of a sample will immediately count a sample as dead due to the sample no longer being fit for human consumption.
To counteract this discoloration, a lower ratio of algae to medium was necessary. After lowering the ratio of algae to water, some samples did not show signs of cyanobacteria until 65 hours within the survivability test.
This survivability test unknowingly showed us the results of a lack of oxygen and cyanobacteria toxins upon spirulina. However, this was not what the survivability test was intended to study. The results of this survivability test ask for another survivability test to evaluate the effects of a lack of light as opposed to a lack of oxygen. The main change in this survivability test was to have reduced mass of algae present within the tubes. To maximize the science outcome, the team decided to have only 0.1 grams of wet mass spirulina to be present in the next survivability test so that the ratio would be $0.1\mathrm{g}$ of algae to $1.0\mathrm{ml}$ of water. Ideally this change would show that spirulina could survive up to five days with no light while avoiding the dangers of cyanobacteria.
### b) Payload Integration at Payload Processing Facility
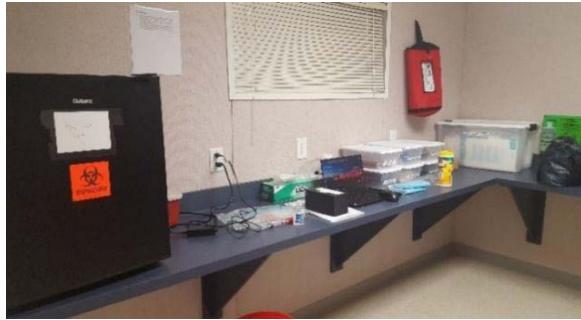
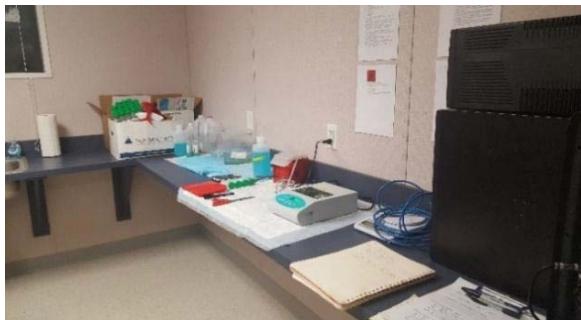
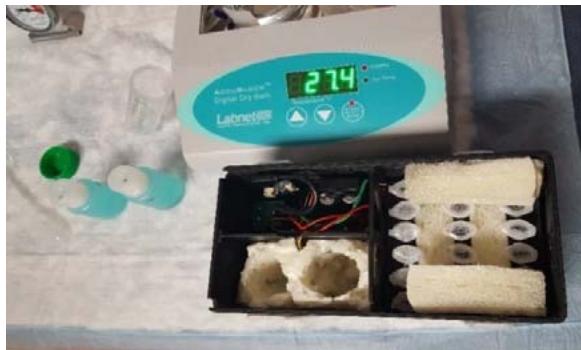
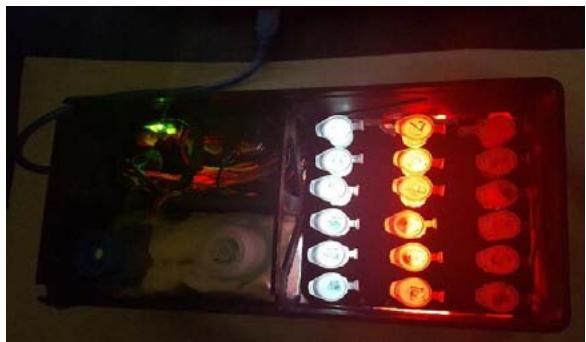
The team integrated the payload in the Payload Processing Facility (PPF) at the West Texas Launch Site (Figure 2a, Figure 2b). Spirulina samples were kept under the sample thermal conditions prior to flight (Figure 2c, Figure 2d) for about 12 hours. Both flight and control NanoLabs are shown in Figure 2e and Figure 2f, respectively.
 a.
 b.
 C.
 d.
 e.
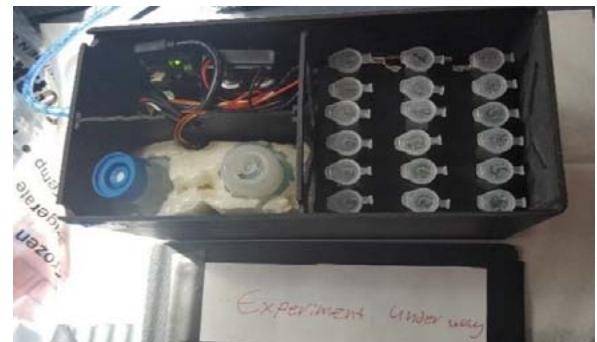 f. Figure 2: Preparation of samples at the PPF. a. Integration of Payload at Payload Processing Facility (PPF). b. Samples kept in the electric heater at PPF. c. Placing tubes with Spirulina in the NanoLab. d. Two sets of 18 tubes with Spirulina or flight and control. e. NanoLab housing the Spirulina flight samples. f. NanoLab housing the Spirulina control samples.
### c) Spirulina Postflight Analysis
After the suborbital flight, some samples were transported to the University of Texas Health Science Center at San Antonio (UTHSCSA) facilities for further processing for RNA analysis. The rest of the samples were transported (the same day of the launch) back to ERAU. Figure 3 shows the growth evolution of a flight sample cultivated for 20 days.
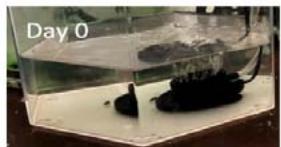
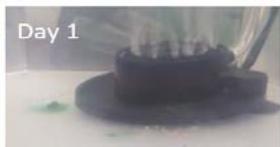
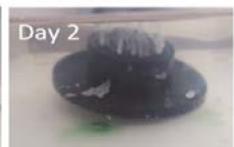
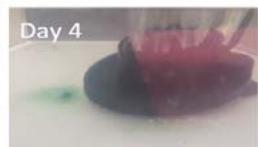
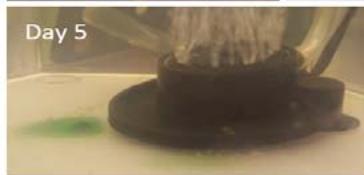
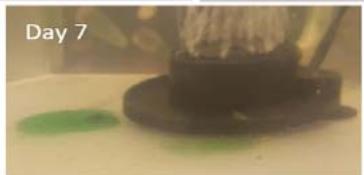
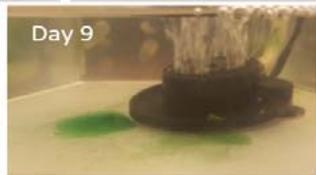
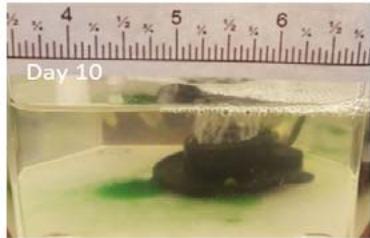
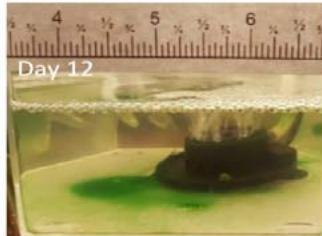
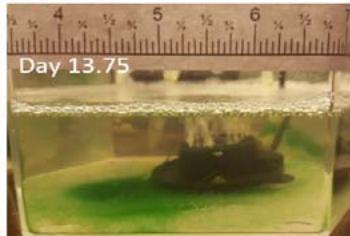
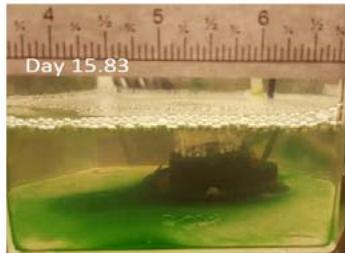
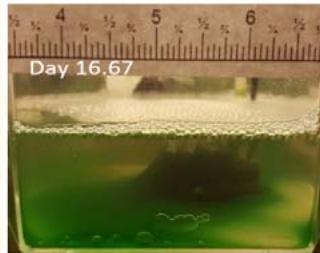
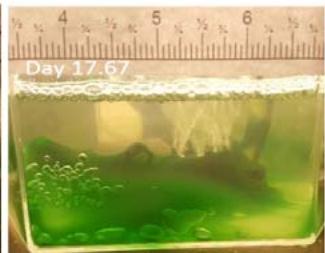
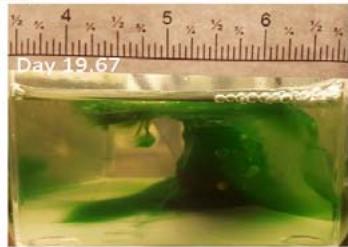 Figure 3: Spirulina growth chamber postflight study showing a flight sample that was cultivated for 20 days.
## III. RNA EXTRACTION, CDNA SYNTHESIS AND QRT-PCR
RNAs from spirulina were isolated using Qiagen RNA mini kit (Bio-Rad) according to the manufacturer's standard protocol. RNA concentrations were measured using Nanovue Plus spectrophotometer (GE Healthcare Life Sciences, Pittsburgh, PA). cDNAs were synthesized using iScriptTM cDNA Synthesis Kit (Bio-Rad) with $0.1\mu \mathrm{g}$ total RNA template loaded for each reaction in all samples. qRT-PCRs were done with SsoAdvancedTM universal SYBR® green supermix (Bio-Rad) following the manufacturer's recommended protocol in a CFX ConnectTM real-time PCR detection system (Bio-Rad).
cDNA templates for each sample and reaction were set at $20\mu l$. Spirulina primers were designed using the Primer 3 Plus Software and listed in Table 1. qRT-PCRs were done with the following parameters: initial denaturation $(95^{\circ}\mathrm{C}, 2\mathrm{min})$; 40 cycles of denaturation $(95^{\circ}\mathrm{C}, 15\mathrm{s})$, annealing $(55^{\circ}\mathrm{C}, 30\mathrm{s})$, and plate reading; melt curve analysis from $65^{\circ}\mathrm{C} - 95^{\circ}\mathrm{C}$ at $0.5^{\circ}\mathrm{C}$ increment for 5 sec. qRT-PCR data were analyzed using the comparative (2- $\Delta$ Ct) method and values were normalized to housekeeping gene 16S expression. All samples were run at least in duplicate with at least two independent experiments.
Table 1: Gene Specification from Uniport/Org.
<table><tr><td>Gene Name</td><td>Forward Primer (5'->3')</td><td>Reverse Primer (5'->3')</td><td>Relevance (molecular function; biological process)</td></tr><tr><td>ClpB</td><td>ACGCTGTTAGACAACGCTGA</td><td>TACCTTCCGAGTCCGTCACT</td><td>ATP binding; protein refolding, response to heat</td></tr><tr><td>RcbX</td><td>TGCTAAGGACACGACCAAGG</td><td>GTTGCGTCATTCGTTCCAGG</td><td>Protein folding chaperone; carbon fixation, photosynthesis,</td></tr><tr><td>MgtE</td><td>ACAGGCGGACGGAGATAACT</td><td>ACATCAACGGCGGTGGTAAT</td><td>Putative ion magnesium transmembrane transporter; metal ion binding</td></tr><tr><td>MpsA</td><td>GATCCGACCTAGCCACTTCC</td><td>CCAATACGATCGCCTACAGC</td><td>ATP binding, metal ion binding, water dikinase activity; gluconeogenesis, Phosphoenolpyruvate synthase</td></tr><tr><td>NrtP</td><td>AGCCACAGCTATTCAAGACG</td><td>CAACCACCATTAACTCGACC</td><td>Nitrate transmembrane transporter, nitrite transmembrane transporter; nitrate assimilation, nitrate import, nitrite transport.</td></tr><tr><td>GroES</td><td>TTGTCGGTGTGGTGGAACAA</td><td>GACGGGCGATCGTAAATCCT</td><td>ATP binding; protein folding</td></tr><tr><td>DnaK</td><td>GGGGAACGAGCCATGGTTAA</td><td>GTTCTTCAGTCGCTGACCCA</td><td>ATP binding, unfolded protein binding; protein folding</td></tr><tr><td>Tsf</td><td>GCTTTGTTGCCTATCCCT</td><td>CACCACGCAGACACTCATA</td><td>Translation elongation factor activity; protein biosynthesis</td></tr><tr><td>GroEL</td><td>TAGCCTTTGACGAAGAATC</td><td>ACCATCTCCAGCCACATC</td><td>ATP binding; protein refolding</td></tr><tr><td>GroEL 1</td><td>ATAAGGCGACAGCTTTCTTGGTA G</td><td>ATTGATTGCTACTTGCCCACTC TT</td><td>ATP binding, unfolded protein binding; protein refolding</td></tr><tr><td>HspA</td><td>GGCAATCATTAGTTTTAATTGGGA A</td><td>AGCCAGATCGACCTTAACCAC</td><td>Small heat shock protein molecular chaperone; stress response</td></tr><tr><td>NrtD</td><td>CTGTAACCAACTCCACCTCC</td><td>CGTAGTATTCTGGCTGTTCC</td><td>ATPase-coupled transmembrane transporter activity, ATP</td></tr><tr><td></td><td></td><td></td><td>binding, Nitrate ABC transporter ATPase subunits C and D</td></tr><tr><td>FolE</td><td>TTCTGACCAACGGCTACAGT</td><td>GAAGACACCAATCATGGCAC</td><td>Putative GTP cyclohydrolase I binding, GTP cyclohydrolase I activity, zinc ion binding; once-carbon metabolic process, tetrahydrofolate biosynthetic process</td></tr><tr><td>16S</td><td>TAGCGGTGAAATGCGTAGAT</td><td>AAGTGCCCAACTGAATGATG</td><td>Gene housekeeping</td></tr></table>
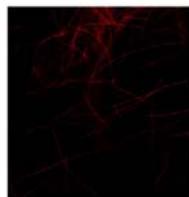
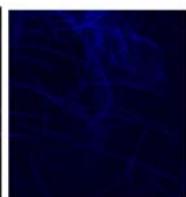
## IV. CONFOCAL MICROSCOPY
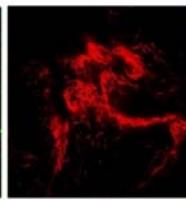
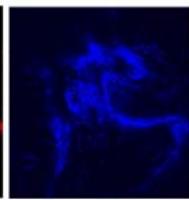
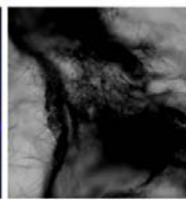
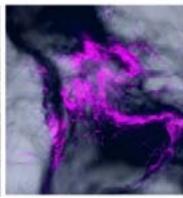
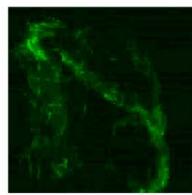
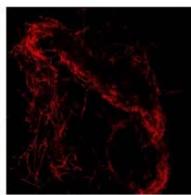
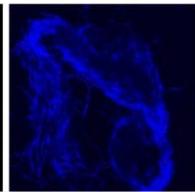
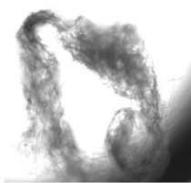
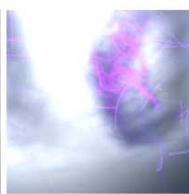
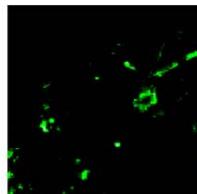
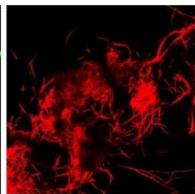
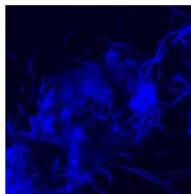
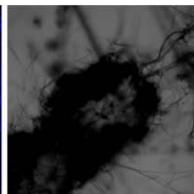
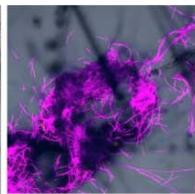
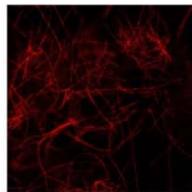
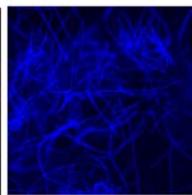
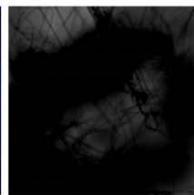
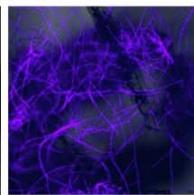
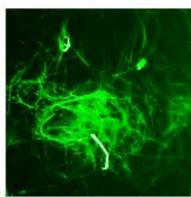
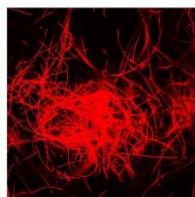
To better visualize the structure of flow and ground control spirulina samples, we placed them in petri dishes and exposed them to confocal microscopy using Olympus FV3000 Confocal Laser Scanning Microscope. We imaged spirulina samples at different excitation wavelengths ranging from 488 (green/Fluo-3), 561 (red/tdTomato), and 650 (blue/FuraRed) using 2X and 10X resolution.
## V. RESULTS
### a) Suborbital Flight Characteristics
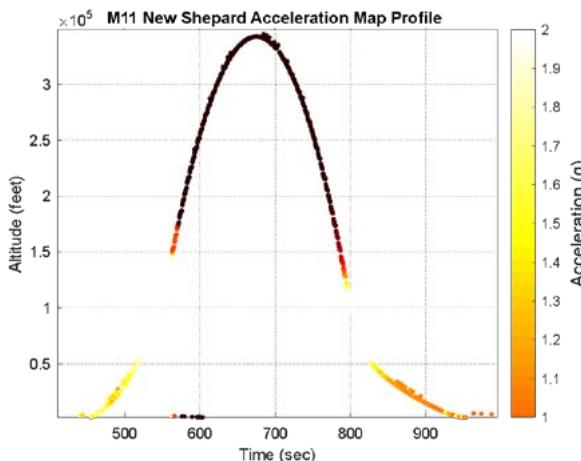
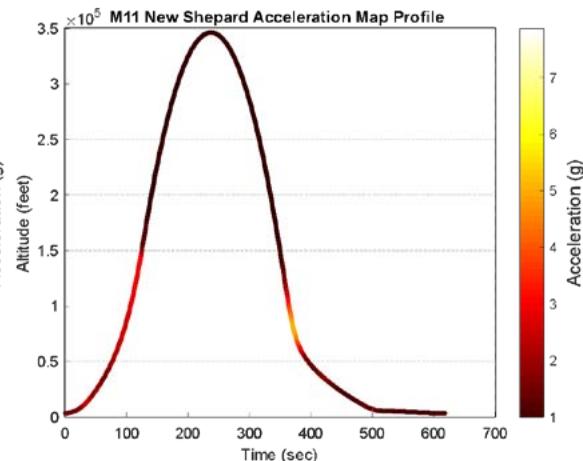
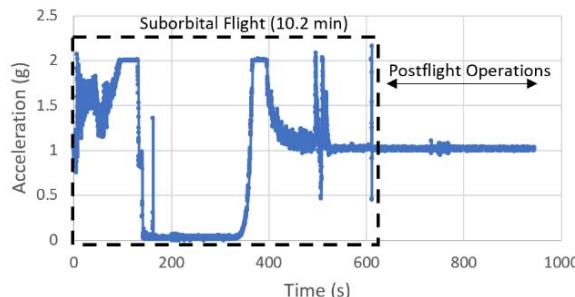
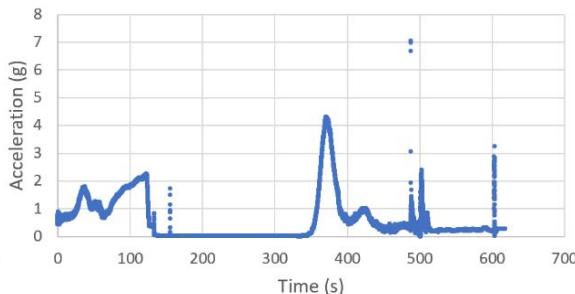
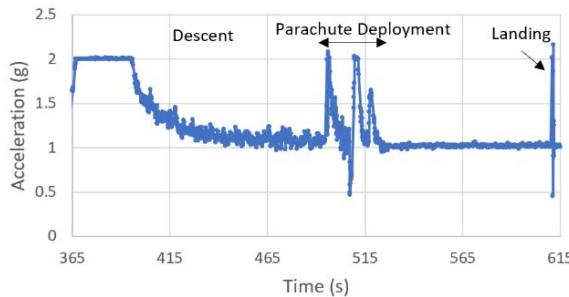
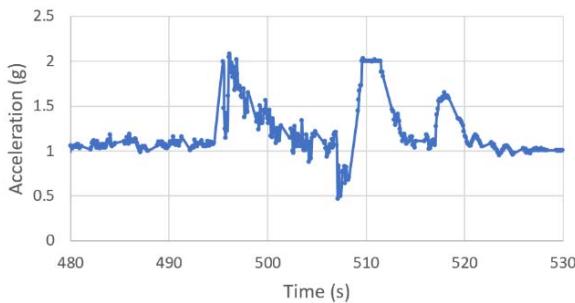
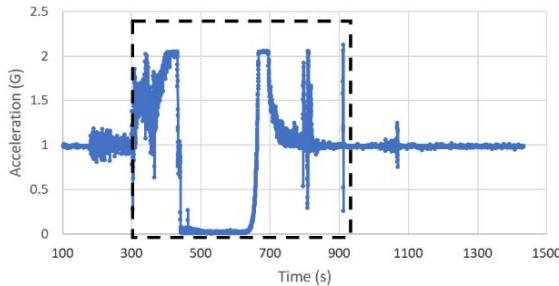
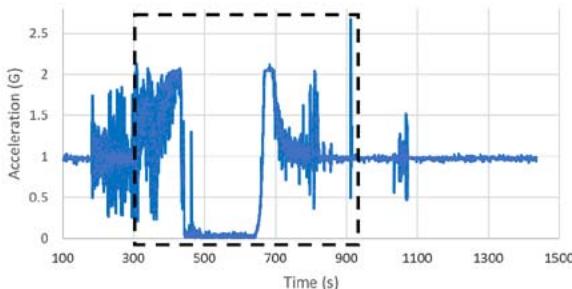
The suborbital flight characteristics are displayed in Figure 4. The maximum altitude during the suborbital flight was $105.68\mathrm{km}$. Figure 4a shows the acceleration map generated with the data from our NanoLab (maximum acceleration is $2.16\mathrm{g}$ ) and Figure 4b displays the acceleration map obtained with the data from a NanoRacks sensor (maximum acceleration sensed is $7.06\mathrm{g}$ during parachute deployment and $4.30\mathrm{g}$ during reentry). Although our sensor maximum acceleration seems lower than the value for one of the NanoRacks sensors, it is consistent with other NanoRacks sensors measurements (Figure 4c, 4d). This lower measured acceleration may have been caused by a power interruption which affected the data collection. Figure 4c and Figure 4d are the acceleration profiles in function of time for both the NanoLab sensor and one of the NanoRacks sensors, both showing the difference of phase events during the suborbital flight. Figure 4e depicts the descent, parachute deployment and landing phases of the flight, and Figure 4f depicts a zoom section of the parachute phase. Previous research (Llanos et al., 2019) showed the acceleration profile for another suborbital experiment which was used to leverage the efforts of this research.
Figure 4g and Figure 4h display the acceleration profiles for other two NanoRacks sensors with maximum accelerations of 2.13 g and 2.68 g, respectively. Another two NanoRacks sensors measured maximum accelerations of 2.48g and 2.49g. Note that the acceleration measured by our NanoLab sensor falls in between the acceleration measured by all four NanoRacks sensors. As we can observe, different sensors provided slightly different acceleration profiles since the sensors were placed in various locations within the Nano Feather Frame (NFF) where all the NanoLabs are integrated.
 a.
 b.
 Acceleration Profile M11 (NanoLab) C.
 Acceleration Profile M11 Sborbital Flight d.
 Descent Acceleration Profile M11 (NanoLab) e.
 Parachute Acceleration Profile M11 (NanoLab) f.
 NFF Acceleration A1 (G) g.
 NFF Acceleration A3 (G) h. Figure 4: Acceleration profiles during various mission phases. a. Acceleration map profile measured with NanoLab sensor. b. Acceleration map profile measured with NanoRacks sensor. c. Acceleration measured by NanoLab during preflight, suborbital flight and postflight mission phases. d. Acceleration during descent. e. Acceleration during parachute deployment. f. Acceleration during landing. g. Acceleration measured inside the Nano Feather Frame by NanoRacks. h. Acceleration measured by another sensor inside the Nano Feather Frame by NanoRacks.
Our Nanolab sensor measured a microgravity time of about 3.4 minutes with microgravity quality between $10^{-4}\mathrm{g}$ and $10^{-1}\mathrm{g}$. It was measured that $3.6\%$ of the time the NanoLab measured between microgravity levels between $10^{-4}\mathrm{g}$ and $10^{-2}\mathrm{g}$, $16.5\%$ of the time between $10^{-2}\mathrm{g}$ and $2\cdot 10^{-2}\mathrm{g}$, $44.5\%$ of the time between $2\cdot 10^{-2}\mathrm{g}$ and $3\cdot 10^{-2}\mathrm{g}$, $16.8\%$ of the time between $3\cdot 10^{-2}\mathrm{g}$ and $4\cdot 10^{-2}\mathrm{g}$, $12.5\%$ of the time between $4\cdot 10^{-2}\mathrm{g}$ and $5\cdot 10^{-2}\mathrm{g}$ and $6.1\%$ of the time between $5\cdot 10^{-2}\mathrm{g}$ and $10^{-1}\mathrm{g}$. The NanoRacks sensor measured microgravity time of about 3.5 minutes with about $4.1\%$ of time between $10^{-4}\mathrm{g}$ and $10^{-2}\mathrm{g}$, $79.7\%$ of the time between $10^{-2}\mathrm{g}$ and $2\cdot 10^{-2}\mathrm{g}$, $12.6\%$ of the time between $2\cdot 10^{-2}\mathrm{g}$ and $3\cdot 10^{-2}\mathrm{g}$, $2.0\%$ of the time between $3\cdot 10^{-2}\mathrm{g}$ and $4\cdot 10^{-2}\mathrm{g}$, and $0.3\%$ of the time between $4\cdot 10^{-2}\mathrm{g}$ and $5\cdot 10^{-2}\mathrm{g}$, and $1.3\%$ of the time between $5\cdot 10^{-2}\mathrm{g}$ and $10^{-1}\mathrm{g}$.
### b) Spirulina Mass Growth Evolution
Using equations for the growth model by Wang, Fu, and Liu (2007), we present an approximate estimated growth model nine hours before launch and until payload recovery a few hours after landing. The average light intensity for both red and white LEDs were 1100 lux and 875 lux, respectively, approximately the same as for the light intensities measured during ground control (Figure 5a).
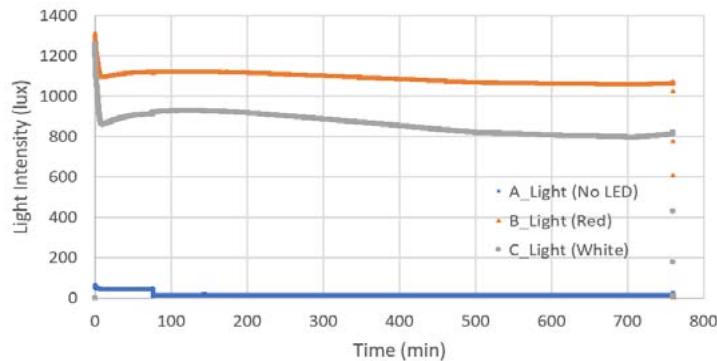 Light Intensity Ground Control a.
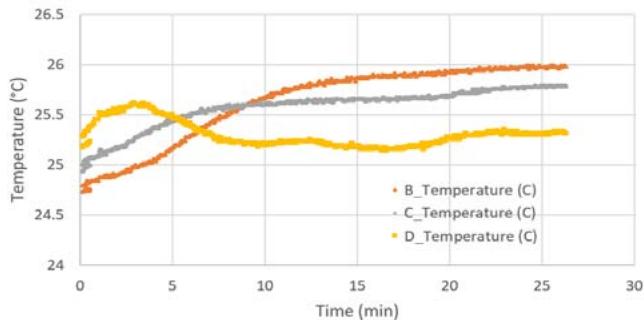
 Temperature Suborbital Flight b.
 Temperature Ground Control at PPF
 Estimated Growth Model Red LEDs d.
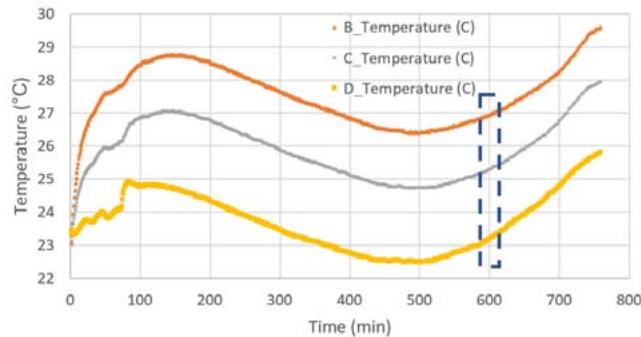
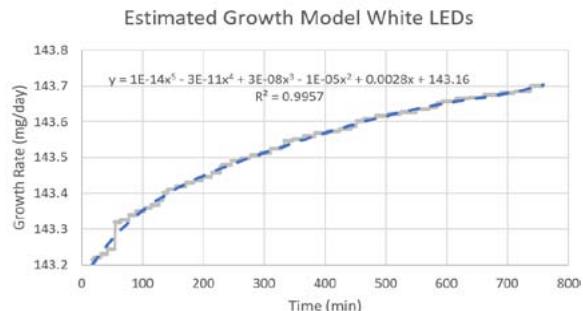 C. e. Figure 5: a. Light intensity (a) and temperature variations for both NanoLabs. b. Temperature profile during suborbital flight including preflight and postflight operations. c. Temperature profile test at PPF. d. Growth rate for red LEDs. e. Growth rate for white LEDs.
Figure 5b shows the temperature profile for the flight samples during preflight operations, flight (see blue dashed box) and post flight operations. Note that the different temperature profiles correspond to the temperature measured in each compartment for different light conditions (B_Temperature for white LED, C_Temperature for red LED, D_Temperature for no LED light). During this period, the growth rate of the algae for the red LEDs ranged from about 214.4 mg/day to about 214.7 mg/day with about 0.3 mg in about 12 hours (see
Figure 5d), and for the white LEDs, the samples growth was between $143.2\mathrm{mg/day}$ and $143.7\mathrm{mg/day}$ with about $0.5\mathrm{mg}$ in about 12 hours (see Figure 5e). Similarly, the algae exposed to the white LEDs grew about $0.5\mathrm{mg}$ in 12 hours. The algae kept in the NanoLab at the PPF was exposed to the thermal profile (see Figure 5c).
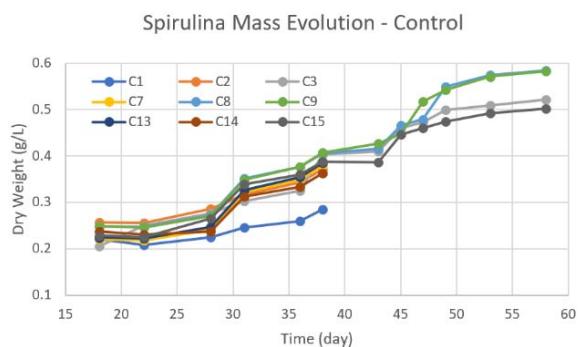
From the samples (control and flight) brought back to ERAU we took nine control samples and nine flight samples that were kept in individual $50~\mathrm{ml}$ tubes with $5\mathrm{ml}$ sea water and about $0.15\mathrm{g}$ of algae. All these samples were kept for seven weeks to analyze their growth evolution. Samples were replenished with media and proper nutrients from their respective mother colony. Three samples were taken for each light intensity condition (C1, C2, C3: no light), (C7, C8, C9: red) and (C13, C14, C15: white). Similarly, for flight samples we had (F4, F5, F6: no light), (F10, F11, F12: red) and (F16, F17, F18: white).
 a.
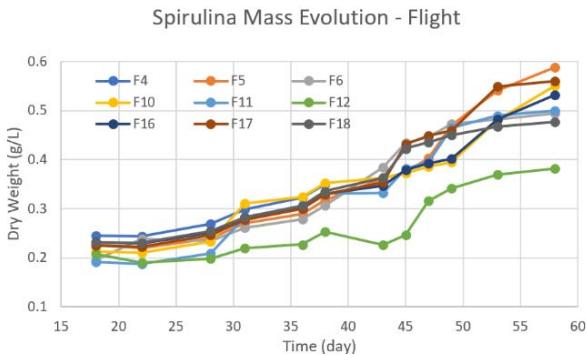 b. Figure 6: Time behavior of spirulina growth post flight for both control and flight samples under the same lab conditions. a. control samples. b. flight samples.
The estimated spirulina dry weight for all the samples (control and flight) are provided in Figure 6. Under the conditions examined, the ones that yielded more biomass production across all control samples were $0.584\mathrm{g / L}$ and $0.583\mathrm{g / L}$ corresponding to the controls C8 and C9, respectively, both under red light. The next conditions which yielded more biomass production were the control samples C3 (under no light) and C15 (under white light) with $0.521\mathrm{g / L}$ and $0.502\mathrm{g / L}$, respectively. Summing all the biomass production for all control samples, we obtained an average of $1.546\mathrm{g / L}$ (red light), $1.250\mathrm{g / L}$ (white light), and $1.176\mathrm{g / L}$ (no light) during the seven weeks span. The rest of the control samples generated dry weights of about $0.28\mathrm{g / L}$ to $0.38\mathrm{g / L}$. As for the flight samples, they all survived yielding similar dry weights at the end of the seven weeks. The total dry weight for samples under red light, white light, and no light were $1.432\mathrm{g / L}$, $1.570\mathrm{g / L}$ and $1.432\mathrm{g / L}$, respectively. The total dry weight from for the tank with control samples and flight samples were $3.971\mathrm{g / L}$ and $4.435\mathrm{g / L}$, respectively.
An important observation from Figure 6 is that the growth pattern slowed down at around 20-25 days after the start of the growth (17 days after suborbital flight) showing a dip of lowest growth that lasted for a few days. This low dip in growth mass has previously been seen with the dry weight or biomass concentration found by previous research groups (Delrue et al., 2017 and Kumari et al., 2015), yet these groups do not show further insight into the growth of the spirulina after 20 or 27 days.
Phosphate is the major nutrient for the growth of microalgae to produce nucleic acids and phospholipids (Kumari et al., 2015), and the uptake of this micronutrient is greater when exposed to red LED light than to white LED light even using several mediums for about 20 days.
### c) Spirulina Ph, Ammonia (NH3/NH4+), Nitrate (NO2-), Nitrite (NO3-) Assessment
We next assessed the pH, ammonia (NH3/NH4+), nitrate (NO2-), nitrite (NO3-) in flown spirulina samples as well as in ground controls (Table 2).
Our results show that the highest pH of 8.6 was observed in control samples exposed to red light, whereas the pH for flown samples under the red light was 7.8. In general, most control samples show pH values between acceptable and ideal values while the flight samples show pH values between acceptable to low values. This behavior was expected since control samples remained at almost constant temperatures of $25 - 26^{\circ}C$ (Figure 5c) inside the PPF, and they were not exposed to any vibrations or high-g accelerations during the suborbital flight like the flight samples. The flight samples were exposed to more temperature fluctuations as seen in Figure 5b from the time of delivery of the payload to the NanoRacks team to integration of the payload inside the NFF inside the New Shepard capsule. Most control samples showed signs of some level of stress for ammonia and ammonium while all the flight samples showed higher levels of stress. In terms of nitrite contents, both control and flight samples did not show any stress levels, and as for the nitrate contents, most control and flight samples showed ideal to good conditions.
Table 2: Spirulina Ph, Ammonia (NH3/NH4+), Nitrate (NO2-), Nitrite (NO3-) Test.
<table><tr><td>Sample</td><td>pH</td><td>NH3/NH4+(ammonia/ammonium)</td><td>NO2-(Nitrite)</td><td>NO3-(Nitrate)</td></tr><tr><td colspan="5">Control Samples</td></tr><tr><td>C1 (no light)</td><td>7.8 (acceptable)</td><td>3.0 (danger-)</td><td>0</td><td>40 (ok-)</td></tr><tr><td>C2</td><td>7.4 (low)</td><td>1.0 (stress)</td><td>0</td><td>20 (ok+)</td></tr><tr><td>C3</td><td>7.8 (acceptable)</td><td>2.0 (stress+)</td><td>0</td><td>20 (ok+)</td></tr><tr><td>C7 (red light)</td><td>7.8 (acceptable)</td><td>1.0 (stress)</td><td>0</td><td>0 (ideal)</td></tr><tr><td>C8</td><td>8.4 (ideal)</td><td>1.0 (stress)</td><td>0</td><td>0 (ideal)</td></tr><tr><td>C9</td><td>8.6 (ideal)</td><td>0 (ideal)</td><td>0.5 (caution)</td><td>20 (ok+)</td></tr><tr><td>C13 (white light)</td><td>7.8 (acceptable)</td><td>0.5 (ideal)</td><td>0</td><td>20 (ok+)</td></tr><tr><td>C14</td><td>7.4 (low)</td><td>6.0 (danger+)</td><td>0</td><td>0 (ideal)</td></tr><tr><td>C15</td><td>7.8 (acceptable)</td><td>3.0 (danger-)</td><td>0</td><td>0 (ideal)</td></tr><tr><td colspan="5">Flight Samples</td></tr><tr><td>F4 (no light)</td><td>7.8 (acceptable)</td><td>3.0 (danger-)</td><td>0</td><td>20 (ok+)</td></tr><tr><td>F5</td><td>7.4 (low)</td><td>3.0 (danger-)</td><td>0</td><td>20 (ok+)</td></tr><tr><td>F6</td><td>7.4 (low)</td><td>3.0 (danger-)</td><td>0</td><td>0 (ideal)</td></tr><tr><td>F10 (red light)</td><td>7.0 (too low)</td><td>3.0 (danger-)</td><td>0</td><td>0 (ideal)</td></tr><tr><td>F11</td><td>7.8 (acceptable)</td><td>3.0 (danger-)</td><td>0</td><td>20 (ok+)</td></tr><tr><td>F12</td><td>7.4 (low)</td><td>3.0 (danger-)</td><td>0</td><td>20 (ok+)</td></tr><tr><td>F16 (white light)</td><td>7.8 (acceptable)</td><td>3.0 (danger-)</td><td>0</td><td>20 (ok+)</td></tr><tr><td>F17</td><td>7.4 (low)</td><td>6.0 (danger+)</td><td>0</td><td>0 (ideal)</td></tr><tr><td>F18</td><td>7.6 (acceptable-)</td><td>3.0 (danger-)</td><td>0</td><td>20 (ok+)</td></tr></table>
### d) Gene Expression Analysis
In our study, we selected genes that have been previously studied by Panyakampol et al. (2015). This selection was generated based on the thermal effects on some of these genes regarding the cellular processes, inorganic ion transporters and carbon and nitrogen metabolism mechanisms.
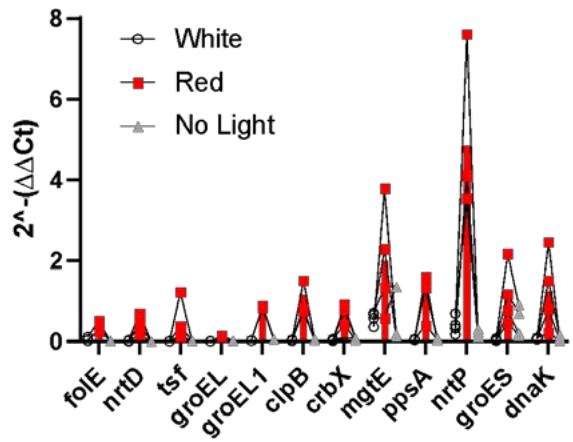
Our data indicate that spirulina samples exposed to suborbital flight had downregulated expression of all genes as compared to ground controls regardless of the light exposure type (Figure 7a, b, c).
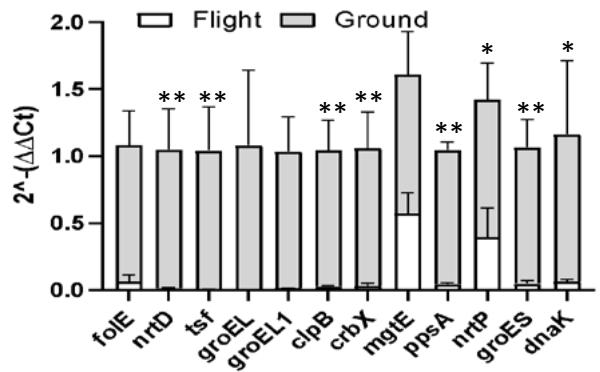 Gene Expression under White Light
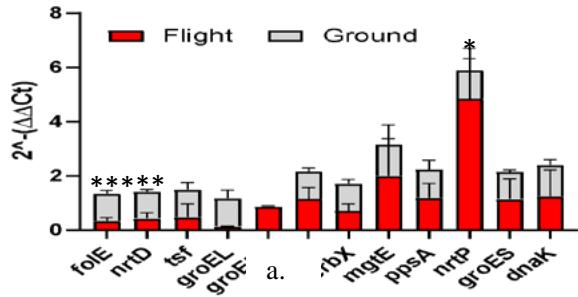 Gene Expression under Red Light
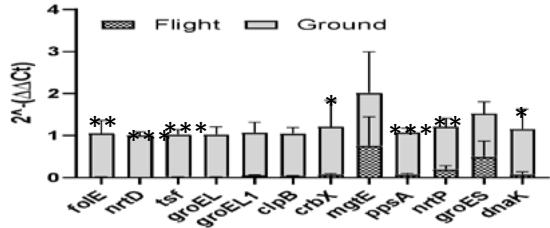 Gene Expression under no Light Figure 7: Gene change expression (2 ^ - (ΔΔCt) among different flight and ground conditions (a, b, c). Values indicate mean ± SD. * p ≤ 0.05; \*\* p ≤ 0.01; \*\*\* p ≤ 0.0001.
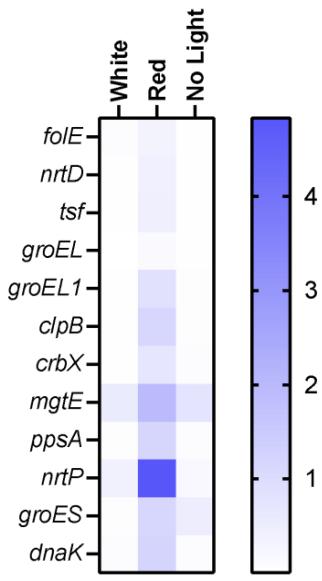
However, certain genes were elevated more than others. We saw that exposure to light led to the highest expression of mgtE, nrtP, and dnaK genes across all conditions. The most profound effect of white light had on the ppsA gene (p < 0.001) (Figure 7), while exposure to red and no light conditions elevated the expression of folE (Figure 7b) and nrtD, tsf, ppsA genes (Figure 7c). In addition to comparing flight and ground control samples, we also sought to investigate which light condition had the most profound effect on flow spirulina samples (Figure 8).
 a.
 Gene Expression under different Flight Conditions b. Figure 8: Heat map of genes altered by different light conditions in flown spirulina samples (a). Gene change expression $(2^{\wedge} - (\Delta \Delta C t)$ among different flight conditions. Values indicate mean $\pm$ SD (b).
Based on the heat map generated from the quantitative RT-PCR analysis (Figure 8a), red light led to the highest expression of all genes, with the highest expression of the nrtP and mgtE genes. White light led to the highest expression of the mgtE and nrtP genes as well, while no light condition elevated mgtE and groES genes. Similar patterns were observed in the bar graph where each dot represents an individual experiment (Figure 8b). This graph shows individual samples distribution across different conditions and indicates reasonable variability among different conditions.
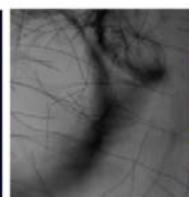
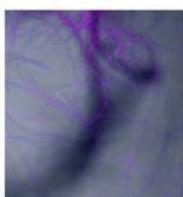
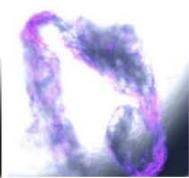
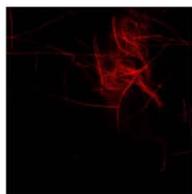
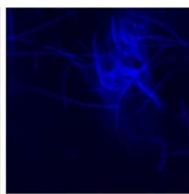
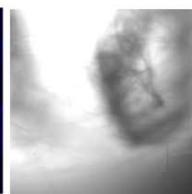
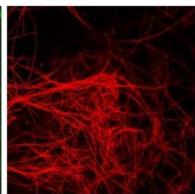
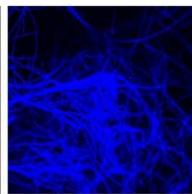
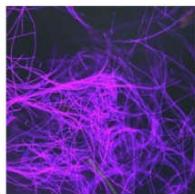
## VI. CONFOCAL MICROSCOPY
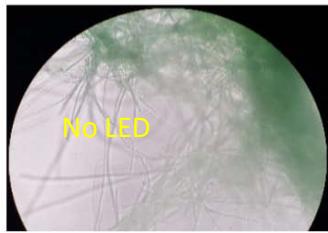
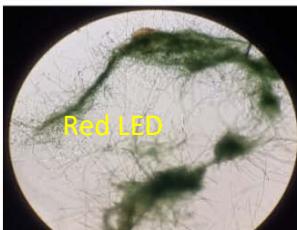
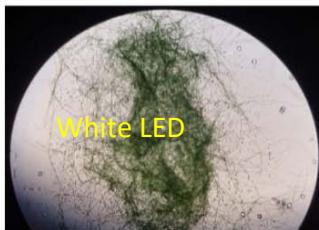
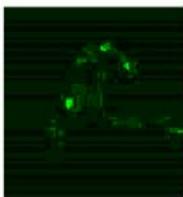
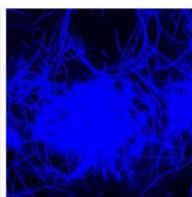
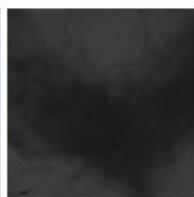
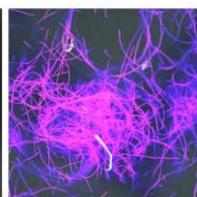
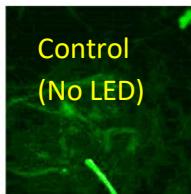
We next assessed the structure of ground and flown spirulina samples using inverted and confocal microscopy (Figure 9b-Figure 9f) where the top row represents a 1X resolution while the bottom row represents a 2X resolution or 10X resolution for Figure 9g. Figure 9a depicts the pictures of the selected samples under the Motic AEZI Inverted Phase Microscope.
 Flight
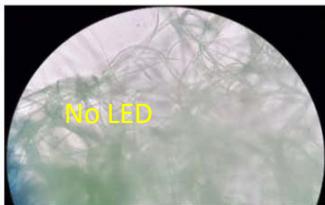 Control
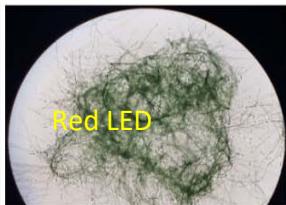
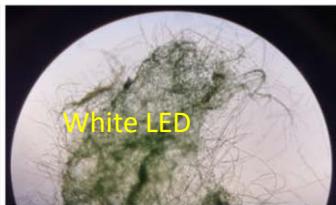 a.
 Flight (No LED)
 b.
 Flight (Red LED)
 C.
 Flight (White LED)
 d.

 e.
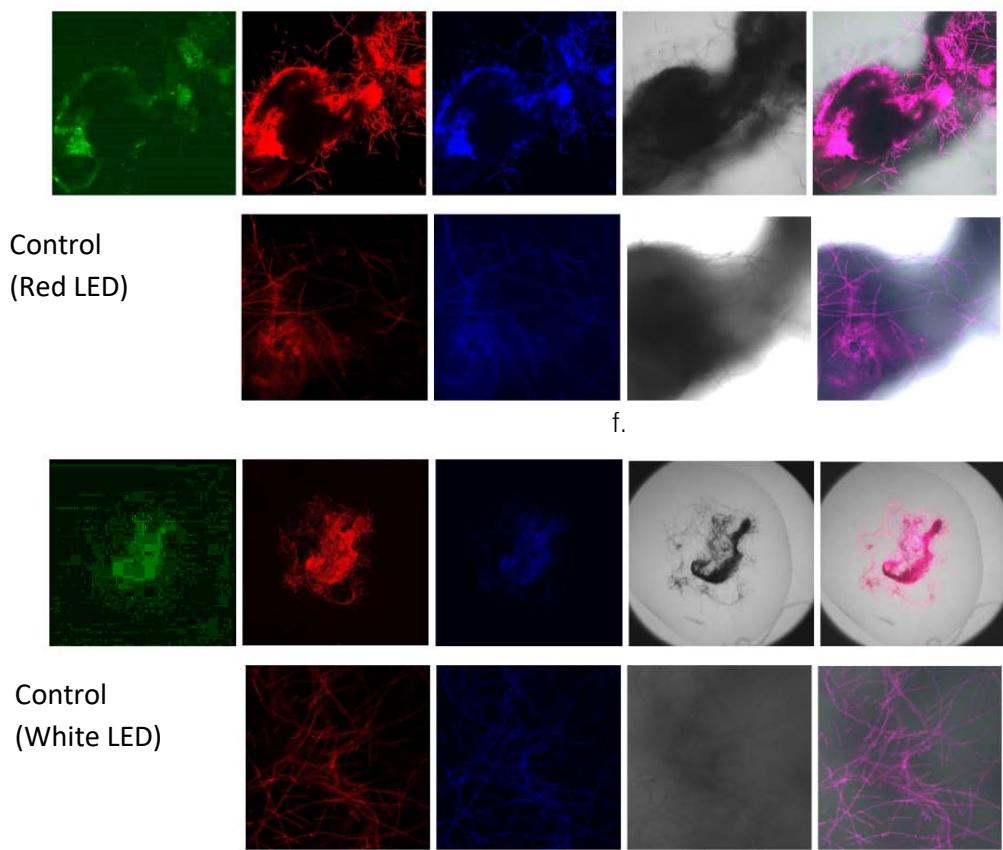 g. Figure 9: Confocal microscopy for control and flight samples. a. Flight samples (top) and control samples (bottom) as seen under the microscope. b. Flight-6 (no LED). b. Flight-10 (red LED). c. Flight-18 (White LED).d. Control-2 (No LED). e. Control-8 (red LED). f. Control-15 (white LED).
Based on images taken under inverted microscope (Figure 9a), control samples had a more defined structure when compared to flown samples. In flown samples (Figure 9b, c, d), no light and white light led to the highest laser intensity and better-defined structures when compared to the red light. For control samples (Figure 9e, f, g), no light led to a more defined spirulina structure when compared with samples exposed to white and red light.
## VII. CONCLUSIONS
Given the significant interest in future human space flights, finding an alternative food source is an important subject of current and future space research. In this study, we sought to determine whether exposing spirulina (Arthrospira platensis) to a different light condition during a suborbital flight could influence the expression of genes involved in many important cellular processes, such as ATP regulation, photosynthesis, nitrate transport, etc.
Spirulina flight samples yielded more mass than the control samples as an overall. In particular, the flight samples exposed to red light yielded about $7\%$ less mass than the controlled samples exposed to the same light conditions at the PPF; but both the flight samples exposed to white light and no light yielded about $25\%$ and $21\%$ more mass than their controlled samples at the PPF. The low biomass for red LED light may be associated with the uptake rate of micronutrients, including phosphorus, which takes place at a higher rate for red light than for white light.
Our results suggest that red light led to the most profound weight mass reduction in flown samples when compared to other light conditions. Thus, it downregulated the expression of many genes suggesting that exposure to red light might not be beneficial.
### ACKNOWLEDGMENTS
This research was supported by the ERAU's Applied Aviation Sciences Department at ERAU, the Ignite Undergraduate Research Office, and the University of Texas Health Science Center at San Antonio. The authors would like to thank the CSO 390 Payloads and Integration class and especially Dylan Orbit and Michael McKean for helping with the cultivation and transportation of the spirulina samples from the ERAU facilities to Van Horn, West Texas Launch Site.
#### Declaration of Conflicting Interests
The authors declared no potential conflicts of interest with respect to the research, authorship, and/or publication of this article.
Generating HTML Viewer...
References
14 Cites in Article
Chih-Yu Wang,Chun-Chong Fu,Yung-Chuan Liu (2007). Effects of using light-emitting diodes on the cultivation of Spirulina platensis.
Denise Da,Fontoura Prates,Elisângela Martha Radmann,Jessica Duarte,Michele Greque De Morais,Jorge,Alberto Vieira,Costa (2018). Spirulina cultivated under different light emitting diodes: Enhanced cell growth and phycocyanin production.
Florian Delrue,Emilie Alaux,Lagia Moudjaoui,Clément Gaignard,Gatien Fleury,Amaury Perilhou,Pierre Richaud,Martin Petitjean,Jean-François Sassi (2017). Optimization of Arthrospira platensis (Spirulina) Growth: From Laboratory Scale to Pilot Scale.
J Fahrion,F Mastroleo,C Dussap,N Leys (2021). Use of Photobioreactors in Regenerative Life Support Systems for Human Space Exploration.
Ryan Keller,William Porter,Karthik Goli,Reece Rosenthal,Nicole Butler,Jeffrey Jones (2021). Biologically-Based and Physiochemical Life Support and In Situ Resource Utilization for Exploration of the Solar System—Reviewing the Current State and Defining Future Development Needs.
M Kumar,J Kulshreshtha,G Singh (2011). Growth and biopigment accumulation of cyanobacterium Spirulina platensis at different light intensities and temperature.
Ankita Kumari,Akhilendra Pathak,Chandan Guria (2015). Effect of light emitting diodes on the cultivation of <i><scp>S</scp>pirulina platensis</i> using <scp>NPK</scp>‐10:26:26 complex fertilizer.
Pedro Llanos,Kristina Andrijauskaite,Vijay Duraisamy,Francisco Pastrana,Erik Seedhouse,Sathya Gangadharan,Leonid Bunegin,Mariel Rico (2019). Challenges of ERAU’s First Suborbital Flight Aboard Blue Origin’s New Shepard M7 for the Cell Research Experiment In Microgravity (CRExIM).
Iracema Moraes,Regina Arruda,Natália Maresca,Aline Antunes,Rodrigo Moraes (2013). Spirulina platensis: process optimization to obtain biomass.
Chitrangada Mukhopadhyay (2015). Engineering Spirulina for Enhanced Medicinal Application.
J Pandey,A Tiwari,S Singh,D Tiwari (2011). Potential of Different Light Intensities on the Productivity of Spirulina maxima.
Jaruta Panyakampol,Supapon Cheevadhanarak,Sawannee Sutheeworapong,Jeerayut Chaijaruwanich,Jittisak Senachak,Wipawan Siangdung,Wattana Jeamton,Morakot Tanticharoen,Kalyanee Paithoonrangsarid (2015). Physiological and Transcriptional Responses to High Temperature in Arthrospira ( Spirulina ) platensis C1.
L Poulet,J-P Fontaine,C-G Dussap (2016). Plant’s response to space environment: a comprehensive review including mechanistic modelling for future space gardeners.
S Yim,D Ki,H Doo,H Kim,T Kwon (2016). Internally Illuminated Photobioreactor Using a Novel Type of Light-emitting Diode (LED) Bar for Cultivation of Arthrospira platensis.
No ethics committee approval was required for this article type.
Data Availability
Not applicable for this article.
How to Cite This Article
Pedro J. Llanos. 2026. \u201cAssessment of Scientific Payload Carrying Spirulina Onboard Blue Origin’s New Shepard Vehicle\u201d. Global Journal of Research in Engineering - B: Automotive Engineering GJRE-B Volume 22 (GJRE Volume 22 Issue B1).
Explore published articles in an immersive Augmented Reality environment. Our platform converts research papers into interactive 3D books, allowing readers to view and interact with content using AR and VR compatible devices.
Your published article is automatically converted into a realistic 3D book. Flip through pages and read research papers in a more engaging and interactive format.
Subject: Global Journal of Research in Engineering - B: Automotive Engineering
Authors:
Pedro J. Llanos, Morgan Shilling, Kristina Andrijauskaite, Kody Kidder, Vijay V. Duraisamy, Dr. Pedro Llanos, Dr. Pedro Llanos (PhD/Dr. count: 2)
Our website is actively being updated, and changes may occur frequently. Please clear your browser cache if needed. For feedback or error reporting, please email [email protected]
Thank you for connecting with us. We will respond to you shortly.