The study investigated the water quality of the Nale-rigu dam and compared to the WHO recommended levels for both physicochemical and bacteriological parameters. There was also a survey of 99 out of 135 household heads who were within 50 meters around the dam to assess their usage of the dam water. The sampled dam water was analysed at the Water Research Institute laboratory in Tamale. The water pH was found to range from 6.30 to 6.50 with a mean temperature range of 30.3 to 30.50C. The turbidity of the water exceeded the WHO limits. Other physicochemical parameters monitored including total suspended solids, total dissolved solids, total hardness, total alkalinity values were within the WHO recommended levels for surface water quality. Results of the bacteriological analysis including faecal coliforms and total coliforms were high. It was concluded that the Nalerigu dam was contaminated and unsafe for human consumption if not treated. The study recommends a further study into metallic concentration of the dam to ensure the quality besides physicochemical and bacteriological parameters of the dam.
## I. INTRODUCTION
The quality of water for both domestic and economic activities is threatened as human populations grow and affects the existence of all living organisms [1]. The quality of any water source is thus a function of both natural influences and human activities [2]. Aquatic environments are complex and require judicious and careful use to ensure sustainability into the future [1].
Water quality is a challenge to many communities and societies which are depended on rain or surface water such as dam, springs and rivers. This threatens human health, limit food production, reduced ecosystem functions, and hinders economic growth [3]. Waterquality degradation directly affects environmental, social and economic problems [4]. Globally, fresh water availability is limited due to worsening anthropogenic activities and competition from animals leading to pollution and degradation [5]. Potable water availability, access and affordability is still a major challenge in many developing countries as nearly $10\%$ of the global population uses drinking water from unimproved and unsafe sources [6]. This is more conspicuous in rural areas and small towns in developing countries where nearly $38\%$ of the population are still without access to potable water [7].
The [8] has estimated that $80\%$ of the population has access to improved water sources but with a high risks of contamination due to improper maintenance and poor sanitation. In urban communities, accessibility of safe drinking water varies with their socioeconomic status. In some settlements in rural areas and peri-urban area, springs, rivers, lakes, and wells are the traditional sources of water for drinking and for personal hygiene.
Surface water quality testing is rarely undertaken indeveloping countries, as more attention is usually paid to water availability and quantity than quality of water [9, 10]. The quality of fresh water is usually affected by natural and anthropogenic activities and must be treated before use especially in the case of surfacewater which is infamously known to be polluted [11, 12].
The quality of surface water in rural communities affected by excreta from both human and domestic animals, run-off from agricultural fields and detergents from washing of clothing [13, 14]. Therefore, many parameters of water in terms of its chemical, physical, and biological constituents must be analysed before use. In developing countries water quality standards are based on the World Health Organisation's (WHO's) guidelines for drinking water. The Ghana Water Company Limited (GWCL) is the institution responsible for water supply in urban areas while the Community Water and Sanitation Agency (CWSA) is in charge of water supply in small towns and villages. Drinking water quality monitoring is a wide-range assessment of the quality of water in a distribution system as supplied to the consumer [15] but this is rarely done in raw water from dams and rivers [16, 17].
A good environmental sanitation is required to maintain a clean, safe and good physical and natural aquatic environment in all human settlement, to enhance the socio-cultural, economic, and physical well-being of all aspects of the population [Republic of Ghana, 2010]. Open defecation in which individuals or households dispose of faeces in fields,forests, bushes, open bodies of water, beaches or other open spaces, or with solid waste pollute or degrade water quality. This result in the spread of diarrhoea as well as parasitic infections such as soil-transmitted helminths (worms) [18]. Bacteria, viruses, protozoa and parasites such as worms can transmit typhoid fever, cholera, dysentery, infectious hepatitis and other forms of diseases to human. These pathogens enter water primarily through the faeces and urine of infected people and other animals.
The [19] have observed that $91\%$ of the world's population used drinking water from improved sources leaving 663 million people lacking access to an improved source of water. Unimproved water sources threatens people's lives with cholera, hepatitis A, diarrhoea, dysentery, and other sanitation-related diseases, increasing the mortality rate of people particularly children. Households that have no toilet facilities in the Gambaga and Nalerigu townships defecate in the bushes or fields [20]. The beauty of Nalerigu is marred by the practice of open defecation leading to poor sanitation. For instance, the proportion of households in Gambaga and Nalerigu Townships that have no toilet facilities is 70.5 percent and resort to open defecation. As a result, runoff easily washes the excreta into available surface waters such as rivers or dams. Water sampling and monitoring are required on an ongoing basis to back up hydrogeological studies and to more accurately assess water quality and propose sustainable management strategies [21, 22, 23, 24]. This study, therefore assesses water quality of the Nalerigu dam with the objective of unearthing and contributing to evidences required for sound decision-making on managing surface water quality in Ghana.
## II. STUDY AREA AND METHODOLOGY
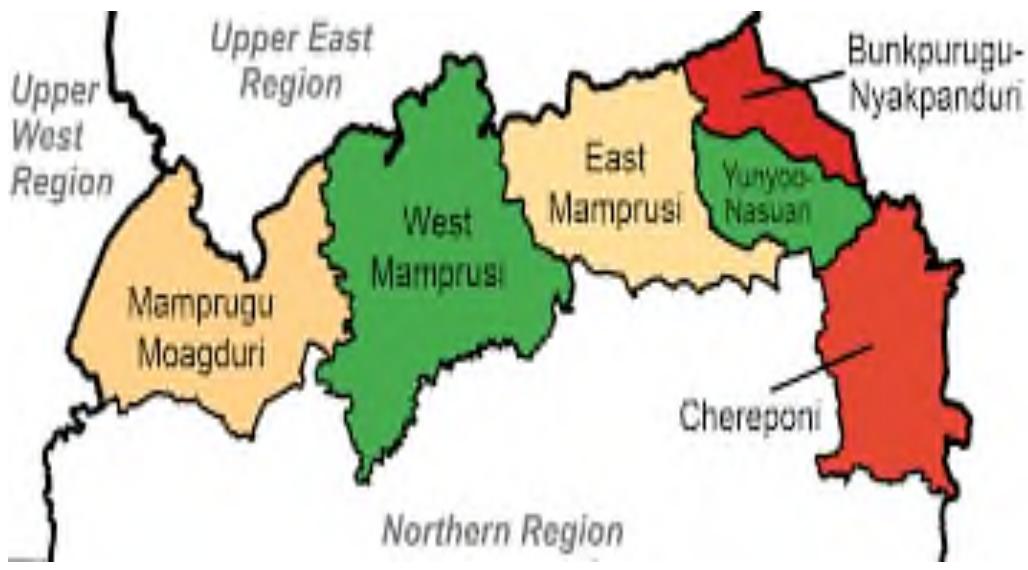
The study was conducted in Nalerigu which is the capital of the East Mamprusi Municipality (Figure 1) and also, the capital of the the North-East Region of Ghana. It has geographical coordinates of $0^{\circ}32^{\prime}\mathrm{N}$ and $0^{\circ}22^{\prime}\mathrm{W}$ [25]. It is the seat of the Mamprusi paramountcy. The inhabitants of the town are mostly farmers and grow crops such as maize, millet, groundnuts, cotton, soya bean, etc. They also rear domestic animals including sheep, goats, cattle and poultry (guinea fowls, ducks, turkeys and fowls)
Nalerigu experiences a single maxima rainfall regime from April to October. The annual average temperature of the District is $27.4^{\circ}\mathrm{C}$ and varies from about $35^{\circ}\mathrm{C}$ in March to about $27^{\circ}\mathrm{C}$ in August. The high temperature is ideal for drying and preservation of groundnuts and other cereals produced in large quantities in the District. The climate is good for the rearing of animals like cattle, donkeys, small ruminants and poultry[25].
According to the provisional figures for 2010 Population and Housing Census, the East Mamprusi Municipality has a population of 188,006. The distribution shows that females account for 96,887 with 91,119 males, representing $51.5\%$ and $48.5\%$ respectively. The average population density is 105.9 persons per $\mathrm{km}^2$. There are 142 communities. Nalerigu has a population of about 658,903persons [26].
Agriculture and its related activities is the main economic activity of Nalerigu in the East Mamprusi Municipality. Generally, agricultural production activities in the town are labour intensive carried out by both males and females. According to the [25] agricultural population by gender is 2:1 (male: female). Most often farmers, basically engaged in planting and harvesting as well as post-harvest activities. Most crop farmers $(82\%)$ are small-scale holder while only $3\%$ of farmers have large scale holdings. Agriculture employs the largest proportion of the population aged 15 years and above as their main job [25].
### a) Sampling Site
This research was conducted within the Nalerigu dam in the East Mamprusi District of Ghana. Three points of the dam named point A (upstream close to the banks where there is little or no anthropogenic activity), B (midstream where usually people fetch water, bath and do washing) and C (lower stream where the water enters into the dam) were selected for sampling and over which samples were taken once every month for three consecutive months within the period of $4^{\text{th}}$ December, 2023 to $4^{\text{th}}$ February, 2023.
The samples were analyzed at the Water Research Institute laboratory in Tamale to determine some physico-chemical and biological parameters. The following water quality parameters were analyzed: temperature, colour, pH, hardness, Total Dissolved Solids (TDS), Total Suspended Solids (TSS), turbidity, electrical conductivity, total alkalinity, iron (II), using standard methods. Presumptive test using lactose broth was performed for water samples to detect the presence of bacteria.
### b) Sample Collection
Water samples were collected using 1.5 L Voltic plastic bottles. The containers were cleaned thoroughly with water and soap, sterilized with ethanol and rinsed with distilled water. The glass containers were washed by soaking in aqua regia (3 parts conc. HCl and 1 part HNO3) and rinsed with tap water and finally with distilled water. Samples were collected between the hours of 9 am and $10\mathrm{pm}$. This was to ensure that the water. Sampling protocols were strictly adhered to during sample collection. The sample containers were rinsed with some of the dam water and then completely filled to capacity leaving no air space and immediately covered. For bacteriological analysis, Sampling bottles and culture tubes were immediately corked and neatly labeled. The environmental sanitation conditions around the dam were taken into consideration by careful observation of surrounding at least $50\mathrm{m}$ away. The human activity around the dam as well as the underlying topography was noted.Water samples were transported to the laboratory in an ice chest and stored in a refrigerator at $4^{\circ}C$ upon arrival. The dam water quality analysis was focused on bacteriological (Total coliforms and faecal coliforms) and physicochemical (temperature, pH, turbidity, total dissolved solids (TDS) dissolved oxygen (DO), total hardness and alkalinity) parameters [27].
### c) Laboratory Analysis
The work bench was sterilized with about $70\%$ alcohol to kill any bacteria. Glasses were also sterilized in hot air oven for about two hours $160^{\circ}\mathrm{C}$ while media other rubber materials were autoclaved at $120^{\circ}\mathrm{C}$ for 15 minutes, cups of plastic samples were slightly loosened to prevent distortion.
### d) Physicochemical Analysis
The temperature was simply determined using the CO150 conductivity/TDS portable meter while measuring other parameters like conductivity and TDS. The procedure was repeated for the other samples two more times and the average temperature value of each sample was recorded.
The pH values of the various samples were determined using the pH colour Comparator. The colour comparator had two special test tubes of which one was filled with about $50\mathrm{mL}$ deionized water while the other filled with about $50\mathrm{mL}$ aliquot of the sample. The appropriate indicator (either Bromothymol blue or Thymol blue) was then used in two drops added to the sample depending on the pH range. These were then inserted into the comparator and the disc rotated until a standard colour corresponding to the pH of the sample was read on the disc by comparing the colour match with the blank. The readings were recorded for the sample. The procedure was repeated for the other samples and their pH values recorded.
$10\mathrm{mL}$ of each sample was measured into 250 mL conical flask and $2.0~\mathrm{mL}$ of ammonium chloride buffer solution $(\mathsf{pH} = 10)$ added to each followed by the addition of a few drops of Eriochrome Black-T indicator solution. The resulting solution was titrated with 0.01M EDTA solution with continuous stirring/swirling until the endpoint was reached. The endpoint is when the last reddish tinge disappears. The colour change obtained was blue black. The procedure was repeated three times for each sample and the average titre value was calculated. The appropriate calculations were made to obtain the actual value for total hardness mg/L as $\mathrm{CaCO_3}$. This procedure was repeated for all the samples collected [28].
## III. CALCULATIONS
Total hardness in mg/L $\mathrm{CaCO}_3 = \mathrm{A} \times \mathrm{B} \times 1000 / \text{Sample volume used (mL)}$
Where $A =$ mL of titrant and $B =$ mg $\text{CaCO}_3$ equivalent to 1 mL EDTA titrant
Similarly, $10\mathrm{mL}$ of each sample was measured into $250~\mathrm{mL}$ conical flask and $2.0~\mathrm{mL}$ of $\mathrm{NaOH}$ buffer solution added to each followed by the addition of about $30\mathrm{mg}$ of Murexide (Ammonium perpurate) indicator crystals. The resulting solution was titrated with $0.01\mathrm{mM}$ EDTA solution with continuous stirring/swirling until the endpoint was reached. The colour change obtained was from pink to purple. The procedure was repeated three times for each sample and the average titre value was calculated. The appropriate calculations were made to obtain the actual value for calcium hardness mg/L as $\mathrm{CaCO_3}$. This procedure was repeated for all the samples collected.
### Calculations:
Total hardness in mg/L $\mathrm{CaCO}_3 = \mathrm{A} \times \mathrm{B} \times 1000/$ Sample volume used (mL) Where $A =$ mL of titrant and
$\mathrm{B} = \mathrm{mgCaCO}_{3}$ equivalent to $1 \mathrm{~mL}$ EDTA titrant
Magnesium hardness was determined simply by subtracting the calcium hardness from the total hardness. The determinations were made after refrigerated samples had been allowed to attain room temperature. The CO150 conductivity/TDS portable meter was used. The sample was poured into a $100\mathrm{mL}$ beaker. The conductivity meter was calibrated by dipping the probe in distilled water. It was then transferred into the sample and the value recorded. The procedure was repeated for all the other samples.
### a) Total dissolved solids (TDS) determination
A $50\mathrm{mL}$ well-mixed sample was measured into beaker. The CO150 conductivity/TDS portable meter probe was immersed in the sample and its total dissolved solids recorded [28].
The stored program number for colour was entered into HACH DR/2000 spectrophotometer with the wavelength set to display 'PtCo Colour' units. A sample cell was filled with $10~\mathrm{mL}$ of filtered deionized water (the blank). A second sample cell was filled with $10~\mathrm{mL}$ of filtered sample (prepared sample). The blank was placed into the cell holder to zero the spectrophotometer followed by the prepared sample. The result in Platinum-Cobalt Units was displayed and value recorded. The procedure was repeated for the other collected samples.
The stored program number for turbidity was entered into HACH DR/2000 spectrophotometer with the wavelength set to display 'NTU Turbidity Units'. Two sample cells were obtained. One was filled with $10\mathrm{mL}$ of filtered deionized water (the blank) and the other was filled with $10\mathrm{mL}$ of the prepared sample. The blank was placed into the cell holder to zero the spectrophotometer followed by the prepared sample. The results in Nephelometric Turbidity Units was displayed and value recorded. The procedure was repeated for the other collected samples and the mean value taken.
An aliquot of $10\mathrm{mL}$ of sample was measured into a conical flask. The $\mathsf{pH}$ was then adjusted to a range of 7-10 with $\mathsf{H}_2\mathsf{SO}_4$ for high pH samples and with NaOH for low pH samples. Two drops of $\mathsf{K}_2\mathsf{CrO}_4$ indicator was added. The colour change obtained was yellow to reddish brown. The procedure was repeated two more times and the average titre value calculated. This procedure was repeated for all the samples collected.
Chloride (mg C1 $^{-}$ /L) = X×N×1000×35.5/1mL of sample
X=end point volume
N=Normality of $\mathrm{AgNO}_3$
### b) Alkalinity Determination (Methyl Orange Alkalinity)
The total alkalinity as expressed in terms of calcium carbonate present was determined by titration using standard $0.02\mathrm{N}$ $\mathrm{H}_2\mathrm{SO}_4$ with methyl orange as indicator to the first permanent pink colour for $\mathsf{pH} < 8.3$. For $\mathsf{pH} > 8.3$, phenolphthalein is used. Since all the pH val ues were less than 8.3, only methyl orange was used hence methyl orange alkalinity was determined. There was no phenolphthalein alkalinity for any of the samples. $10\mathrm{mL}$ of the sample was measured into a conical flask and two drops of $5\%$ methyl orange indicator was added and swirled to mix. It was titrated against standard $0.02\mathrm{N}$ $\mathrm{H}_2\mathrm{SO}_4$ with continuous swirling. A colour change of yellow to orange was obtained when the endpoint was reached. The titre value was then recorded. The procedure was repeated for each sample and the average titre value was calculated. The procedure was repeated for all the collected samples. The alkalinity concentration was calculated as; Alkalinity mg $(\mathrm{CaCO}_3)/\mathrm{L} = \mathrm{A} \times \mathrm{N} \times 50,000 / 1\mathrm{mL}$ sample [28].
#### Where A=mL of acid used and
N= Normality of standard acid used
The stored program number for iron, FerroVer method was entered into spectrophotometer with the wavelength set appropriately. A clean cell sample was filled with $25\mathrm{mL}$ of sample and the content of one FerroVer Iron reagent was emptied into the sample cell (the prepared sample). An orange colour was an indication of the presence of iron. The shift timer button was pressed and allowed for about five minutes to allow for a reaction to take place. $25\mathrm{mL}$ of blank solution in cell was placed in the cell holder and the light shield was closed to zero the spectrophotometer. The blank was then removed and the prepared sample was put into the cell holder and the result was displayed in mg/L Fe FV. The procedure was repeated for the rest of the collected samples.
### c) Bacteriological Analysis
Total coliforms and faecal coliforms were enumerated by multiple tube fermentation tests as described by [28]. In the multiple-tube method, a series of 5 tubes with Durham tubes containing a suitable selective broth culture medium (lactose-containing broth, such as MacConkey broth) were inoculated with test portions of water sample from each of the boreholes. After an incubation time of 24-48 hours at a temperature of $37^{\circ}\mathbf{C}$, each tube showing gas formation in the Durham tubes and a colour change was regarded as "presumptive positive" since the gas indicates the possible presence of coliforms. However, gas may also be produced by other organisms, and so a subsequent confirmatory test is essential. The two tests are known respectively as the presumptive test and the confirmatory test [28].
For the confirmatory test, a more selective culture medium (brilliant green bile broth) was inoculated with material taken from the positive tubes. After an appropriate incubation time of 24-48 hours and temperature of $44.5^{\circ}\mathrm{C}$, the tubes were examined for gas formation as before. The most probable number (MPN) of bacteria present can then be estimated from the number of tubes inoculated and the number of positive tubes obtained in the confirmatory test, using specially devised statistical tables. This technique is known as the MPN method.
A questionnaire was administered to 100 residents of Nalerigu who were within $50\mathrm{m}$ from the damand uses the water for domestic purses from a population of 135 residents [29]to ascertain the perception of residents about the quality, usefulness or otherwise of the dam.
$$
S = \frac{X^{2}NP(1-P)}{d^{2}(N-1)+X^{2}P(1-P)}\dots\dots\dots\dots\dots\dots\dots\dots\dots\dots\dots\dots eqn(1)
$$
Variables:
The respective variables have been given their explanations below.
$S =$ required sample size
$X^{2} =$ table value of Chi-square for 1 degree of freedom (df) at desired confidence level (3.841)
$$
N = \text{Thepopulationsize} = 1 3 5
$$
$P =$ The population proportion (Assumed to be 0.5 since this would provide the maximum sample size)
$d =$ the degree of accuracy expressed as proportion (0.05) From the information above;
$$
S = \frac{3.841(135)(0.5)(1-0.5)}{(0.05)^2(135-1) + (3.841)(0.5)(1-0.5)} = \frac{129.63375}{1.31025}
$$
$$
\begin{array}{l} = 9 8.9 3 8 2 \\= 9 9 \text{(Approximately)} \\\end{array}
$$
The data obtained was analyzed using SPSS 16.0 for the physicochemical parameters, Microsoft Word and Minitab 16.0 for the public perceptions. Tables were used to present the findings.
## IV. RESULTS AND DISCUSSION
### a) Physicochemical Parameters for the Dam Water Within the Sampled Period
A total of 3 samples were investigated for this work. The water samples from the dam were analyzed in order to compare their levels to WHO water standard for drinking water. The average physical and chemical properties and nutrient content of the dam water samples including pH, electrical conductivity, turbidity, alkalinity, hardness, total dissolved solids (TDS), total suspended solids (TSS), colour, chloride, iron content from these sample points are shown in Tables 1, 2 and 3.
## i. Temperature
The mean temperature for all the sampling sites ranged from 30.3 and $30.5^{\circ}\mathbf{C}$ with the highest temperature of $30.5^{\circ}\mathbf{C}$ recorded at sample A and the lowest tem perature of $30.3^{\circ}$ Crecorded at sample B (Table 1). The little variation in temperatures in the dam water shows some uniformity of the dam water temperature in the study area.
## ii. Hardness
Average total hardness for the dam water samples ranged from 5.0 to $6.0\mathrm{mg / L}$ (Table 1). The highest value was recorded at sample points A and B and the lowest at sample point C. The least Calcium hardness value of $2.00\mathrm{mg / L}$ was recorded for sample points A and B and the highest value of $3.00\mathrm{mg / L}$. Calcium hardness was recorded for sample point C. also magnesium hardness was determined for all three samples with average values ranging from $2.00\mathrm{mg / L}$ for sample point C to $4.00\mathrm{mg / L}$ for sample points A and B. The hardness values were low which indicates that the water samples were all soft and within the WHO permissible limit of $500\mathrm{mg / L}$. Hardness of water may not have any health implications but may affect the taste of water as well as influence its lathering ability by forming scum with soap when used for washing.
Table 1: Mean Values of Physico-Chemical Parameters and Nutrients at Nalerigu Dam
<table><tr><td>Sample Point</td><td>Temp °C</td><td>pH</td><td>T Hardness mg/L</td><td>Ca Hardness mg/L</td><td>Mg Hardness mg/L</td></tr><tr><td>WHO Limit</td><td></td><td>6.5-8.5</td><td>500.00</td><td></td><td></td></tr><tr><td>Sample Point A</td><td>30.5</td><td>6.40</td><td>6.00</td><td>2.00</td><td>4.00</td></tr><tr><td>Sample Point B</td><td>30.3</td><td>6.50</td><td>6.00</td><td>2.00</td><td>4.00</td></tr><tr><td>Sample Point C</td><td>30.4</td><td>6.30</td><td>5.00</td><td>3.00</td><td>2.00</td></tr></table>
pH- The mean pH ranged from 6.30 to 6.50 with the highest pH of 6.50 occurring at sample B and the lowest pH of 6.30 at sample C (Table 1). The pH values for all the three samples analyzed, two samples (A and C) fell
outside and only sample (B) fell within the WHO guidance limit of 6.5 – 8.5. Though the pH of drinking water has no direct health effects, levels outside the WHO range of 6.5 – 8.5 could indirectly affect the quality of drinking water by either resulting in acidic water for pH less than 6.5 or bitter taste for pH values greater than 8.5. The differences in the pH of the various samples may be due to the characteristics of the source waters influenced by both natural and anthropogenic factors such as washing of clothes back into the dam, agriculture, waste disposal and acid precipitations.
## iii. Turbidity
Turbidity of the dam water samples for all the sample points varied from 7.0 to a very high turbidity value of 10.0 NTU. The lowest turbidity value of 7.0 NTU was recorded for two samples (B and C) and the highest value of 10.0 NTU was recorded for sample A (Table 2).
Table 2: Mean Values of Physico-Chemical Parameters and Nutrients Analyzed at the Dam
<table><tr><td>Sample Point</td><td>Total Dissolved Solids (TDS) mg/L</td><td>Apparent Colour HU (PtCo)</td><td>Turbidity NTU</td><td>Fe2+mg/L</td></tr><tr><td>WHO Limit</td><td>1000.00</td><td>0.00 – 15.00</td><td>0.00 – 5.00</td><td>1.0</td></tr><tr><td>Sample Point A</td><td>35.20</td><td>6.10</td><td>10.00</td><td>0.63</td></tr><tr><td>Sample Point B</td><td>34.00</td><td>3.30</td><td>7.00</td><td>0.44</td></tr><tr><td>Sample Point C</td><td>34.40</td><td>3.50</td><td>7.00</td><td>0.53</td></tr></table>
From the results, turbidity of all the samples exceeded the WHO recommended acceptable limits of 0.00-5.0 NTU. Turbidity directly influences the colour of water and there is a general increase in colour with increasing turbidity values. The excessive turbidity in water correlates with the very high apparent colour. This makes water purification processes such as flocculation and filtration difficult making treatment expensive [30]. High turbidity can inhibit the effects of disinfection against microorganisms and enable bacterial growth. Ideally disinfection is effective at turbidity below 0.1 NTU. Turbidity is an important parameter which gives an indication of the effectiveness of the treatment processes especially with the coagulation or sedimentation and the filtration.
## iv. Total Dissolved Solids (TDS)
Mean total dissolved solids concentrations ranged from 34.0 to $35.2\mathrm{mg / L}$ for all three samples with the highest value recorded at sample A and the lowest at sample B (Table 2). These amounts of TDS measured in the monitored samples were within acceptable levels recommended by WHO. [31] stated that the palatability of water with TDS level less than $600~\mathrm{mg / L}$ is generally considered to be good whereas water with TDS greater than $1200~\mathrm{mg / L}$ becomes increasingly unpalatable. This indicates that all water samples that were taken were suitable for drinking in terms of palatability because all are within the recommended standards.
## v. Colour
Colour is an important physical property of water because of its implications for water supply, and the need to reduce it to acceptable levels by water treatment is highly recommended. Increase in the colour of water in reservoirs results in increase in treatment cost. Colour in natural water usually results from the leaching of organic materials and is primarily the result of dissolved and colloidal humic substances, primarily humic and fulvic acids. Colour is also strongly influenced by the presence of iron and other metals, either as natural impurities or as corrosion products. Highly coloured water may be due to decaying vegetation. Apparent colour ranged from 3.30 to 6.10 Hazen units for all sample points with the highest at sample point A and the lowest at sample point B. All three samples were within the WHO limit of 15 HU (Table 2)
## vi. Electrical Conductivity
Electrical conductivity gives an account of all, the dissolved ions in solution. The mean conductivity of all water samples ranged from a least value if $68.70\mu \mathrm{S} / \mathrm{cm}$ at sample point C to a considerably high mean value of $70.50\mu \mathrm{S} / \mathrm{cm}$ at sample point A (Table 2). The acceptable WHO limit of conductivity is 0 - $1000.00\mu \mathrm{S} / \mathrm{cm}$. Generally, conductivity of clean water is lower but as it moves down the earth it leaches and dissolves ions from the soil and also picks up organic from biota and detritus [32]. Generally, the conductivity values recorded for the samples from the dam does not pose any potential health risk for consumers. They were all within the acceptable limit prescribed by WHO limits.
## vii. Alkalinity
Total alkalinity ranged from 20.0-23.0 mg $\mathrm{CaCO_3 / L}$ for all three sample points within sample period with the highest value recorded at sample point B and the lowest at sample point C. These values were within the WHO limit of $0 - 500.00\mathrm{mg / L}$ (Table 3). There was however no Phenolphthalein alkalinity for all three points sampled. This is because all the pH values were below 8.3 $(\mathsf{pH} < 8.3)$ hence all alkalinity values were Methyl Orange alkalinity (Table 3). Alkalinity values provide guidance in applying the right amount of chemicals to the treatment of drinking and waste water. High alkalinity means the drinking water will have the ability to neutralize acidic pollution and hence keeps the water's pH constant. Water with very high alkalinity is not detrimen tal to humans but is generally associated with high pH values, hardness and excess dissolved solids. High alkalinity waters may also have a distinctly unpleasant taste. This is because such waters may excessively hard
or may contain high amounts of sodium chlorides [33]. Alkalinity has no health standards, however, concentrations between 30-400 mg CaCO3/L is preferred for domestic drinking water supply.
Table 3: Mean Values of Physico-Chemical Parameters and Nutrients Analyzed for Dam Water in Nalerigu February, 2023
<table><tr><td>Sample Point</td><td>Total Alkalinity mg/L</td><td>Phenolphthale in Al- kalinity mg/L</td><td>Methyl Orange Alka- linity mg/L</td><td>Conductivity μS/cm</td></tr><tr><td>WHO LIMIT</td><td>0-500.00</td><td></td><td>0-500.00</td><td>1000</td></tr><tr><td>Sample Point A</td><td>22.00</td><td>0</td><td>22.00</td><td>70.50</td></tr><tr><td>Sample Point B</td><td>23.00</td><td>0</td><td>23.00</td><td>68.80</td></tr><tr><td>Sample Point C</td><td>20.00</td><td>0</td><td>20.00</td><td>68.70</td></tr></table>
## viii. Total Iron
The total iron (II) concentration ranged from $0.44 - 0.63\mathrm{mg / L}$ with the highest value occurring at sample point A which is within the WHO recommended limit of $0.01 - 1.00\mathrm{mg / L}$. The lowest value of $0.44\mathrm{mg / L}$ occurred at sample point B.
Drinking water $0.1 - 1.00\mathrm{mg / L}$ of iron concentration has very slight effects on taste and other aesthetic effects such as deposits in plumbing materials and associated problems occurring. Iron concentration ranging from $0.3 - 1.0\mathrm{mg / L}$ has adverse aesthetic effects (taste) and a gradual increase in the possibility of problems with plumbing. There are however no health effects associated with it.
### b) Microbiological quality of the dam water analyzed
The result obtained for the microbial analysis indicated that the water samples from sample points A, B and C were not free from faecal coliforms (faecal con tamination). These samples show that the dam water without processing is not fit for drinking and domestic purposes because the sample points A, B and C had faecal coliform counts of 23, 43 and $20\mathrm{cfu} / 1\mathrm{mL}$ respectively which is not in conformity with the set standards by [32] which says no water sample should contain faecal coliform in any $100\mathrm{ml}$ of water sample. However, the presence of faecal coliform count (Table 4) in the samples may be attributed to either proximity of open defecation to the dam at a distance less than $30\mathrm{m}$ as recommended by WHO or the general unhygienic environment surrounding the dam. The contamination even though may be small could also be attributed to increased infiltration during the wet season. Therefore, there is the need to boil and filter this water for clarity before drinking. The results however suggest that the general sanitary conditions around the dam were not very good.
Table 4: Showing Test for Microbiological Properties of Dam Water Samples
<table><tr><td>Sample Point</td><td colspan="2">Total Coliforms cfu/1ml</td><td colspan="2">Faecal Coliforms cfu/1ml</td></tr><tr><td>WHO Limit</td><td></td><td>0.00</td><td></td><td>0.00</td></tr><tr><td>Sample Point A</td><td>Positive</td><td>69.00</td><td>Positive</td><td>23</td></tr><tr><td>Sample Point B</td><td>Positive</td><td>106.00</td><td>Positive</td><td>43</td></tr><tr><td>Sample Point C</td><td>Positive</td><td>70.00</td><td>Positive</td><td>20</td></tr></table>
### c) Sociodemographic Results from the Study
The number questionnaire administered was 99 and indicates the percentages of males (44%) and females (56%) who responded to the questionnaires. The response from the respondents was $100\%$ for the access to water to all the households interviewed, indicating that every household interviewed had access to water. The responses from the administration of the questionnaires showed that close to half of the interviewed households (48%) representing the largest number depend on the dam as their main source of water, 36% depend on boreholes as their source of water and 8% each depend on hand dug well and pipe borne water respectively. The response from the questionnaires showed that the various households employ various ways to treat their water to make it safe for consumption. The responses from the questionnaire revealed that a larger number of the interviewed households representing $76.0\%$ had no toilet facilities at their homes and only $24\%$ had toilet facilities at home. Those without toilet facilities at home either use public toilets or do open defecation.
Responses from how the various households disposed off their rubbish indicated that $78\%$ of the households dispose their waste through burning whiles $22\%$ disposed theirs through dumping the waste at dump sites. The multiple use of the dam by the various households interviewed is shown in the table 5.
Table 5: Showing the Various uses of the Dam by the Households Interviewed
<table><tr><td>Uses of dam water</td><td>Frequency</td><td>Percentage</td></tr><tr><td>Cooking</td><td>60</td><td>60.6</td></tr><tr><td>Washing</td><td>73</td><td>73.8</td></tr><tr><td>Bathing</td><td>81</td><td>81.8</td></tr><tr><td>Drinking</td><td>46</td><td>46.5</td></tr><tr><td>Irrigation</td><td>38</td><td>38.4</td></tr></table>
NB: The frequency and percentages for the uses of dam exceeded 99 respondents and $100.0\%$ respectively because some of the respondents choose more than one answer.
## V. CONCLUSIONS AND RECOMMENDATIONS
All the physicochemical parameters analyzed except turbidity were within the WHO limits and Ghana Drinking Water Standards. The level of turbidity for all sampled points exceeded the WHO limits. The microbial load of the dam water was very high and exceeded the WHO limits and this can be attributed to the fact that the surroundings of the dam is used for open defection. The study concludes that raw dam water was not safe for consumption and other domestic uses unless it is treated. It is recommended that future researchers who are interested in the quality of water in the study area should broaden the scope to include the determination of the heavy metals, and other parameters which were not determined as a result of lack chemicals and the requisite equipment. Regular monitoring is necessary to ensure conformity to WHO standards. The inhabitants and users of the dam in Nalerigu should be educated on the need to keep the surroundings of the dam clean. Farming done close to dam should be done at a reasonable distance to avoid the washing of agrochemicals into the dam through runoff
### ACKNOWLEDGMENT
The author will thanks the chiefs and people of Nalerigu for allowing him to use the dam for the study and the management and staff of the Water Research Institute in Tamale for the water quality analysis in their laboratory.
Generating HTML Viewer...
References
34 Cites in Article
Christon Hurst (2019). Options for Providing Microbiologically Safe Drinking Water.
David Holcomb,Jackie Knee,Trent Sumner,Zaida Adriano,Ellen De Bruijn,Rassul Nalá,Oliver Cumming,Joe Brown,Jill Stewart (2020). Human fecal contamination of water, soil, and surfaces in households sharing poor-quality sanitation facilities in Maputo, Mozambique.
Xin Fang,Xiaoyan Li,Yifei Zhang,Yuan Zhao,Jian Qian,Chunling Hao,Jiaqi Zhou,Yifan Wu (2021). Random forest-based understanding and predicting of the impacts of anthropogenic nutrient inputs on the water quality of a tropical lagoon.
Nadir Mohammed (2021). The Development Trap: Militarism, Environmental Degradation and Poverty in the South.
A Plessis (2019). Primary Water Quality Challenges, Contaminants and the World’s Dirtiest Places.
H Ritchie,M Roser (2021). Clean water and sanitation, our world in data.
B Adelodun,F Ajibade,J Ighalo,G Odey,R,G Ibrahim,/ Kareem,K Adeniran (2021). Assessment of socioeconomic inequality based on viruscontaminated water usage in developing countries.
(2019). The State of Civil Society Organisations Sustainability in Ghana.
Minju Lee,Mikyeong Kim,Yonghwan Kim,Mooyoung Han (2017). Consideration of rainwater quality parameters for drinking purposes: A case study in rural Vietnam.
S Ewaid,S Abed,N Al-Ansari,R,M Salih (2020). Development and evaluation of a water quality index for the Iraqi rivers.
Deborah Liew,Kathryn Linge,Cynthia Joll (2016). Formation of nitrogenous disinfection by-products in 10 chlorinated and chloraminated drinking water supply systems.
Z Wang,L Li,R Ariss,R Coburn,M Behbahani,Z Xue,Seo (2021). The role of biofilms onthe formation and decay of disinfection byproducts in chlorinated water distribution systems.
Wang,Z,. Nie,H Feng,B Witherell,M Alebus,M Mahajan,W Zhang,L Yu (2018). Causes, assessment, and treatment of nutrient (N and P) pollution in rivers, estuaries, and coastal waters.
Katarzyna Pietrucha-Urbanik,Janusz Rak (2020). Consumers’ Perceptions of the Supply of Tap Water in Crisis Situations.
Paul Bradley,Denis Leblanc,Kristin Romanok,Kelly Smalling,Michael Focazio,Mary Cardon,Jimmy Clark,Justin Conley,Nicola Evans,Carrie Givens,James Gray,L Earl Gray,Phillip Hartig,Christopher Higgins,Michelle Hladik,Luke Iwanowicz,Keith Loftin,R Blaine Mccleskey,Carrie Mcdonough,Elizabeth Medlock-Kakaley,Christopher Weis,Vickie Wilson (2021). Public and private tapwater: Comparative analysis of contaminant exposure and potential risk, Cape Cod, Massachusetts, USA.
Mohamed Elhag,Ioannis Gitas,Anas Othman,Jarbou Bahrawi,Petros Gikas (2019). Assessment of Water Quality Parameters Using Temporal Remote Sensing Spectral Reflectance in Arid Environments, Saudi Arabia.
Duie Bui,Khabat Khosravi,John Tiefenbacher,Hoang Nguyen,Nerantzis Kazakis (2020). Improving prediction of water quality indices using novel hybrid machine-learning algorithms.
(2020). A League Table of Child Poverty in Rich Nations.
Christopher Burlak,Karl Kerns (2015). Xenotransplantation literature update, January–February 2015.
I Osumanu,E Kosoe (2018). Where do I answer nature's call? An assessment of accessibility and utilization of toilet facilities in Wa, Ghana.
N Rahmanian,Siti Ali,M Homayoonfard,N Ali,M Rehan,Y Sadef,A Nizami (2015). Analysis of Physiochemical Parameters to Evaluate the Drinking Water Quality in the State of Perak, Malaysia.
Nidhi Gupta,Pankaj Pandey,Jakir Hussain (2017). Effect of physicochemical and biological parameters on the quality of river water of Narmada, Madhya Pradesh, India.
Ali Rezaei,Hossein Hassani,Nima Jabbari (2019). Evaluation of groundwater quality and assessment of pollution indices for heavy metals in North of Isfahan Province, Iran.
P Singh,A Kumar,S Mishra (2021). Development & Sustainability. Performance evaluation of conservation plan for freshwater lakes in India through a scoring methodology.
P Turkson,J Naandam (2012). Constraints to ruminant production in East Mamprusi District of Ghana.
(2021). Population and housing census.
S Basavaraja-Simpi,K Hiremath,K Murthy,Aniln Chandrashekarappa,E Patel,Puttiah (2011). Analysis of water quality using physicochemical parameters in Hosahalli Tank inShimoga District, Karnataka, India.
(2017). Standard methods for the examination of water and wastewater.
R Krejcie,D Morgan (1970). Determining sample size for research activities.
W Bank (2014). World development indicators: Ghana mortality.
J Maskeliunas (2011). Codex alimentarius: Code of hygienic practice for bottled/packaged drinking waters (Other Than NMW).
Recommended International Code Of Codex,Practice Unknown Title.
Who (2011). Water quality for drinking: who guidelines.
No ethics committee approval was required for this article type.
Data Availability
Not applicable for this article.
How to Cite This Article
Abdul-Rahaman Issahaku. 2026. \u201cAssessment of Water Quality of the Nalerigu dam in the East Mamprusi Municipality of the North East Region of Ghana\u201d. Global Journal of Science Frontier Research - H: Environment & Environmental geology GJSFR-H Volume 23 (GJSFR Volume 23 Issue H2): .
Explore published articles in an immersive Augmented Reality environment. Our platform converts research papers into interactive 3D books, allowing readers to view and interact with content using AR and VR compatible devices.
Your published article is automatically converted into a realistic 3D book. Flip through pages and read research papers in a more engaging and interactive format.
The study investigated the water quality of the Nale-rigu dam and compared to the WHO recommended levels for both physicochemical and bacteriological parameters. There was also a survey of 99 out of 135 household heads who were within 50 meters around the dam to assess their usage of the dam water. The sampled dam water was analysed at the Water Research Institute laboratory in Tamale. The water pH was found to range from 6.30 to 6.50 with a mean temperature range of 30.3 to 30.50C. The turbidity of the water exceeded the WHO limits. Other physicochemical parameters monitored including total suspended solids, total dissolved solids, total hardness, total alkalinity values were within the WHO recommended levels for surface water quality. Results of the bacteriological analysis including faecal coliforms and total coliforms were high. It was concluded that the Nalerigu dam was contaminated and unsafe for human consumption if not treated. The study recommends a further study into metallic concentration of the dam to ensure the quality besides physicochemical and bacteriological parameters of the dam.
Our website is actively being updated, and changes may occur frequently. Please clear your browser cache if needed. For feedback or error reporting, please email [email protected]
Thank you for connecting with us. We will respond to you shortly.