I. INTRODUCTION
The series-parallel systems consist of subsystems connected in series where each subsystem consists of units arranged in parallel. The failure of any of the subsystems will lead to the failure of the whole system. These systems can be seen in industries, power stations, manufacturing, production and telecommunications. Owing to their importance in industries and economy, reliability measures of such systems have become an area of interest. System are normally studied in terms their reliability measures such as steady-state availability, busy period, profit function and mean time to system failure (MTSF). Availability and profit of redundant systems can be enhanced using highly reliable structural system design. Improving the system reliability and availability will also increase the production and associated profit. The study of reliability of repairable systems is an important topic in Engineering and Operation Research. System reliability is a very meaningful measure and achieving required level of reliability and availability is an essential requisite. System reliability and availability depends on the system structure.
Due to their importance in promoting and sustaining industries and economy, reliability and economic analysis of such systems have received attention from different researchers, see for instance. Sanusi et al have recently presented the performance evaluation of an industrial configured as series-parallel system. Gahlot et al. have analyzed the performance assessment of serial system with different types of failure and repair policy. M. S. Rao et al. have analyzed a system dynamics model for transient availability modeling of repairable redundant systems.
Singh and Ayagi [8] presented the study of availability of standby complex system under waiting repair and human failure using Gumbel–Hougaard family copula distribution. Yang et al [10] have discussed the reliability assessment of system with inconsistent priors and multi-level data. Malik et al[4] have presented the study of performance modeling and maintenance priorities decision for water flow system of a coal based thermal power plant. Yusuf [12] has used Chapman Kolmogorov differential equation to present the availability and other relevant measures of a two-unit active parallel system connected with external supporting device for operation with online and offline preventive maintenance. Singh et al. [9] discussed the performance of the complex system in the series configuration under different failure and repair discipline. Kumar et al[3] have studied the availability and cost analysis of an engineering system involving subsystems in series configuration. Ram Niwas and Harish Garg [5] studied the availability, reliability and profit of an industrial system based on cost free warranty policy. Yusuf, I [11] presented the availability modelling and evaluation of repairable system subject to minor deterioration under imperfect repairs. M. S. Kadyan and Ramesh Kumar [2] have presented the study of the availability and profit analysis of feeding system in the sugar industry.
In this paper, the study of availability and profit analysis of a series-parallel system is presented. The primary focus of this study is to analyse the effects of system parameters on availability and profit and make comparison to know the most critical component in the system. The rest of this paper is organised as follows: Section 2 presents the notations and assumptions used throughout the study. System description is given in section 3. Section 4 deals with the formulation and solution of the model. The results of our numerical simulations and discussion are given in section 5. The paper is concluded in section 6.
II. NOTATIONS AND ASSUMPTIONS
a) Notations
: Failure rates of subsystem A, B, C and D respectively.
: Repair rates of subsystem A, B, C and D respectively.
: Steady-state availability.
PF: Profit function.
: Revenue generated when the system is in working state and has no income when in failed state.
: Cost of each repair for supporting device.
: Cost of each repair for failed unit.
: Busy period of repairman.
: Derivative with respect to time .
b) Assumptions
The system may be in operating state or in a failed state.
Failure and repair rates are constant overtime and statistically independent.
A repair unit is as good as new performance wise for a specified duration.
Sufficient repair facilities are provided, i.e. no waiting time to start the repairs.
Standby units (if any) are of same nature and capacity as active units.
6. System failure/repair follow exponential distribution.
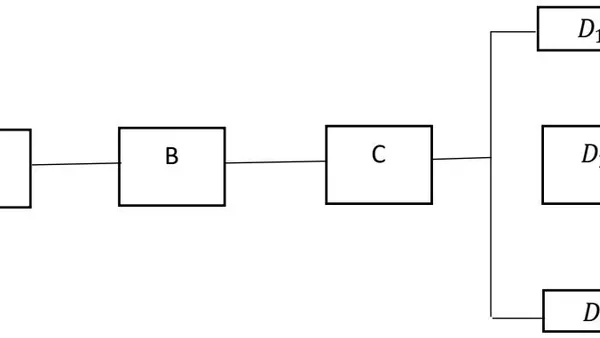
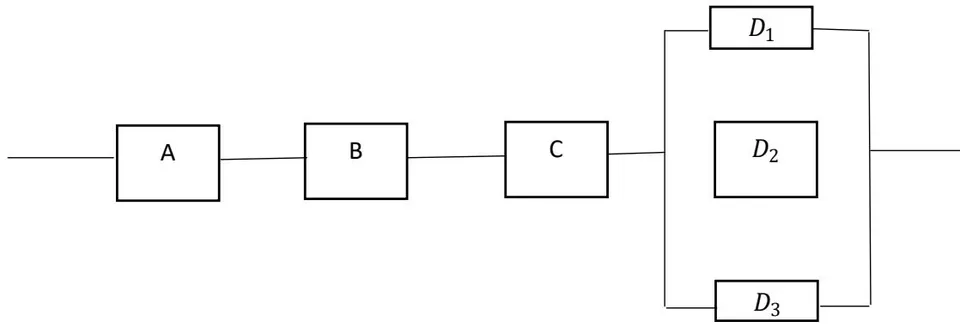
ii) Subsystem (B): a single unit arranged in series. Failure of this unit causes the complete failure of the system.
iii) Subsystem (C): is a single unit arranged in series. Failure of this unit causes the complete failure of the system.
iv) Subsystem (D): consists of four units arranged in parallel, two are in operative mode and one in cold standby mode. Complete failure of the system will occur only when two units failed at the same time.
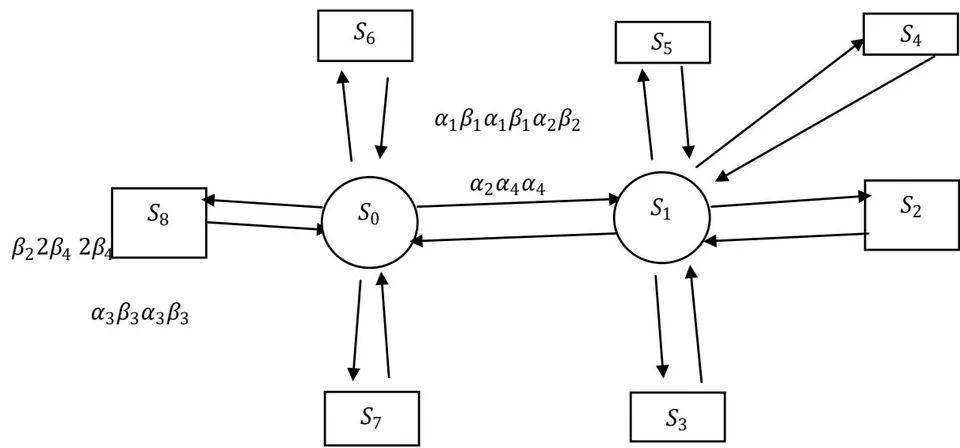
Where, the initial conditions at time t = 0 are:
a) Availability equations
To get the steady state availability of the system (ASS), (i.e., time independent performance behaviour) which mean d/dt =0 and , the above equations (eq.1 to 10) become:
These equations were solved recursively, the values of steady state probabilities are as follows:
The probability of full working capacity, namely, P0 determined by using normalizing condition: (i.e. sum of the probabilities of all working states, reduced capacity and failed states is equal to 1).
, hence,
Now, the steady state availability of the system may be obtained as summation of all working state probabilities as
b) Profit Analysis
Let , and be the revenue generated when the system is in working state and has no income when in failed state, cost of each repair for supporting units and accumulated cost of each repair for failed units (corrective maintenance) respectively. Then the expected total profit per unit time incurred to the system in the steady-state is:
Combining eq.22, 23, 24 and 25 we obtain:
V. DISCUSSION OF RESULTS
In this section, we numerically obtained and compare the results for system availability and profit function for the developed models. The objectives here are to analyze graphically the effects of system parameters on availability and profit and make comparison. The following set of parameters values are fixed throughout the simulations for consistency.
Figure 4.1: .
Figure 4.2: .
Figure 4.3: .
Figure 4.4: .
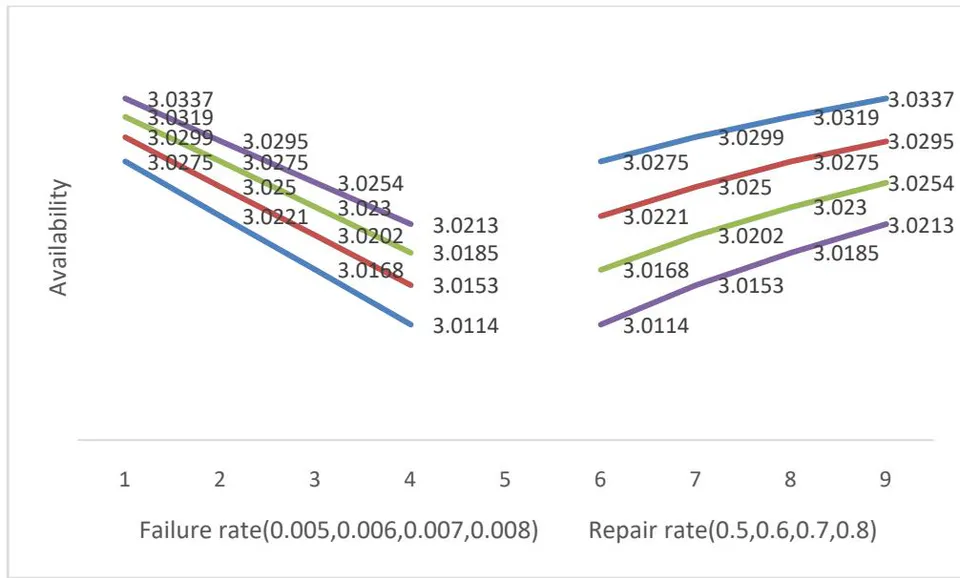
Figure 3 shows the effect of failure rate and repair rate on the long run availability of the system. It is seen from this figure that as the failure rate increases, the system availability decreases considerably. Similarly, as the repair rate increases, the system availability increases appreciably. This simulation suggests that regular repair will improve the system availability. Figure 4 presents the impact of failure rate and repair rate on system availability. We observe from this figure that as the failure rate grows, the system availability tends to decrease. It is also observed from this figure that the system availability increases with increase in the values of repair rate .
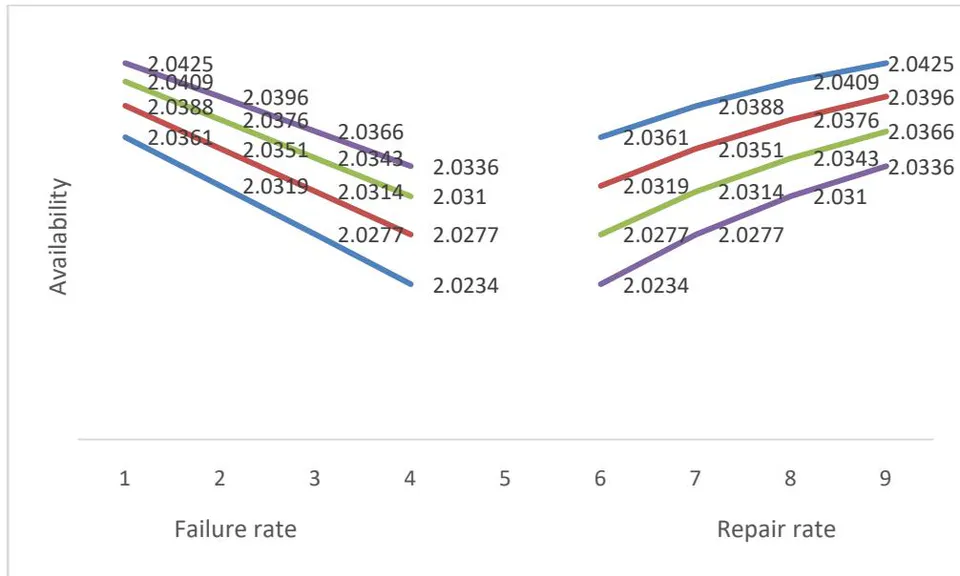
The availability of system with different values of parameters and is correspondingly represented in Figure 5. From this figure, one can observe that these two parameters have significant effect on the system availability. Increasing parameter
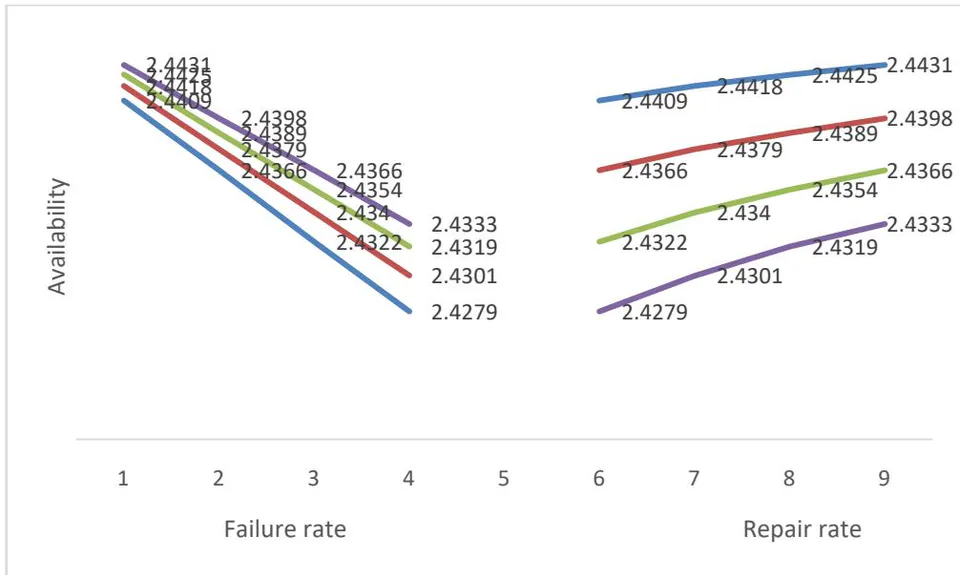
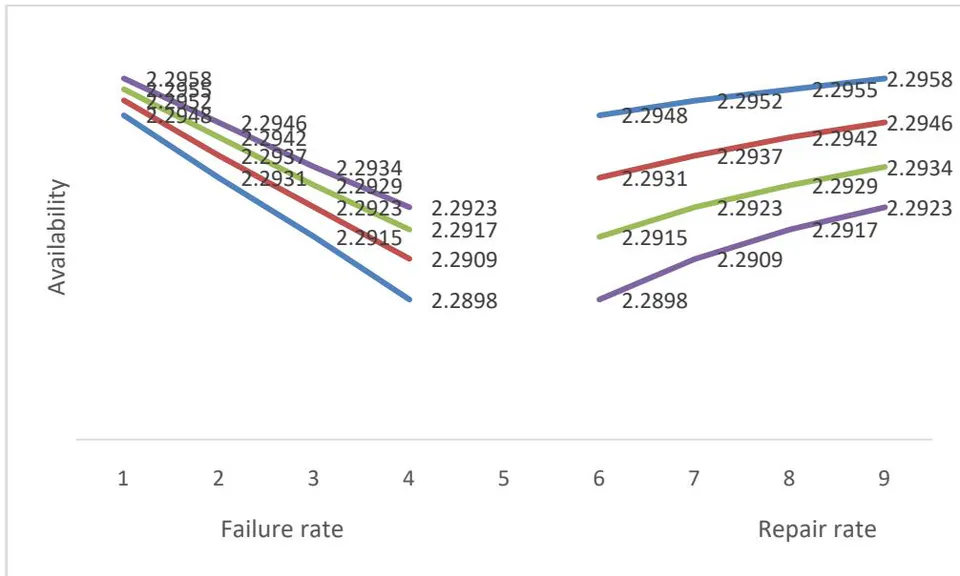
The expected profit function of system versus parameters and respectively, is graphically illustrated in Figure 7. As shown, the behavior of profit function of system is descending with parameter and is ascending with parameter .
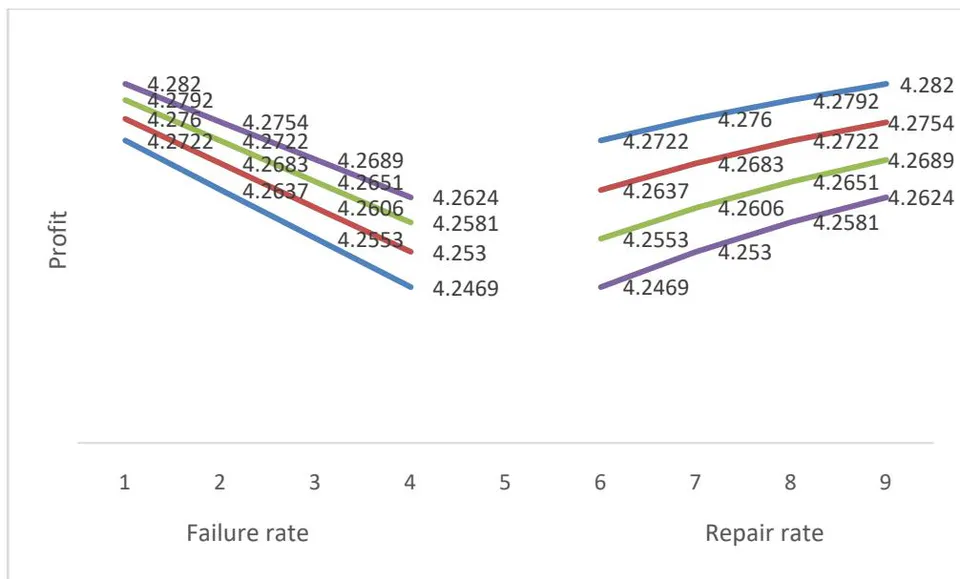
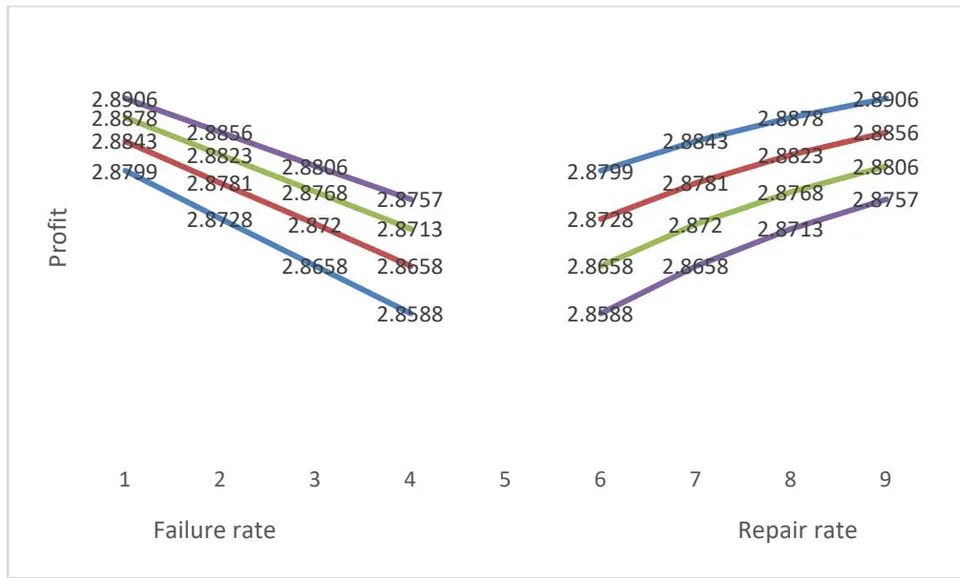
The effect of failure rate and repair rate on profit function is depicted in figure 9. This figure indicates that as the values of failure rate increases, the profit function also decreases while the profit function increases with increase in the values of repair rate.
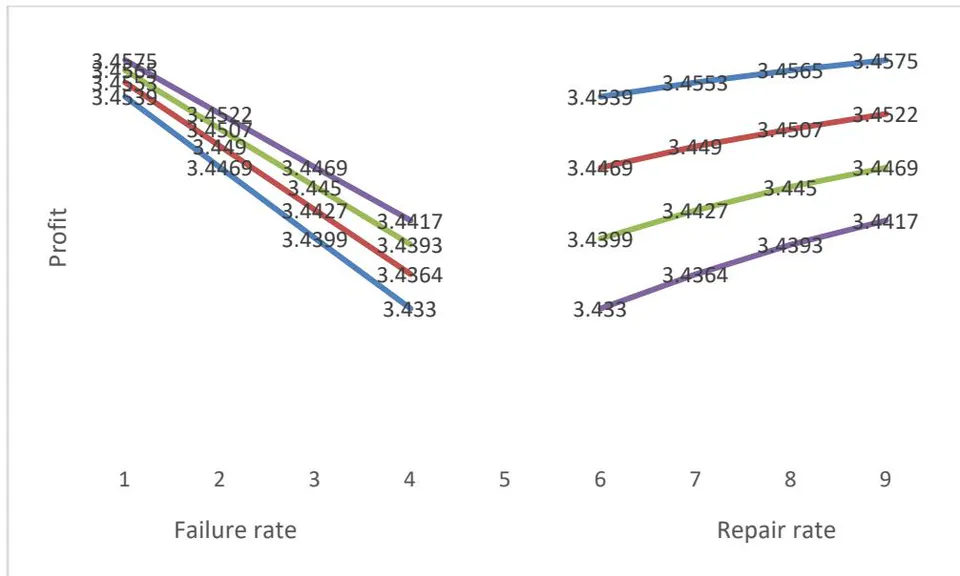
Finally, in order to compare the system availability and profit function of the system, we only compare the availability and profit functions of subsystems A and B respectively. The profit function of subsystem A is drastically more than the profit function of subsystem B with increase in the values of repair rates as evident from figure 7 and figure 8. This simulation suggests that subsystem A gives the highest expected profit function. Thus, subsystem A is the most critical component in the system which needs special attention and careful observation.
VI. CONCLUSION
In this work, we constructed four different series-parallel systems consisting of subsystems A, B, C and D. Subsystems A, B and C consist of single unit each in series while subsystem D consists of four units arranged in parallel. We developed the explicit expressions for the availability, busy period and profit function for the four systems and performed a comparative analysis. Parametric investigation of various system parameters on system availability and profit function has been captured. It is interesting to see that as the repair rates of each subsystem increase; the availability and profit also increase. This implies that the major repair should be invoked to reduce the failure rate and maximize the system profit.