
I. INTRODUCTION
Internal meshing gear transmission is widely used in power transmission equipment such as tank turrets, radar systems, and wind power gearboxes due to its compact structure and high torque to weight ratio. Planetary gear transmission is an important application of internal meshing transmission, widely used in industries, automobiles, aviation, aerospace and other fields. The gear system itself has a complex structure and is prone to faults when working in harsh environments[1], which affects the reliable operation and service life of the equipment. Therefore, monitoring and diagnosing the operating status of the gear system is of great significance[2]. Reasonable modeling and theoretical analysis of gear system dynamics are the prerequisite and foundation for effective gear fault monitoring and diagnosis, and accurate calculation of gear mesh stiffness is an essential part of analyzing system dynamics. Therefore, studying the time-varying meshing stiffness of internal meshing gears with root crack defects, analyzing the influence of root cracks on the dynamic characteristics of gear systems, is of great significance for early fault diagnosis.
Many scholars worldwide have done a lot of work in gear dynamics and time-varying meshing stiffness. Weber[3] conducted analytical calculations for gear mesh stiffness without defects. Cornell[4] and Kasuba[5] applied numerical analysis methods to calculate the gear mesh stiffness. Yang and Lin[6] used the so-called potential energy method to calculate the total meshing stiffness of gear pairs and achieved high calculation accuracy. Since then, the potential energy method has been widely accepted. Basis on Yang, Tian[7] and Wu[8] further improved the calculation model of meshing stiffness by considering the influence of load shear. However, they still did not consider the deflection of the rounded foundation. Chaari et al.[9] considered the influence of energy on various parts of the gear teeth and calculated the meshing stiffness of gears with crack faults. Wan et al.[2] considered the situation where the tooth base circle and tooth root circle do not coincide, proposed a meshing stiffness correction method, and established a tooth root crack dynamic model to study the influence of tooth root cracks on the dynamic response of gear systems. Sun[10] used a straight line segment instead of the transition curve of the tooth profile, and used the potential energy method to solve the meshing stiffness of gears with and without cracks. Zhang et al.[11] derived an analytical formula for the meshing stiffness of spur gears based on the potential energy method, and analyzed the variation of meshing stiffness with different frictional forces. Meng et al.[12] considered the gear transition curve function and used the potential energy method to calculate the stiffness changes of 10 different crack lengths. They considered the time-varying meshing stiffness and sliding friction between teeth, and analyzed the dynamic response of gear systems with cracks. Liu et al.[13] used the principle of generation method to calculate the tooth profile equation with the rolling angle of the cutting tool as a unified variable, and solved the time-varying meshing stiffness of the gear based on the energy method. Sun et al.[14] divided spur gears into many separate slices along the tooth width and proposed a modified calculation model for spur gear pairs with tooth profile modification based on the relationship between deformation and total stiffness of the meshing cycle. The errors of this method under different modification amounts were discussed. Cao[15] and Xu[16] considered the accurate tooth profile parameterization equation and established a tooth cantilever beam model to solve the time-varying mesh stiffness of spur gears.
However, there are still relatively few calculation and analysis models for the mesh stiffness of the internal gear pair. Hidaka et al.[17] applied the FEA method and analysis model to calculate the deformation of the internal gear ring along the mesh line based on the results of Karas[18]. Chen et al.[19] embedded the Timoshenko beam theory into the meshing stiffness model of internal meshing gear pairs and studied the influence of ring gear flexibility on internal meshing stiffness. Chen et al.[20] calculated the time-varying meshing stiffness of healthy and internal gear pairs with root cracks, and analyzed the impact of ring gear root cracks on the dynamic response of planetary systems. However, Chen et al.[19,20] did not consider the precise root transition curve when calculating the meshing stiffness of internal gears, instead, an approximation algorithm was used.
Lwicki[21-23] has conducted extensive research on the propagation path of tooth cracks and has drawn some beneficial conclusions. He pointed out that the direction of crack path propagation depends on the backup ratio, which is defined as the ratio of the thickness of the wheel rim to the tooth height, and the propagation path is often smooth and continuous. For gears with high backup ratios, tooth root cracks will propagate towards the interior of the teeth along the tooth width direction. For those teeth with lower backup ratios, cracks will pass through the rim. The initial crack angle is also a determining factor for path extension. Under small initial crack angle conditions, even with a high backup ratio, cracks will propagate through the wheel rim.
Charri et al.[24] pointed out that the dynamic response of gear systems is closely related to the time-varying meshing stiffness of gears. When specific tooth faults cause a decrease in meshing stiffness, the system will be monitored for more significant vibration impact and noise. Establishing a gear dynamics model with gear tooth faults will help analyze the changes in system dynamic characteristics, and the model can also serve as a theoretical basis for fault diagnosis. Conducting time-domain, frequency-domain, and time-frequency domain analysis on the dynamic response of gear systems is the most powerful tool for monitoring faults in rotating machinery.
The article applies the potential energy method to establish a time-varying meshing stiffness model for internal meshing gears based on precise tooth profiles. In this model, root crack defects with different size parameters are embedded, and the meshing stiffness of internal meshing gears containing root cracks is obtained. Further established a dynamic model of planetary gear system with root cracks, analyzed the impact of tooth cracks on gear dynamic characteristics, and applied widely used RMS and Kurtosis statistical indicators in vibration detection to reveal the severity of gear cracks. The dynamic response of the planetary gear system was analyzed using time-domain and FFT spectra, as well as cepstrum analysis, in order to quantitatively obtain the influence of tooth root cracks on the dynamic characteristics of gears. This is of great significance for gear condition monitoring and fault diagnosis.
II. ESTABLISHMENT OF AN EQUIVALENT MODEL FOR INTERNAL GEARS
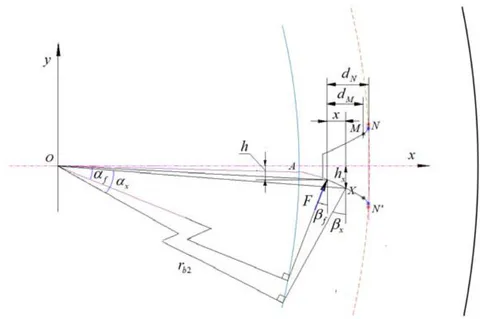
By applying the principle of potential energy, the internal gear tooth is simplified as a variable cross-section cantilever beam on the gear ring, and the time-varying meshing stiffness of the internal gear pair is calculated. The equivalent model is shown in Fig. 1. According to the principle of potential energy, the work exerted by an external force on the gear tooth is equal to the potential energy stored by the gear body due to deformation. The potential energy stored in the gear tooth includes four parts: bending potential energy , shear deformation energy , radial compression deformation energy , and Hertz potential energy . These four types of potential energy can be used to calculate the bending stiffness , shear stiffness , radial compression stiffness , and Hertz stiffness respectively. The total meshing stiffness is the series form of each stiffness. From the knowledge of elasticity and material mechanics, it can be inferred that:
Where: represents the force acting along the meshing line at the meshing point, and represent the horizontal component of force in the x-axis direction and the vertical component of force in the y-axis direction; represents the bending moment generated by force on the beam. is the elastic modulus, is the shear modulus, is the moment of inertia of the gear tooth section at a distance of from the force acting point, and is the cross-sectional area of that point.
III. CALCULATE THE MESHING STIFFNESS OF INTERNAL GEAR BASED ON THE PRINCIPLE OF POTENTIAL ENERGY
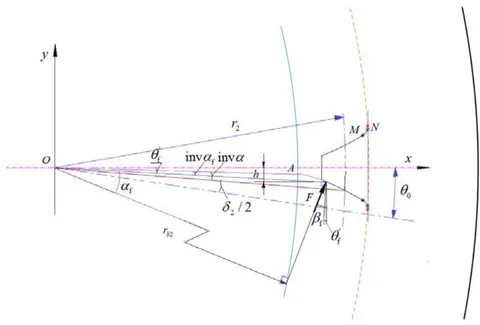
According to the cantilever beam model of the gear teeth, the internal gear tooth profile is divided into two parts: involute and transition curve. As shown in Fig. 1, point M is the tangent point of the connection between the involute and transition curve, also known as the tooth profile transition point[25], and point N is the tangent point of the connection between the transition curve and the tooth root circle. The transition curve is a curve that is enveloped by the rounded corner of the cutter tooth during the internal gear machining process. When the rounded corner of the cutter tooth is non sharp ( ), the transition curve is an equidistant curve of an extended epicycloid[26]. Due to the entirely different equations of tooth profile involute and transition curve, when calculating the deformation energy of internal gear tooth in this article, the cantilever beam model is divided into involute and transition curve two parts for integration. Under the action of meshing force , the deformation energy of tooth bending, shear, and axial compression can be expressed as:
For equations (5), (6), and (7), the first term represents the deformation energy generated by force on the involute tooth profile, and the second term represents the deformation energy generated by on the transition curve. In the formula, and are the -axis distances between the meshing point and the tooth profile transition point
M and the tooth root connection point N. , X is the point on the involute tooth profile or transition curve. x is the horizontal distance between point F and point X, and h and are the distances from point F and point X on the tooth profile to the tooth symmetry line (x-axis), respectively. The specific values can be calculated using the following formula:
In the formula, is the internal gear tooth width, is the angle between the meshing force and the -axis, , It's geometric relationship is shown in Fig. 2, where
\theta_{f}^{\'} = \theta_{0} - \frac{\delta_{2}}{2} - inv\alpha + inv\alpha_{f}Where: , is the number of teeth of the internal gear; is the center angle of the circle corresponding to the arc tooth width of the indexing circular groove for the internal gear, ; , is the modulus of the internal gear, and is the displacement coefficient of internal gear; is the pressure angle of the dividing circle; is the pressure angle at point F. Similarly: , , is the pressure angle at point X, is the pressure angle at point M.


Where:,.
Where, is the vector radius of the transition point M of the internal gear tooth profile, represents the radius of the tooth ring base circle.
For the second integral in equations (5), (6), and (7), which do not include involute related parameters, the stiffness can be solved by numerical integration based on the transition curve parameter equation which can be obtained by referring to Cao et al.[27] s reference:
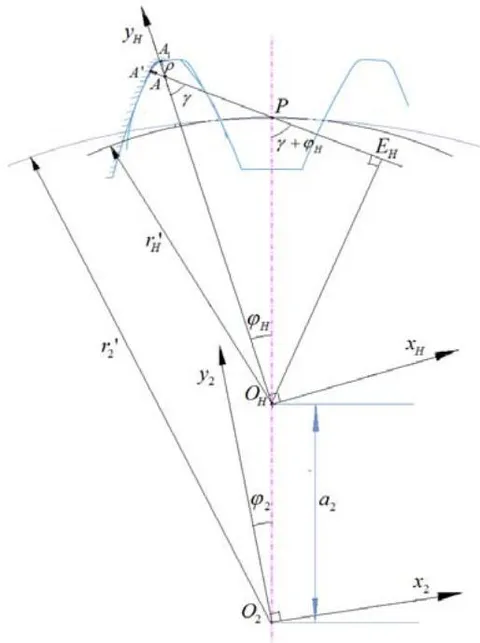
Where, the meaning of is as described in equation (13).
For the second term in equations (5), (6), and (7), according to the transition curve equation (15), it can be obtained that:
Due to the complexity of using function integration calculations, this article adopts a numerical integration method to calculate the deformation energy of the gear teeth. For the bending deformation energy at the point of force , there are:
Where, , , are the number of micro segments divided by numerical integration of the involute tooth profile and transition curve, respectively. The larger the and , the higher the accuracy of numerical integration calculation, but the larger the computational amount. Therefore, it is necessary to choose appropriate values of and .
The reciprocal of the bending stiffness at the meshing force can be obtained from equation (1) as:
Similarly, the reciprocal of the shear stiffness and compressive stiffness at the point of meshing force can be obtained:
The range of action of meshing point is the surface position of the involute tooth profile between the top of the internal gear tooth and the transition point M of the tooth profile, , is the pressure angle of the top of the internal gear tooth.
The stiffness of a single tooth of an internal gear can be expressed as:
The calculation method for the meshing stiffness of external gears can be found in many literatures. The single tooth stiffness of external gears in this article is based on precise tooth profiles and calculated using the Weber energy method in reference [15]. However, the calculation of external gear deformation here needs to correct an error in the original literature. When calculating single tooth deformation in the original literature, the total deformation included the calculation of contact deformation, because only the calculation of gear pair meshing deformation included the calculation of contact deformation. If each single tooth deformation calculation includes contact deformation, then two contact deformations are included in the total deformation of gear pair meshing, resulting in a smaller calculation result of gear pair meshing stiffness, So the calculation of the single tooth stiffness of the external gear here does not include the influence of contact deformation.
Based on the obtained meshing stiffness of the inner and outer teeth, derive the meshing stiffness of a single tooth pair of the inner meshing gear pair:
Where: is the contact stiffness of the gear teeth. According to Hertz's contact deformation theory, assuming that the gear teeth are isotropic, the contact stiffness is only related to the parameters of the gear itself and does not change with the meshing position. And its calculation formula is:
Where, is the Poisson's ratio.
For meshing gears with contact ratio , when two pairs of gears mesh simultaneously, the total effective meshing stiffness is:
IV. STIFFNESS ANALYSIS OF INTERNAL MESHING GEARS WITH ROOT CRACKS
a) Modeling and Analysis of Gear Cracks
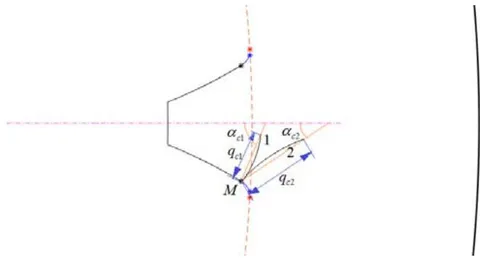
Internal gear root cracks are usually caused by stress concentration caused by insufficient rim thickness in the design, improper processing, material defects and harsh working conditions etc. The internal gear tooth crack propagation model is shown in Fig. 4. According to Lewicki[21,22], crack propagation depends on the backup ratio, which is defined as the ratio of the thickness of the wheel rim to the height of the tooth. For gears with high backup ratios, the analysis predicts that crack propagation will follow the direction of tooth thickness (as shown by crack line 1 in Fig. 4), while for gears with low backup ratios, crack propagation will propagate towards the ring gear along the direction of crack line 2 in Fig.
- Initial crack angle also explains the direction of crack propagation. is defined as the intersection angle between the crack and the centerline of the gear, for low . Even in high backup ratios, cracks will propagate through the ring gear, as shown in Fig. 4. Lewicki[28] pointed out that the crack propagation path is often smooth, continuous, and quite straight with only slight bending.
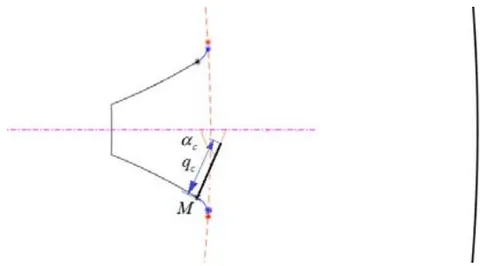
The presence of root cracks will reduce the effective tooth thickness, thereby reducing the stiffness of the gear tooth. In condition monitoring and fault diagnosis, it is necessary to detect gear faults as early as possible. Therefore, this article studies the root cracks of internal meshing gears in the initial stage, and the gear cracks do not extend to the centerline of the teeth. Assuming that the root crack is a straight line as shown in Fig. 5, located at the intersection point M of the involute and the transition curve, with a depth of and an inclination angle , When the crack occurs, the radial compression stiffness calculation of the gear teeth is still the same as that of a normal gear.
The area inertia moment and cross-sectional area in the formula for calculating the bending stiffness and shear stiffness of the gear tooth will change. The formula is as follows:
In the formula, is the distance from the crack endpoint to the centerline of the gear tooth. The prerequisite for applying the formula is: . When , and will still be calculated according to equation (17).
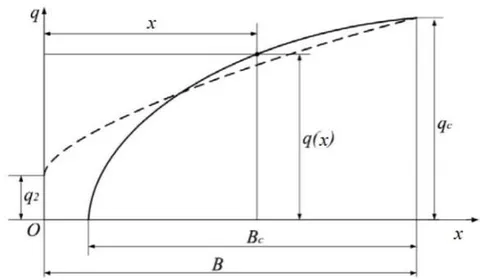
In reference[29], the propagation pattern of gear tooth cracks along the tooth width and tooth thickness directions was studied. As shown in Fig. 6[29], the crack depth is also uneven along the tooth width direction, which can be expressed as a function of the tooth width position , i.e. . When calculating the stiffness of the gear tooth, the gear tooth is cut into many thin slices along the tooth width direction. For each slice, the crack depth is considered a constant, and the stiffness of each slice can be calculated using formulas (20) to (22). In this article, the crack depth is set to be distributed in a parabolic shape along the tooth width, and the crack inclination angle is a constant. The solid line curve in Fig. 6 represents the situation where the crack does not penetrate the tooth width, while the dashed line curve represents the situation where the crack penetrates the entire tooth width. Cracks can be defined as Crack , and finally, by integrating and calculating the stiffness of all these sliced teeth, the stiffness of the entire faulty gear tooth can be obtained.
For the solid crack curve in Fig. 6, the crack depth equation is:
For the dashed crack curve in Fig. 6, the crack depth equation is:
b) The Influence of Tooth Root Cracks on the Stiffness of Internal Meshing
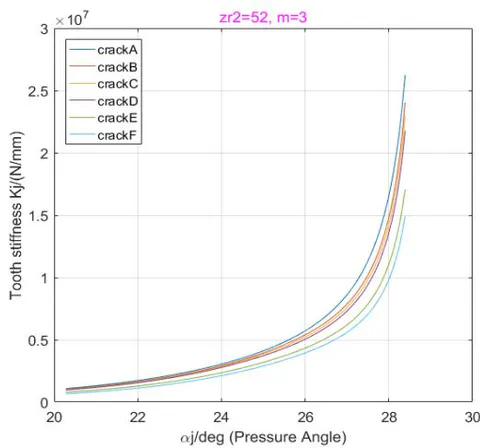
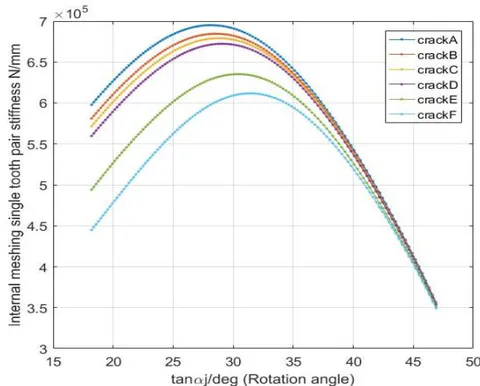
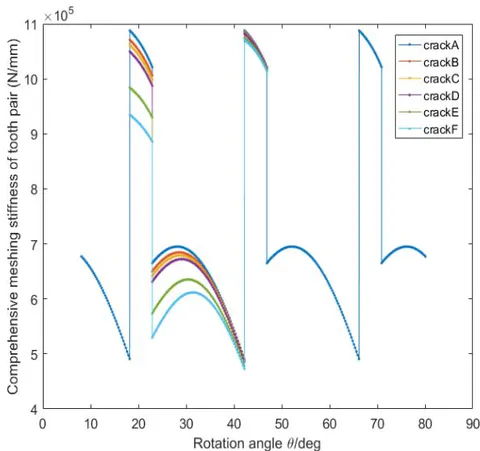
Based on the above gear crack analysis model, calculate and study the influence of gear tooth crack size on gear mesh stiffness. The main parameters of the internal gear pair in the text are shown in Table 1. In order to simulate the propagation of internal gear cracks, the crack size Crack , is given in Table 2. Crack A in Table 2 is a healthy gear without any cracks; B and C represent smaller crack sizes, where the cracks do not penetrate the entire tooth width; Cases D, E, and F represent more extensive crack situations, where the cracks extend further longitudinally along the entire tooth width.
| Parameter Name | Pinion | Ring gear |
| Number of teeth | z1=17 | z2=52 |
| Pressure angle α(°) | 25 | 25 |
| Module (mm) | 3 | 3 |
| Displacement coefficient | x1=0.296 | x2=-0.16 |
| Contact ratio εa | 1.2112 | |
| Tooth width b(mm) | 24 | 24 |
| Input speed of driving wheel (rpm) | 1000 | |
| Young's modulus E (N/mm2) | 2.07e5 | 2.07e5 |
| Poisson's ratio | 0.3 | 0.3 |
Table 2: Internal gear tooth crack size (Note: Crack parameters
and ,Unit: mm)
| Crack | A | B | C |
| C(qc, Bc/B, q2, αc) | (0,0,0,0) | (1,0.7,0,80°) | (1.2,0.8,0,80°) |
| Crack | D | E | F |
| C(qc, Bc/B, q2, αc) | (1.5,1,1.5,80°) | (2,1,1.5,80°) | (3,1,2,80°) |
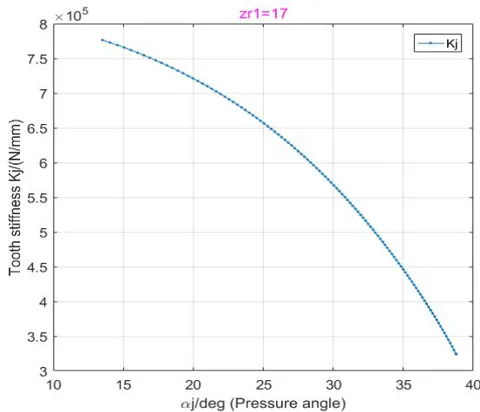
Fig. 7 shows the single tooth stiffness of the external gear in the gear pair, with the external gear being a healthy gear. Fig. 8 and Fig. 9 show the single tooth stiffness and single tooth pair meshing stiffness curves of internal gears with different crack sizes. The comprehensive meshing stiffness reflecting the alternating meshing process of single and double teeth pair is shown in Fig. 10. From the figures, it can be observed that whether it is the stiffness of a single tooth or the meshing stiffness of a pair of teeth, the stiffness curve decreases compared to healthy teeth when tooth cracks are introduced, and the decrease is faster with the extension of the cracks. Large cracks in D, E, and F will weaken the stiffness of the teeth more significantly. Here, the contact position of the gear pair moves along the tooth profile from the top of the ring gear to the root position; The maximum stiffness reduction of cracked teeth occurs at the top of the teeth where the cracked gear begins to mesh. This is because compared to the position closer to the root circle on the inner tooth profile, the tooth flexibility at the tooth tip circle is greater.
V. DYNAMIC ANALYSIS OF PLANETARY GEAR SYSTEM WITH CRACK FAULTS
a) Dynamics Equation of Planetary Gear System
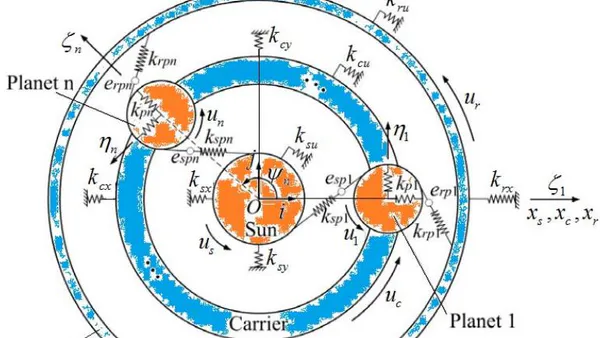
Based on the meshing stiffness of the internal meshing gear pair with root cracks calculated earlier, establish a 2K planetary gear system dynamics model. Calculate the system dynamic response caused by the decrease in meshing stiffness of the gear ring with crack defects through the model. The model was established using the centralized mass parameter method, also known as the analytical model, initially developed by Lin and Parker[30].
The main components of a planetary system include the sun gear (s), ring gear (r), planetary carrier (c), and N planetary gears (p), each of which is considered a rigid body. The coordinates of each component are shown in Fig. 11, and each component has three degrees of freedom: two translations and one rotation. The translation coordinates of the sun gear, ring gear, and planetary carrier are ( ), and the translation coordinates of the planetary gear are ( ), which are the radial and tangential deflection coordinates of the nth planetary gear measured relative to the rotation coordinate system ( ) fixed on the planetary carrier at the origin . The basic coordinate system ( ) rotates at a constant planetary carrier angular velocity , ( ) pointing towards the equilibrium position of planetary gear 1. The coordinates of the rotational degrees of freedom of the component are: , ( ), where is the rotational deflection displacement, is the radius of the gear base circle or the radius of the planetary gear center distribution circle. is the circumferential position angle of the planetary gear relative to the rotational base vector , which is a fixed angle, where .
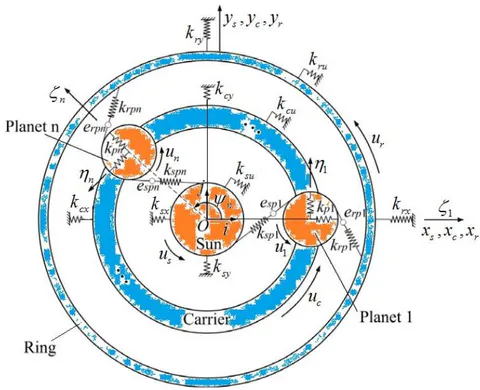
The stiffness of each supporting bearing in the planetary system is modeled by linear springs, and the damping is introduced in parallel with the gear meshing stiffness and bearing support stiffness. , , , represent the meshing displacement and transmission error models on the meshing lines of the sun-planetary gear group and the planet-ring gear group, respectively, and have:
Where: , . are the working pressure angle of the sun-planet gear pair and planet-ring gearpair. , , , , , , are the tooth profile error modulus, meshing frequency, and meshing phase of the sun-planet gear pair and the planetary-ring gear pair[31], respectively.
Establish a motion control equation system for planetary gear systems with degrees of freedom, and assemble the equation system to obtain the matrix equation of the system:
Where, , are the displacement, velocity, and acceleration of the degree of freedom vector, is the mass matrix, is the gyroscopic matrix, is the bearing stiffness matrix, is the centripetal stiffness matrix, and is the time-varying meshing stiffness matrix. is the external torque, which is set as a constant here, and is the excitation force caused by transmission error. The damping matrix is calculated from the formula , where is the modal damping ratio, and the natural frequency and orthogonal normalized modal matrix are derived from a time invariant system that simplifies time-varying mesh stiffness to average values[32].
The configuration parameters of the planetary gear system analyzed in this article are shown in Table 3.
| Gear mesh parameters | Sun gear | Planet gear(mesh with ring gear) | Ring gear | |
| Number of teeth | ||||
| Module (mm) | 3 | 3 | 3 | |
| Teeth width (mm) | 24 | 24 | 24 | |
| Pressure angle (deg) | 28.22 | 21.33 | 21.33 | |
| Cutting tool tip radius (mm) | 1.04 | 1.04 | 0.735 | |
| Base circle dia. (mm) | 27.189 | 20.391 | 70.692 | |
| Outer dia. (mm) | — | — | 95.91 | |
| System parameters | ||||
| Sun gear | Planet gear | Ring gear | carrier | |
| Mass (kg) | 1.52 | 0.3 | 3.23 | 0.513 |
| (kg) | 0.926 | 0.183 | 1.4485 | 1.413 |
| Bearing stiffness (N/m) | ||||
| Torsional stiffness (N/m) | ||||
| Input speed (rpm)/power (W) | 500/3000 | — | — | — |
b) Dynamic Simulation of Planetary Gear System with Tooth Cracks
i. RMS and Kurtosis Indicator Statistics
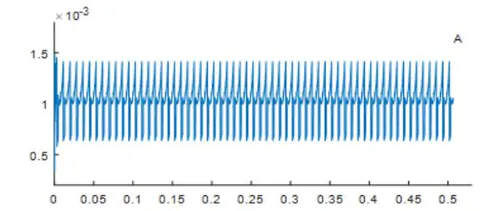
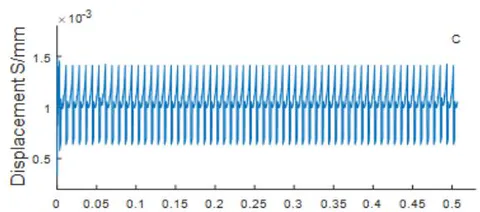
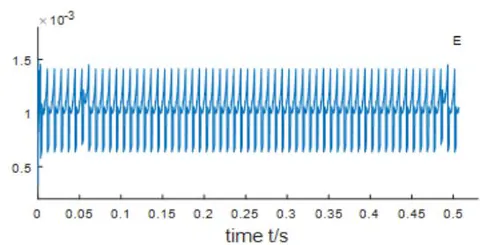
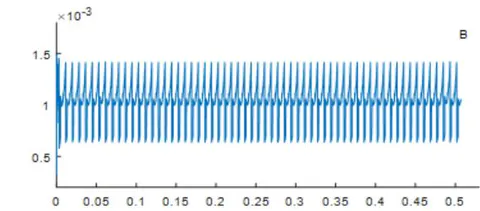
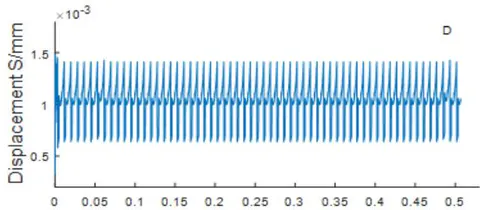
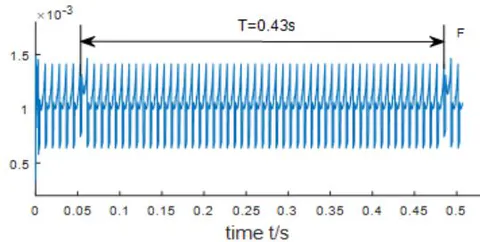
The dynamic response of cracked gear tooth was simulated using a planetary dynamics model, and Fig. 12 shows the dynamic meshing displacement curve between planetary gear 1 and the ring gear. Fig. 12A shows the dynamic response curve of a healthy gear. When the root crack of the ring gear is in the early stage, it is difficult to observe the pulse waveform it produces, as shown in Figures 12B and C. However, as the crack size expands, two evident pulse vibrations appear in Fig. 12E and Fig. 12F, with the interval between the two adjacent pulses precisely equal to the time it takes for the planetary gear to mesh with the crack ring gear for one cycle .
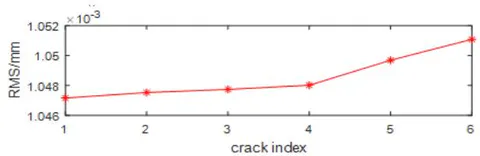
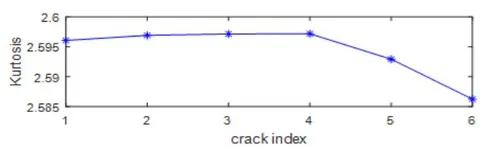
The statistical characteristics of vibration signal measurement are widely used in mechanical fault detection. Wu et al.[8] investigated the performance of some statistical indicators when cracks with different sizes and depths appeared in meshing gears. The results show that using RMS and Kurtosis indicators to detect the severity of crack propagation has good performance. This article applies RMS and Kurtosis indicators to analyze the dynamic characteristics exhibited by six sets of meshing displacement data and evaluates the severity of tooth root cracks.
RMS is the root mean square value of the vibration signal (describing the energy of the vibration signal), and its calculation formula is:
Kurtosis describes the impact characteristics reflected in vibration signals, and its calculation formula is:
In the formula: — is the numerical value of the collected data; — is the length of the collected data; is the average value of the signal.
Fig. 13 shows the trend of calculated RMS and Kurtosis indices varying with crack propagation, with crack indices corresponding to six root crack sizes A, B, C, D, E, and F. From the graph results, it can be seen that for the data in groups A, B, C, and D as shown in Fig. 13, the displacement fluctuations caused by cracks are not significant, and the RMS and Kurtosis indicators are also relatively flat. Correspondingly, the impact fluctuations of the data in groups E and F in Fig. 13 are more prominent, and the statistical indicators also show a clear change trend. RMS shows an upward trend, while Kurtosis indicators show a downward trend. This pattern is similar to the simulation results of L. Cui et al.[33].
ii. Spectrum Analysis
1) FFT spectrum and Zoom FFT analysis
From the dynamic response of planetary-ring gear group meshing in Fig. 12, it can be seen that when a root crack is generated in the ring gear, a pulse vibration will occur. However, when the crack size is small, it is difficult to detect its pulse characteristics in the time domain coordinates. As the crack size expands, obvious pulse vibration will be discovered. In addition to analyzing the characteristics of vibration signals in the time domain, observing their dynamic characteristics in the frequency domain is also an effective way to demonstrate the influence of tooth root cracks.
In order to better analyze the vibration response, calculate the various characteristic frequencies of the planetary system according to equation (35):
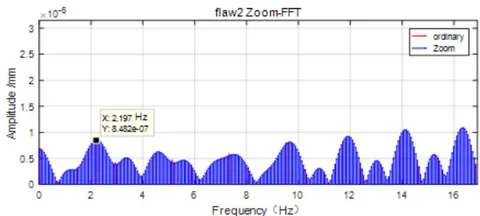
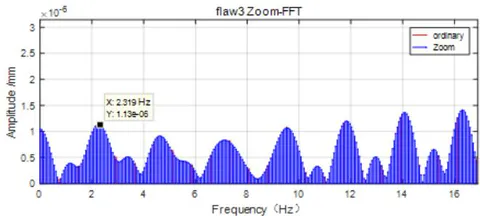
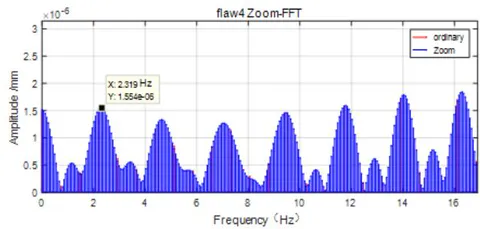
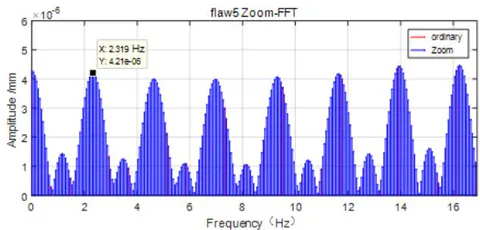
The calculated frequency data of the planetary system are shown in Table 4, where the frequency of crack faults is the planetary carrier rotation frequency .
| Sun gear rotation frequency | Planetary carrier rotation frequency | Planetary gear rotation frequency | Planetary-ring gear meshing frequency |
| 8.333Hz | 2.315Hz | 8.025 Hz | 120.37 Hz |
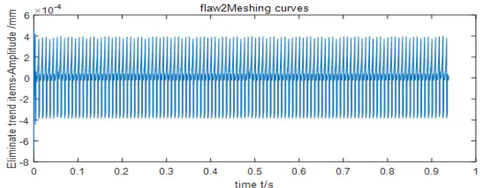
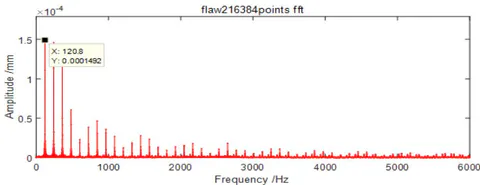
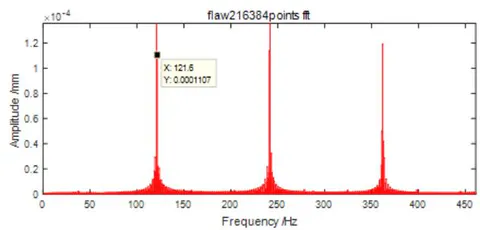
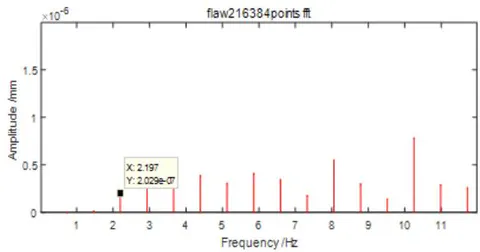
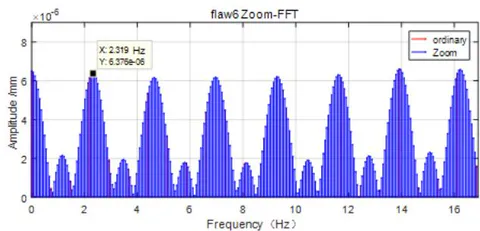
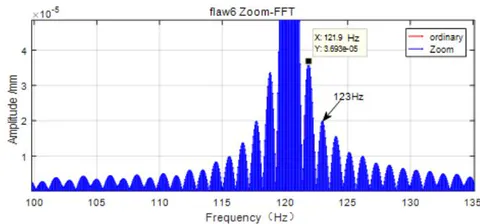
According to the resolution ratio formula , under the condition of a specific sampling frequency , increasing the number of FFT sampling points can reduce the resolution . Therefore, here, the vibration signal time history in Fig. 12 is extended (increased by ) to be greater than two meshing periods (9.3s). Taking the crack response curve in Fig. 12B as an example of frequency spectrum analysis, the results are shown in Fig. 14. The time-domain data in Fig. 14 is formed by eliminating trend terms or normalizing the original data. In its spectrum, the prominent frequency amplitude is the amplitude of the meshing frequency and its doubling spectrum. There are also many sidebands around the meshing fundamental frequency and its harmonics, as shown in Fig. 15(a). Fig. 15(b) shows an enlarged image of the low-frequency part of the spectrum, but due to its low resolution (0.73Hz), it is not possible to clearly display the and its harmonic lines.
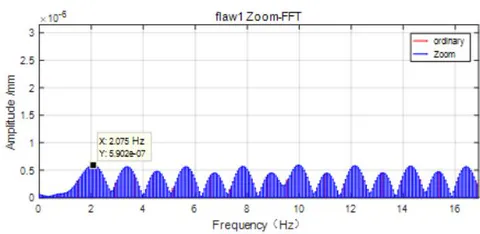
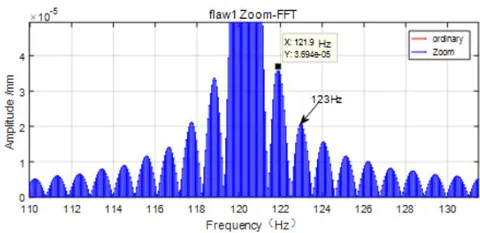
In order to extract accurate spectral information, Zoom FFT analysis is performed on the frequency band of the 0-500Hz component to accurately determine the fault frequency and meshing frequency sideband information. The meshing frequency is accurate to 120.4Hz. The enlarged images of the fault low-frequency band and meshing frequency sideband information are shown in Figures 16 to 21 (flaw1 to flaw6 correspond to the crack groups A to F in Table 2, respectively). It can be seen from the figure that due to the interference of spectral clutter, the peak characteristics of the planetary carrier rotation frequency (fault frequency band ) cannot be accurately displayed when healthy teeth (flaw1) and minor-sized cracks (flaw2) are present. As the crack size increases, the peak amplitude of the fault frequency and its harmonics gradually becomes apparent and increases. Chen et al.[20] argue that the fundamental frequency of gear meshing and its harmonics are difficult to be affected by cracks. For those sidebands, it can be seen from the Zoomed spectrum that there are no fault frequencies around the meshing frequency, and their sidebands amplitudes (121.9Hz and 123Hz) do not change with the increase of crack size. For simplicity, only in Fig. 16b and Fig. 21b the meshing frequency and its side frequency information are displayed.


2) Cepstrum Analysis
Cepstrum analysis, also known as secondary spectrum analysis, is equivalent to performing logarithmic weighting on the signal spectrum, resulting in higher weighting of low amplitude frequency components, which is more conducive to extracting and analyzing periodic components in the signal spectrum[34]. Cepstrum can simplify the family of sideband spectral lines on the original spectrum into a single discrete spectral line, and its spectral line height reflects the size of the periodic component of the power spectrum[35].
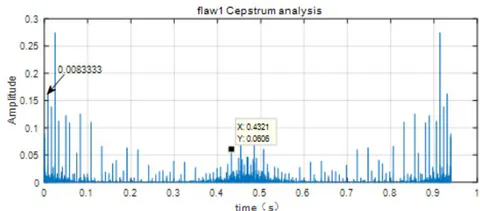
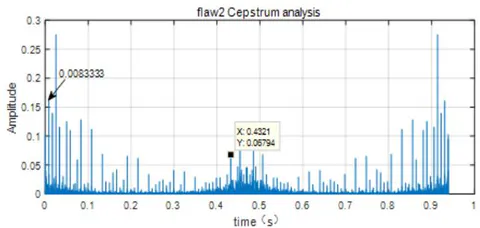
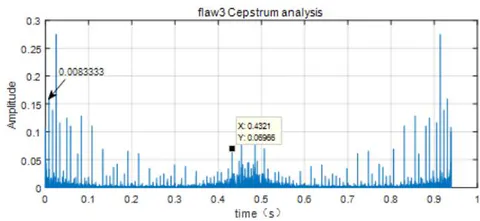
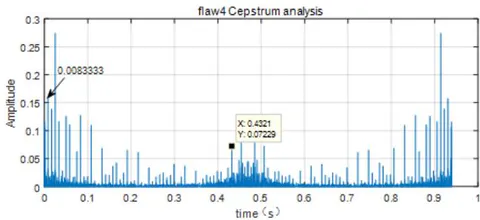
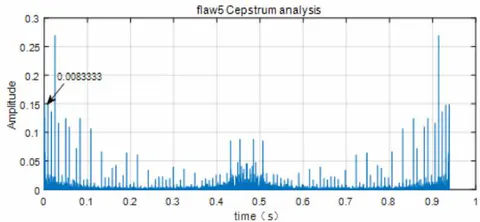
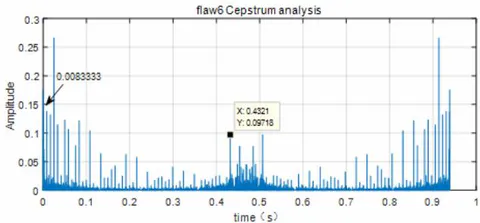
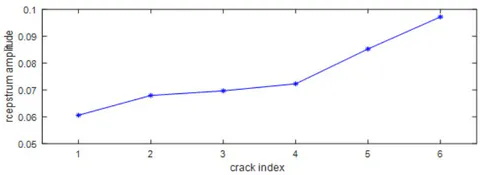
In the FFT spectrum analysis mentioned above, due to the interference of spectral clutter, it isn't easy to detect the information of feature frequency in the spectrum of healthy tooth and tooth with minor root cracks (flaw2). Therefore, further application of cepstrum analysis and identification of fault frequency information is needed. The simulation results are shown in Fig. 22 to Fig. 27. Unlike the FFT spectrogram, the cepstral spectrogram is based on the time as the -axis, where the reciprocal of the coordinate scale represents the frequency value at that coordinate. The frequency component identified at is , which is the meshing frequency . The identified corresponds to , which is the component information of the frequency . The information of the characteristic frequency was identified through cepstral analysis. As the size of the root crack expands, the amplitude of the fault frequency also increases accordingly. The amplitude data of in the cepstral spectrum was extracted and plotted in Fig. 28. The trend of the cepstral amplitude response of with crack propagation can be intuitively seen, which is consistent with the performance trend of the RMS index mentioned above. This further verifies the consistency of the essential characteristics of time-domain and frequency-domain signal analysis.
VI. CONCLUSION
Based on the principle of potential energy, the time-varying meshing stiffness of internal gears was derived, and the influence of root cracks on the meshing stiffness of internal gears was studied. Based on the meshing stiffness model of internal gear pairs with root cracks, a planetary gear system dynamics model is established to study the influence of cracks on the dynamic response of planetary gear sets. Using vibration statistical indicators to evaluate the severity of tooth root cracks, and applying FFT spectrum, ZoomFFT analysis and cepstrum analysis to extract and analyze the dynamic response characteristics of cracks.
(1) The internal gear cantilever beam model is divided into two parts: involute and transition curves for numerical integration. The transition curve part is calculated using ideal parameterized equations, which can accurately calculate the tooth deformation energy and improve the accuracy of stiffness calculation. (2) Gear cracks can weaken and reduce the meshing stiffness, further causing impact vibration of the planetary gear set. As the crack size expands, the impact vibration caused by the fluctuation of meshing stiffness will become more severe. (3) In the vibration spectrum of planetary gear systems, there will be relatively mixed spectra. In the initial stage of crack occurrence, the application of FFT spectrum and its refined analysis cannot observe these weak vibration components. Cepstrum analysis can easily extract the amplitude information of the characteristic frequency , and as the crack size increases, its amplitude also shows a significant growth trend. The analysis results are consistent with the trend judgment of crack propagation using RMS indicators.