## I. INTRODUCTION
Over the Indian subcontinent and its adjoining Indian Ocean, one of the largest global scale circulations emerges known as the Indian summer monsoon during the months of May-June (Webster et al., 1998, Mohanty et al., 2019). Various factors contribute to its genesis, growth and advancement out of which the most important is the land-sea temperature gradient that creates the favourable condition for the seasonal reversal of winds along the equator. Orography over the Indian region is the second factor where the Himalayan Mountains and Tibetan Plateau, that run along the region's northern border and rise steeply from the flatlands of northern India to peak altitudes of $8 - 10\mathrm{km}$ above sea level with a mean plateau height of $4 - 6\mathrm{km}$ above mean sea level. These highlands not only shield the region from the extremely cold winds of Siberia during the cooler months, but also help to shape the structure of a well-defined southwest monsoon circulation over the region and provide a natural barrier to moisture-laden wind (Krishnamurthy and Kinter 2003). The land-sea temperature gradient gives rise to the meridional overturning of the trade winds resulting in the Indian summer monsoon. The heat low crated in the north western India, tropical easterly jet stream, monsoon trough etc. are some of the unique large scale features of the monsoon which control the formation, strength and advancement of the monsoon circulation. Besides these large scale features, complexities are involved in the form of intra-seasonal rainfall variability consisting of active and break phases, mesoscale convective activities, and heterogeneity in spatial rainfall distribution. Combining all the factors the Indian summer monsoon is a very complex atmospheric phenomenon.
During the summer monsoon season, the Indian subcontinent receives around $80\%$ of its annual rainfall thereby directly influencing the lives of nearly a billion people (Mooley and Parthasarathy 1984; Kumar et al., 2010). India as a whole is governed by two prominent monsoon seasons. One is the south west monsoon season or the summer monsoon (June-September) and the other is the north east or winter monsoon season (October-December). During the summer monsoon season, maximum rainfall is observed over the main land region $(>80\%)$ whereas during the winter monsoon rainfall is predominantly observed over the peninsular and northern India. Minor discrepancies in rainfall during both the seasons can create severe extreme conditions and hamper the economy of the region. Studying the changing rainfall pattern and its future projections can help in adapting and mitigating the adverse conditions in future. During the summer monsoon season, moisture laden winds in the form of monsoon circulation transport the moisture from the oceans to the land surface in the form of rainfall. Due to this phenomena, agricultural practices as well as hydrological sectors such as mining, industries, hydropower etc. are highly dependent on the rainfall over the June through September months. Though these months are considered as rainy seasons in India, the rainfall during these months is highly variable. The rainfall variability is intra as well as inter seasonal. The rainfall variability within the season and between the seasons adds up to another complexity of the monsoons. Rainfall variability within the season results in active and break phases of the monsoon whereas the rainfall variability between the seasons results in normal, excess or deficit monsoon season. The rainfall variability plays an extremely important role in controlling the economy of the subcontinent. Active and break phases can affect agriculture by excessive flooding or lack of water where as an excess/drought monsoon season can create havoccs in the form of hydro-meteorological disasters. Gadgil and Joseph (2003) found that prolonged breaks had a negative impact on the country's seasonal monsoon rainfall. During the monsoon season, frequent or extended breaks can result in a rainfall deficit, resulting in a drought-like scenario. Southwest monsoon rainfall and its sustained variability impact the Indian economy adversely because the economic sectors such as agriculture and allied industries, mining, hydropower, etc. are dependent on monsoon rainfall. Minor differences in the summer monsoon strength or delay have had major economic and ecological consequences such as crop loss, droughts, and, in the worst-case starvation (Kumar et al., 2013). For example, in Bihar, Assam, and Uttar Pradesh, many lives were lost during the year 1987 where the rainfall was only $29\%$, $30\%$ and $20\%$ in the July, August and September months (Singh et al., 2013). Thus, it's critical to keep a careful eye on rainfall variations around the country on a daily, weekly, monthly, and seasonal basis.
Evidence of rainfall variations have been demonstrated by many observational studies across different regions of the globe (Dash et al. 2009). Changes in precipitation at regional scales can result in significant changes in water availability (Tabari et al., 2020). One of the major hindrance in studying the rainfall variations over a longer past is the inadequate spatial coverage of the rainfall data sets across different parts of the world (Hegerl et al 2015, Sarojini et al 2012). With the availability of large scale observations, quality precipitation data was only available after 1980s. Contemporary climate studies over these 40 years as well as future projection from the Coupled Model Intercomparison Projects (CMIP) have demonstrated changes in regional as well as global climate and have projected drastic changes in the future climate under different scenarios(Sharmila et al., 2015). Anthropogenic activities have been more or less attributed to the climate variations of the past 40 years (Zhang et al 2007, Mavel and Bonfils 2013) but they can play a major in deciding the future climate and global scale circulations. Land use and land cover changes along with greenhouse gases emission are the major driver of changes in local scale mean climate which may lead to the changes in large scale circulations and weather systems. Many studies using the climate data of the past 30-40 years have shown that there have been significant changes in climate systems and seasonal cycles of the large-scale circulations. Many studies have shown an increasing trend in rainfall pattern and its intensity over USA and Canada during 1891-1990 (Groisman and Easterling 1994). Similar results are also sound over the Mediterranean, Italy and Europe (Turkes 1996, Caloiero et al 2011, Rio et al 2011, Lukovic et al., 2014). Over Asia, some studies have found detectable changes in rainfall over different regions. For example, Herath and Ratnayake (2004) found a reduction in annual rainfall over central Sri Lanka during the period 1958-2007. Increased pre-monsoon rainfall but decrease in the number of wet days was observed by Sahid (2011) over Bangladesh. Increase/decrease in seasonal rainfall have been witnessed over Pakistan/ Malaysia by Salma et al (2012)/Mayowa et al (2015). Heavy rainfall as well as average rainfall has increased substantially in southern China during the last 3 decades but it has decreased in the middle and lower reaches of Yangtze river (Duan, A et al. 2013). Positive trend in the annual and summer rainfall was found over north west parts of Australia which was related increased number of deep convections caused by the monsoon trough (Taschetto et al. 2009). Similar studies for determining the past century rainfall trends over Indian main land region and significant rainfall areas of India have been carried out by many researchers. Guhathakurta et al. (2014) studied the rainfall pattern over India and observed that the rainfall was decreasing in the monsoon core region post-1950. They also found that multi-decadal variability showed different characteristics over different rainfall homogenous regions of India. Dourte et al. (2013) found that the major rainfall characteristics such as the intensity, duration and frequency of rainfall was changing over the past century quite significantly. Similar findings were found by Jin et al. (2014), Panda and Kumar (2014), Maharana et al., (2021) etc. Though the intensity showed an increasing trend, the duration and frequency of rainfall were decreasing which clearly indicated an increase in heavy rainfall events. Regional studies have also been carried out over the southern parts, monsoon core region and north eastern India which showed that rainfall characteristics were changing quite significantly over the past century. Over the southern India, the monsoon rainfall intensity showed an increasing trend (Raj and Azeez 2010; Saini et al., 2020). Kuttippurath et al. (2021) in his study found that the variation in rainfall at Cherapunj, the planet's wettest place, and illustrated how rainfall patterns have shifted over time and space. The observed shift of the wettest spot from Cherrapunj to Mawsynram has been attributed to the changes in spatial pattern in rainfall in the area over the recent period (1973-2019) in their study.
Focusing on the annual pattern of rainfall, Mini et al. (2016), discovered a considerable increase in monthly rainfall during February, March, October, and November, whereas a decrease in the monthly rainfall contribution of June and July. They also found a large increase in monthly rainfall during February, March, October, and November, as well as a drop in monthly rainfall contribution during June and July. In January, July, and the Winter season, there was a strong decrease in rainfall whereas in August and September, however, there was an increasing trend (Saini et al. 2020) over the Western Ghats. According to Qadimiet al. (2021), there is a link between ENSO (El Niño Southern Oscillation) and the Indian Summer Monsoon and he inferred that deficit rainfall during the monsoon season was linked to El Nino events, with El Nino years responsible for roughly $60\%$ of all droughts in India on the other hand La Nina years were associated with excessive rainfall over India. Because of the southeastward movement of the walker circulation anomalies, Krishna kumar et al. (1999), discovered a weakening link between monsoon rainfall and El Nino. Several regions in India have seen continuous rainfall for more than four days during the summer monsoon season. Throughout the season, the Indian Summer Monsoon is characterized by strong circulation at 850 hPa southwesterlies and 200 hPa upper-level easterly jet. According to Dash et al. (2004), a decrease in horizontal and vertical wind shear during the southwest monsoon over India slows the monsoon circulation and reduces rainfall. According to Koteswaram (1958), intrusion of weak Tropical Easterly Jet over South India, and upper tropospheric westerlies intruding over North India can cause weak ISM. Southward displacement of the Asian jet is observed to have a substantial impact on ISM rainfall (JJAS) primarily in northern and central India. Weak Tropical Easterly Jet changes the low-level ISM circulation, resulting in less rainfall over India. This continuous rain is due to cyclonic systems which occur in the Bay of Bengal and the Arabian Sea in the form of depressions and deep depressions. A considerable decline in long spells and an increase in short spells over the Indian subcontinent over the recent times indicate that the monsoon system may be weakening (Dash et al. 2009). Apart from observational studies, coupled climate modeling studies have indicated changes in rainfall pattern and intensities in the coming future. Anthropogenic emissions and land use land cover changes can have drastic impacts on the future climate and meteorological conditions of a particular region. Further, adverse rainfall scarcities and enhanced extreme weather events may be faced under the RCP 4.5 and 8.5 scenarios in the Indian subcontinent and its adjoining regions (Salunke et al., 2019; Jain et al., 2019). In terms of the trend, having an appropriate statistical significance ensures confidence in the occurrence of a particular event. Analyzing the past trends of rainfall over longer periods can have a very significant impact on the forecasting of rainfall. Combining the past trends and future climatic scenarios can help in the adaptation and mitigation strategies for the upcoming future. The principal motivation for this study comes from the scale of the dependent population on the summer monsoon rainfall over India. With such a large population dependent directly on rainfall over 4 months, it is indeed very important to study the recent trend in monsoon rainfall. Along with it, climate model projections predict a 5 percent to $15\%$ rise in total summer monsoon rainfall across India, according to the IPCC's fifth assessment report (Sharmila et al., 2015). This rise may be credited to the warmer Indian Ocean, which accentuates the land-ocean contrast and so increases the amount of moisture carried to India (Yadav., 2019). Along with it, a rise in temperature due to enhanced greenhouse gas emissions may alter the monsoon circulation and in turn, lead to changes in rainfall patterns and intensities.
Many non-parametric tests for trend analysis are available and are employed in hydrological investigations and they found it quite reliable. Because of its high accuracy, repeatability, and flexibility, the non-parametric test is often used in climate change research. Many researchers have used Innovative trend analysis (ITA) in their work, (Meena et al., 2018) examined the trend of rainfall in semi-arid regions of western Rajasthan. Caloiero et al.(2018) also used Mann-Kendall's Test (MKT) and ITA to analyze the trend of over 500 rain gauge stations in Italy over 50 years. (Wang et al., 2020) employed the ITA approach to determine the precipitation trend in eastern China, and the results were consistent with traditional methods. According to the literature survey, there has been limited research on the long-term rainfall pattern over India and the homogeneous region using a combination of MKT and ITA. The ITA test is used in conjunction with the MKT test to describe the precision of the results obtained.
## II. DATA AND METHODOLOGY
### a) Data used
The IMD gridded rainfall data (Pai et al. 2014) prepared from 6955 rainfall measuring stations over the Indian main land region is used to study the past century trends in summer monsoon rainfall. The spatial resolution of the data is $0.25^{\circ} \times 0.25^{\circ}$ and the temporal extent is from 1901 to 2019 (119 years). The data is unique of its own kind as highest number of stations were used to prepare this data. The data was developed after making quality control of each rain gauge station.
### b) Methodology
To study the long-term trend, accumulated seasonal rainfall for the Post-Monsoon (OND), Pre-Monsoon (MAM), South West monsoon (JJAS), and Annual rainfall each year is statistically analyzed in this study. According to various research, India as a whole does not display a particular pattern for ISMR. As a result, the study region is divided into four rainfall homogenous regions (Figure 1) as per the classification of IMD: South India, North East India, Central India, and northwest India (Rajeevan et al., 2010).
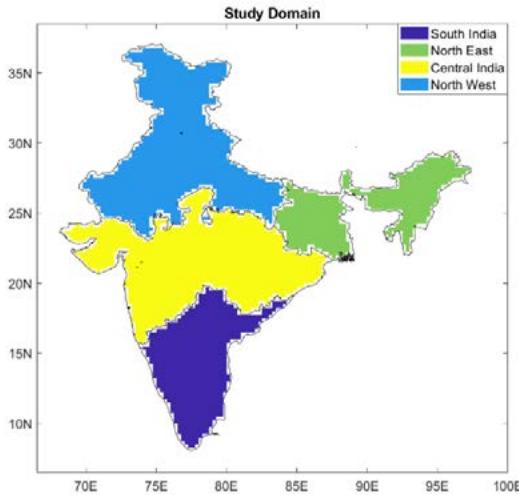 Figure 1: The four rainfall homogeneous regions of India used in this study.
Four distinct rainfall trend analysis methods used in this study are:
- The Mann Kendall test is used to extract seasons that demonstrate a significant trend with a confidence level of $90\%$.
- The discovered trend is corroborated by the results of a recently established analysis called Innovative trend analysis (ITA) (Saini et al., 2020).
- The Weibull's Recurrence Interval (Saini et al., 2020).
- Sen's Slope.
## i. Mann Kendall's test
The Mann-Kendall Test is used to determine whether a time series exhibits a monotonic rising or decreasing trend. The data does not need to be regularly linear or distributed. It does necessitate the absence of autocorrelation (Mann, 1945). The null hypothesis in this study is that there is no trend, while the alternative hypothesis is that there is an upward (or downward) trend in the one-sided test or a trend in the two-sided test. Statistical test (m) is defined as follows:
$$
m = \sum_ {i = 1} ^ {N - 1} \sum_ {j = i + 1} ^ {N} \operatorname{sign} \left(x _ {j} - x _ {i}\right) \quad - - - - - (i)
$$
It's worth noting that if $m > 0$, earlier observations in the time series tend to be lesser than those appearing later in the time series, and if $m = 0$, the opposite is true. N denotes the duration of the data series, xj and xi denote the sequential data in the series, and m's variance (v) is calculated as follows:
$$
v = \frac {1}{1 8} [ n (n - 1) (2 n + 5) ] \quad - - - - - (i i)
$$
The following test statistic is used in the MK Test:
$$
z = \left\{ \begin{array}{c c} (m - 1) / sq & m > 0 \\ 0 & m = 0 \\ (m + 1) / sq & m < 0 \end{array} \right. --- (iii)
$$
Where sq denotes the square root of the variable. If there is no monotonic trend (the null hypothesis), then $z$ has a conventional normal distribution for time series with more than 10 elements.
P value is calculated by using z score table. Lower p-values indicate that the null hypothesis is rejected, while larger p-values indicate that the null hypothesis is accepted.
In this study, significance levels $\alpha = 0.05$ was used. If the p-value of a test is less than alpha, the test rejects the null hypothesis. If the p-value is greater than alpha, there is insufficient evidence to reject the null hypothesis.
## ii. Innovative Trend Analysis (ITA)
The ITA approach is commonly used to find trends in hydro-meteorological investigations. Sen (1968) invented and suggested it as it eliminates several restrictions, such as those caused by the independent structure of time series, data length, and the presence of normality in the distribution. The steps in this procedure are as follows:
a) The entire data set is split into two halves. In the event of odd data series, the initial observation is not considered.
b) Two parts of the data are arranged in ascending order on the table.
c) A scatter plot is created using the 1st half on the x-axis and the 2nd half on the y-axis.
d) Then a diagonal line is drawn that divides the plot into two halves.
e) The declining and rising trends can be visually observed by locating the scatter plot's point. The increasing (decreasing) trend in the time series is indicated by the point sitting above (below) the straight line of 45.
## iii. Sen's Slope
Sen's slope estimate methodology (Sen, 1968) is a common non-parametric way of guessing the slope of a regression line that uses the least square method to fit a pair of components in the vector $(\mathfrak{m},\mathfrak{n})$. The slope's magnitude can be computed using:
$$
\text{Sen's Slope} = \text{Median} \left\{\frac{m_j - m_i}{j - i}: i < j \right\}
$$
Where $j$ refers to the later year in the dataset in the vector $ij$, while $i$ corresponds to the earlier year. The final slope representing the magnitude of the entire vector of data is the median of all the Sen's slope values for different years.
## iv. Weibull Recurrence Interval or Return Time (T)
There are several ways of approximating the probabilities of return time, however, we have used Weibull's method to get the recurrence interval in this case. The recurrence period is calculated using the following formula:
a) Ranking the rainfall event based on the amount of seasonal rainfall, ranking highest to lowest (lowest to highest).
b) Calculation of cumulative probability. In this case, $n$ represents the total number of observations, which in this case is 119.
$$
C_{p} = \frac{\text{Rank from step 1}}{n}
$$
c) Rank Cp from highest to lowest value, resulting in m which is the exceedance/decadence probability rank, and then go to step 4 to calculate the exceedance/decadence probability.
d) Probability of exceedance/decadence calculation (p) is done by,
$$
p = \frac {m}{n + 1}
$$
e) The exceedance/decadence probability $(p)$ is used to calculate the recurrence interval (T). $T$ is the mean interval of occurrence of a rainfall event of greater than or equal to a specific magnitude.
$$
T = \frac {1}{p} = \frac {n + 1}{m}
$$
## v. Active and Break criteria for identifying the intra-seasonal rainfall variability
To determine the active and break phases, we considered two criteria. Because active and break spells of rainfall are one of the monsoon's most distinctive characteristics, we feel a useful index should be derived from it for this study. We recognize that rainfall in India is heterogeneous, which may influence our index, so we concentrate on a rainfall-based index for central India. To build our index, we applied (Rajeevan et al. 2006, 2007) as one of the methods for identifying the active and break spells from the IMD gridded dataset.
First method is computed based on the daily rainfall and its climatological time series on a daily basis were calculated by computing area-averaged rainfall over central India during monsoon over the period of 1901-2019 at each grid point. The standardized rainfall anomaly is chosen when the standardized rainfall anomaly was above (below) $+1$ (-1) for at least three consecutive days.
Active (break) days were calculated for each day. Then the inter-annual standard deviation of rainfall is divided by the daily rainfall time series after subtracting the climatology. Figure 2 shows an illustration of the methodology followed for identifying the active and break phases during the monsoon season of 1987. Similar methodology is followed for all the monsoon seasons.
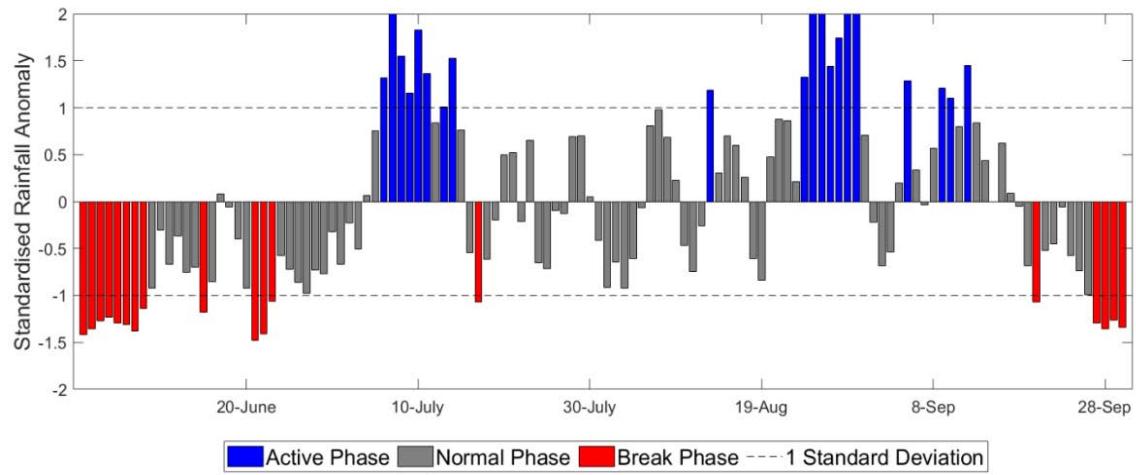 Figure 2: Normalized rainfall anomaly over India for the monsoon season of 1987. The blue and red colour bars show the active and break days, respectively.
Second method is followed by the specifications of IMD for classifying the active and breaks phases where, rainfall should be $1_{2}^{1}$ times normal to be considered an active phase. Over the region of study, it should rain continuously for at least four days. Rainfall should be less than $\frac{1}{2}$ of usual to be considered a break phase and there should not be any rain beyond the prescribed value continuously for at least four days. The active and break periods are defined as days when the amount of rainfall is more (less) than $1_{2}^{1}(\frac{1}{2})$ respectively, and this condition should last for at least four days over the region of study.
## III. RESULTS AND DISCUSSIONS
This section describes the important findings from the trend analysis of the past century rainfall. Preliminary analysis is carried out using Mann-Kendall's test and Sen's slope estimator. Only those trends found significant are analyzed further using other methods. The results have been divided into two sections where the first section analyzes the rainfall trends during different seasons whereas the second section focuses on the summer monsoon season specifically.
### a) Annual and seasonal analysis
Evolution of seasonal and annual rainfall can display a brief idea on the trend in rainfall. Figure 2 shows the time series of the annual and seasonal rainfall over Indian main land region and figure 3 for the four homogenous regions considered in this study. The time series of accumulated precipitation over all India shows an increasing trend in both annual and monsoon rainfall, with slopes of 0.27 and 0.56 respectively. Also, it can be seen that most of contribution to annual rainfall comes from the summer monsoon season. The pre and post monsoon seasons show very less amount of rainfall which typically ranges between 100-200mm per season. The summer monsoon rainfall ranges between 600-800mm with some seasons receiving as high as 950mm rainfall. Similarly, some seasons receive less than 600mm rainfall. This implies the large spread of the monsoon rainfall as well as its variability. The annual rainfall closely flows the pattern of the monsoon rainfall for which the rainfall during the June-September is considered so important for the Indian sub-continent. The annual rainfall ranges between 1000-1200mm which is an accumulation of all the seasons. Considering the rainfall over the past century, the trend line shows an upward slope which suggests the net rainfall has been increasing.
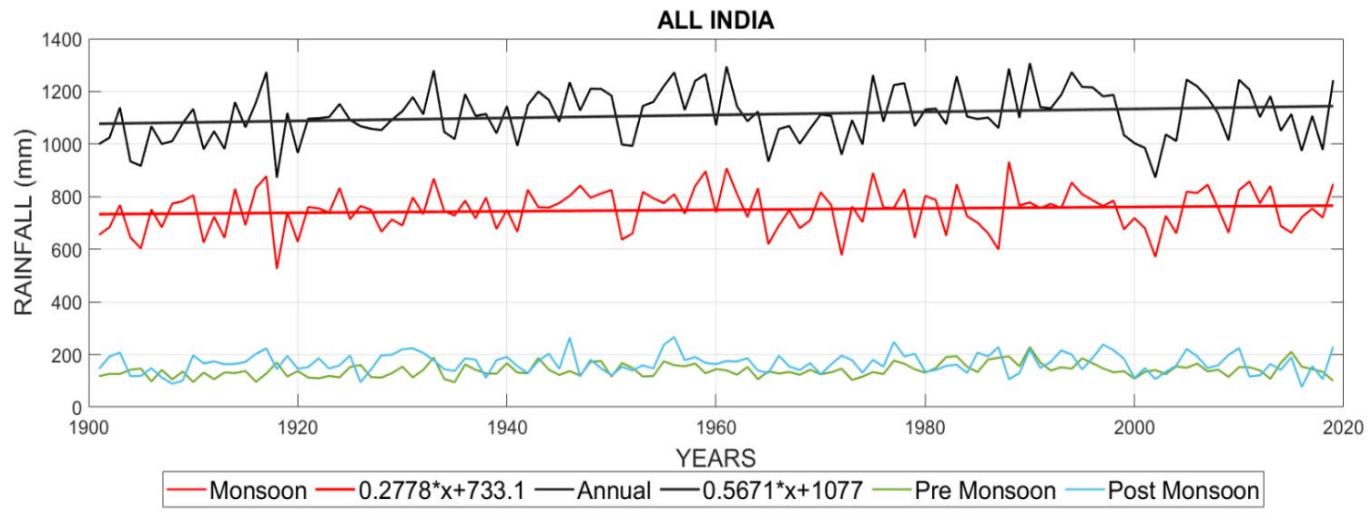 Figure 3: Rainfall trends and time series over the Indian main land region for the summer monsoon (Red line), premonsoon (Green line), post-monsoon (Blue line) seasons and annual rainfall (Black line) for the study period of 1901-2019.
Figure 4 shows the similar trend lines as that of Figure 3 but for the four rainfall homogenous regions. Southern India shows distinct pattern from the rest of the three regions where the monsoon rainfall and postmonsoon rainfall have significant contribution to the annual rainfall. The north east or winter monsoon brings significant rainfall over the peninsular India which can be clearly seen from the purple line. The north east India, central and north west India has similar properties to that of the all India rainfall. Most of the contribution of annual rainfall in these three regions comes from the summer monsoon rainfall. On analyzing the rainfall trends, the rainfall shows a strong increasing trend over the arid and dry regions of north west India where as there is a decreasing slope over the heavy rainfall regions of north east India. Over the southern and central India, the trend line is flatter as compared to the other two regions. The slope for the increase is highest
in north-western India, at 1.20. Other regions in India have slopes of 0.07 and 0.60, respectively, in the southwest and central regions. A negative slope of 0.14 is seen over the northeast. The trend over Central India and southwest India is almost flat.
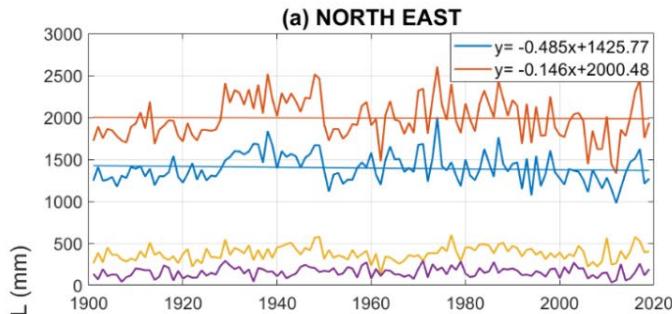
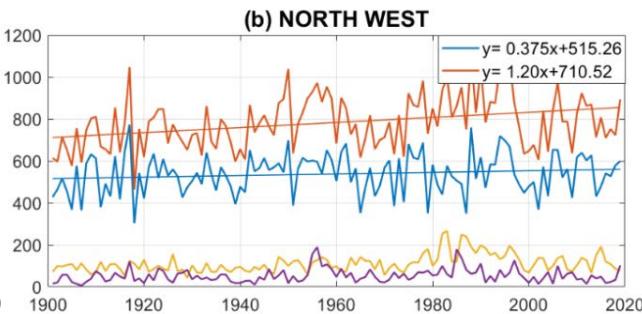
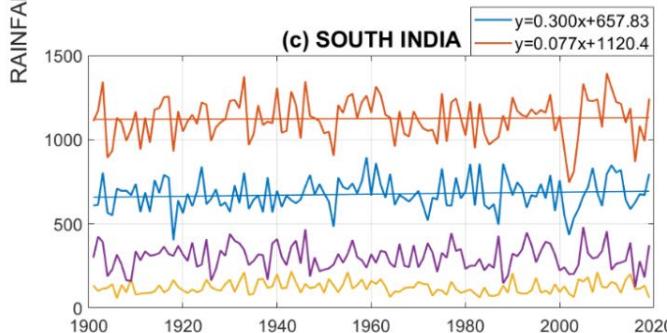
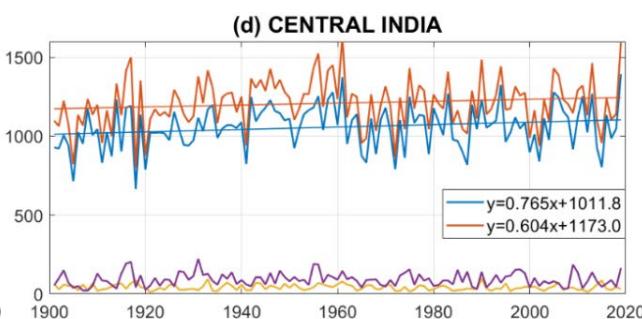 Figure 4: Similar rainfall trends and time series as
Significant increasing/decreasing trends can be identified using the MKT metric. This method gives the monotonic trend results but corrects the variance. It is widely used to identify the presence of monotonic trends of a parameter. Lower p-values and higher z-values can indicate the strength of trend. Figure 5 shows the p and z values over the regions for the annual and seasonal rainfall considered in this study over India during annual and pre-monsoon, over central India during monsoon, and over the northwest part of India during annual, post-monsoon, and pre-monsoon at a $90\%$ significance level. The annual rainfall across India and the north-western region of India displays an increasing tendency which is significant at $90\%$. The MMKT data for annual rainfall in Figure 5 reveals a positive z value for India as a whole and the north-western region of India (Dark blue boxes). The z-values are highest over the north east India with 4.32/3.73 for pre-monsoon/annual rainfall. Higher z-values are also observed for pre-monsoon/annual rainfall over India which lies at 3.56/2.25 respectively. Maximum changes in rainfall trends can be seen over the north west India as compared to other regions. The north west India is a dry and arid region and small changes in rainfall or some extreme rainfall events can create a major change in the seasonal and annual rainfall over this region. The annual rainfall over India and the pre-monsoon rainfall over India also show significant changes. Adding to the p-values, z-values from the MKT also show similar results where the changes are witnessed maximum for the North West region and all India as a whole during the pre-monsoon seasons. Minimum p-values are observed over India during pre-monsoon and annual rainfall, over northwest India for all the seasons.
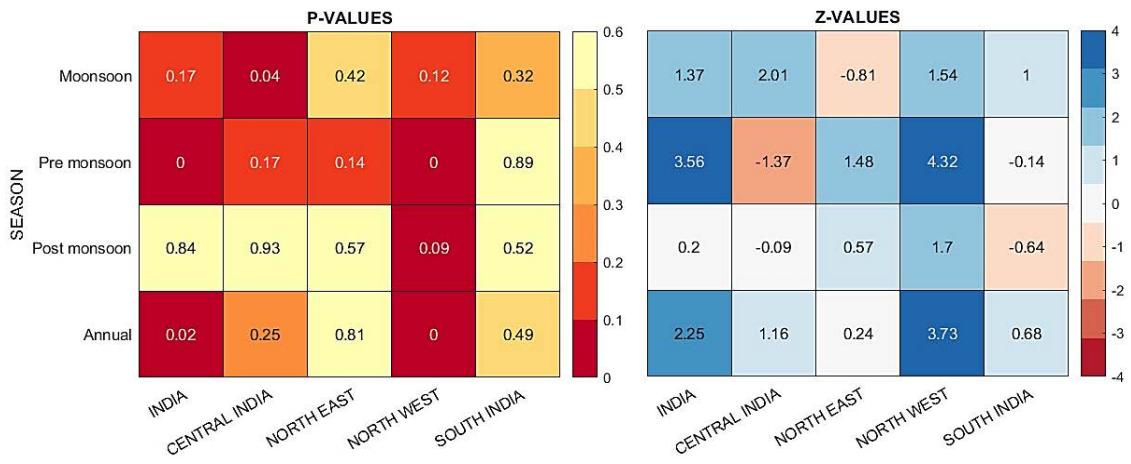 Figure 5: Obtained P and Z values from the Mann-Kendall's test for all India as well the rainfall homogenous regions of India. The values are shown at a significance level of $90\%$.
From the significant results from the trend analysis and MKT, the ITA approach is studied for the annual, monsoon and pre-monsoon rainfall over India and North West India. The ITA approach can give a brief idea whether the changes in rainfall trends happened in the recent epoch or the farther epoch. The ITA divides the entire time series into two slices thereby giving an idea on the time of change. For the annual and pre-monsoon rainfall over India most of the points lie above the diagonal and much closer to the $+10\%$ line. This suggests that the rainfall has been increasing quite significantly in the recent 50 years. Some of the points also lie at very high magnitudes which suggest that there has been an increase in the heavy rainfall events recently during the pre-monsoon season. For the monsoon season, the rainfall is quite evenly distributed along the diagonal. Drier seasons were dominant in the earlier tie whereas wetter events are dominant in the recent time for the monsoon rainfall over India. The North West India is witnessing increased rainfall during the pre-monsoon as well as the annual rainfall. The magnitude of the rise in rainfall can be quantified by the Sen's lope and the values for the whole of India is between 0.5 and $1\mathrm{mm}$ year-1, and 1 to $1.5\mathrm{mm}$ year-1, for the north-western region (Table 1). The trend in central and southwest India is also increasing with magnitudes of 0.36 and $0.16\mathrm{mm}$ year-1, respectively, however the trend's significance level is less than $90\%$ as obtained from the MKT.
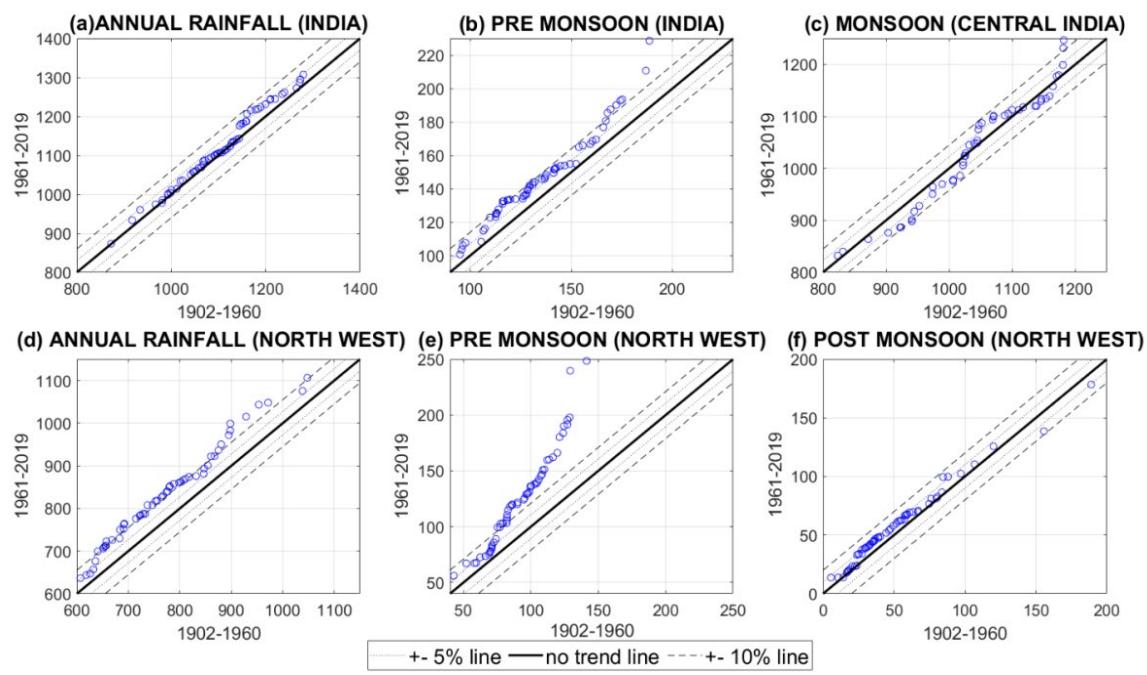 Figure 6: Innovative Trend Analysis (ITA) for (a) annual, (b) pre-monsoon, (c) monsoon, rainfall over India and (d) pre-monsoon (e) post-monsoon and (f) annual rainfall over north west India. X and Y-axis of the figure represent the rainfall (in mm) for the first and second half of the study period 1901-2019. The first half is selected as 1901-1959 and the second half is selected from 1960-2019. The regions are selected based on the Mann-Kendall's test where there is a significant increase/ decrease in trend.
The monsoon season in India is critical for the country's agrarian economy. Figure 3 depicts a decreasing slope in northeast India, whereas the rest of the country has a positive slope. With a slope of 0.76, the highest increasing slope is over Central India. The slopes of the other two regions, southwest and northwest, are 0.30 and $0.37 \mathrm{~mm}$ year-1, respectively. A negative slope of $-0.48 \mathrm{~mm}$ year-1 exists in North East India. Monsoon rainfall over central India exhibit a trend with a significance level of over $90\%$ ( $p < 0.1$ ) and a positive z value indicating an increasing trend, according to MKTT results (Figure 5). The ITA also backs up the MKTT result, which shows maximum points on the upward side of the diagonal line which clearly shows a clear rise in trend in the recent epoch. The increasing trend over central India has a magnitude of $0.70 \mathrm{~mm}$ year-1 according to Sen's slope (Table 1). All India, northwest and southwest region exhibit an increase in the trend with magnitudes of 0.23, 0.36, and $0.19 \mathrm{~mm}$ year-1, respectively. The north east region of India shows a falling trend with a magnitude of $-0.35 \mathrm{~mm}$ year-1, but according to the p values the significance level is not $90\%$.
Table 1: The Sen's slope showing magnitude. Slope significant at $90\%$ level are in bold.
<table><tr><td colspan="6">Sen's Slope (mm/year)</td></tr><tr><td>Seasons</td><td>India</td><td>Central India</td><td>North East</td><td>North West</td><td>South India</td></tr><tr><td>Monsoon</td><td>0.23</td><td>0.70</td><td>-0.35</td><td>0.36</td><td>0.19</td></tr><tr><td>Pre Monsoon</td><td>0.23</td><td>-0.06</td><td>0.30</td><td>0.42</td><td>0.00</td></tr><tr><td>Post Monsoon</td><td>0.00</td><td>-0.02</td><td>0.06</td><td>0.10</td><td>-0.13</td></tr><tr><td>Annual</td><td>0.54</td><td>0.36</td><td>0.01</td><td>1.18</td><td>0.16</td></tr></table>
The MKT for the pre-monsoon period shows a clear pattern over India as well as in the northwest part of India at a significance level of more than $90\%$ (Fige 3.1). Corresponding $z$ values show a positive trend across India, including the northwest. The ITA (Figure 6 (b), (e)) supports the MKTT result since the maximum points in both scatter plots are on the upward side of the diagonal suggesting a rise in trend in the recent epoch. The trend in India and north-western India is growing at 0.23 and $0.42 \mathrm{~mm}$ year-1, respectively. The Sen's slope also reveals a decline in the magnitude of pre-monsoon rainfall in India's northeast, although this was found with a $70\%$ significance level.
During the post-monsoon (OND) season, a significant trend was observed in the north western part of India, with a significance level of $90\%$ (Figure 5). A positive Z value indicates a positive trend. According to the ITA results (Figure 3.3), the trend in the recent epoch is positive as the scatter points are on the upward side of the diagonal. The magnitude of the slope in Table 3.2 suggests that post-monsoon rainfall in India's northwest area is increasing at a rate of $0.10 \mathrm{~mm}$ year-1. It also reveals a decrease in trend over south west is not significant at $90\%$.
### b) Monsoon rainfall analysis
## i. Standardized anomaly index
For determining the anomaly indices during the peak rainfall seasons i.e. the summer monsoon months, the rainfall over India and the Central India region was chosen for an extensive examination of intra-seasonal summer monsoon rainfall in this study. The central India region is often considered as the monsoon core region since the rainfall over this region influences a large population and the economies associated with it. Furthermore, significant rivers such as the Ganga, Mahanadi, and Narmada flow through these plains, and changes in rainfall patterns would affect the water flowing through these rivers, affecting people who live along their banks, farmers, and tertiary sectors of economy. To understand the long term as well epochal trends in rainfall, the anomaly index time series has been divided into slices of 30 years. Figure 7 depicts the normalized anomaly index in blue. The trend over India increased in the first half of the twentieth century (1901-1960) but then began to fall in the second half (1961-2019), as shown in Figure 7 (a). The century trend of monsoon rainfall over India shows an increasing trend. The time period between 1930-1960 had more number of excess rainfall years, especially to the late 50s which may be a reason for the increasing trends in rainfall during the second epoch. During the recent years, the rainfall variability has increased with more number of extreme years. This can be evident from the increased spikes towards the $+2$ and $-2$ anomaly levels between the years 1970-2010. Over central India, the rainfall trend increased for the first 30 years (1901-1930), but then had flat or decreasing trend lines after 1930 (Figure 7 b).
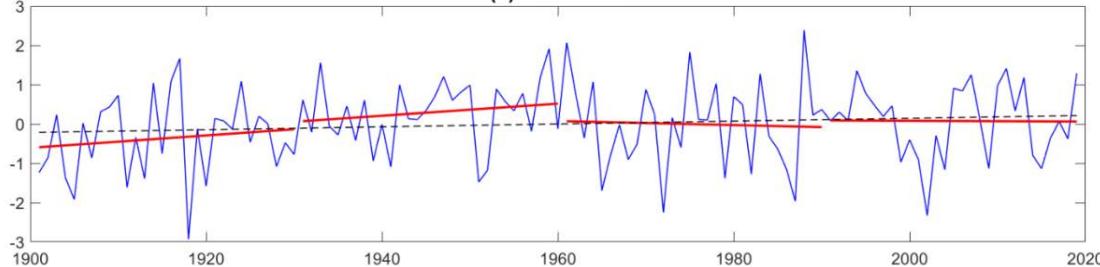 (a) ALL INDIA
 (b) CENTRAL INDIA Figure 7: Normalized rainfall anomaly index time series for (a) All India and (b) Central India (blue line) over the 119 monsoon seasons of study. The 119-year rainfall trend is shown in dashed black line whereas the red line is the 30-year trend.
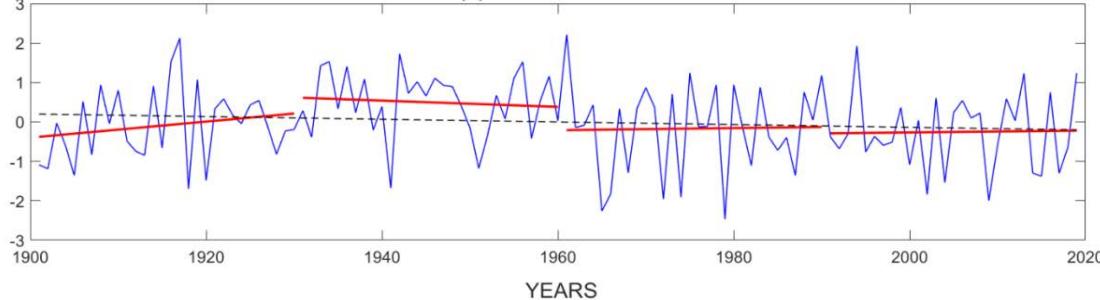
Figure 8 depicts the normal, deficit, and excess years for all India and central India, as well as the 11-year and 30-year running means. Figure 8(a) shows that the number of extreme rainfall years were quite during 1901-1920 which then reduced in number till 1960. Between the years 1920-1960 there were only 6 extreme rainfall events. The extreme rainfall events then took a rise during the recent epoch where there were as many as 16 extreme rainfall monsoon seasons between 1980-2019. Excess rainfall events in India have grown in the second half of the twentieth century (1961-2019) compared to the first half. The height of the bars has also increased, indicating that the intensity of the excess/deficit rainfall has increased. The 30-year moving average lies along the line of zero anomaly which infers that the mean climatological rainfall is quite constant over a 30-year period. But considering the 11-year running mean, there are certain spikes and the number of spikes have increased form 1960 onwards. There have been spikes on both sides of the anomaly index which clearly indicates that there have been more number of extreme rainfall years after 1960. There have been both deficit and excess years in the recent epoch but the intensity of the deficit monsoon seasons are quite robust than the excess monsoon seasons.
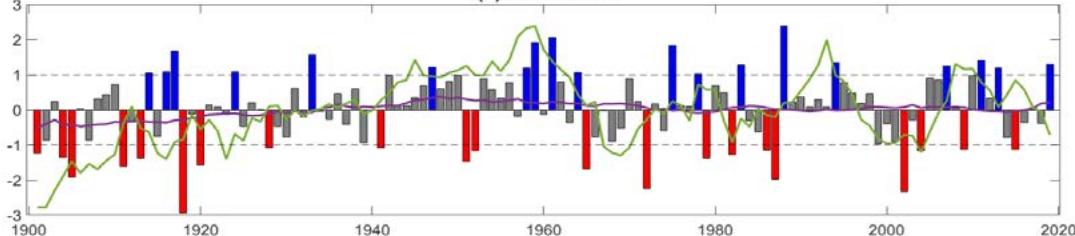 (a) ALL INDIA (b) CENTRAL INDIA
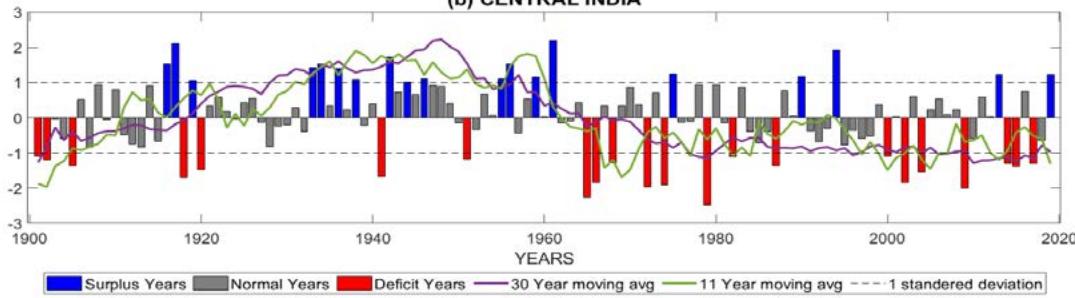 Figure 8: The normalized rainfall anomaly index for (a) All India and (b) Central India with 11-year and 30 year running mean (Green and Purple lines). The blue bar represents the excess year, the red bars represents is deficit years, and grey bars represent normal years.
The normalized anomaly index for central India is shown in Figure 8 (b). In comparison to the top panel, the variability of rainfall over central India is much intense than the all India rainfall. There have been more number of deficit years in the second half whereas there were more number of excess years in the first half. The central India region is thus quite vulnerable as well as quite sensitive to the extreme rainfall during the monsoon season. The 30-year running mean clarifies the variability of rainfall where the mean line was on the positive side in the first half which moved downwards and crossed the centre line during mid-60s, the number of deficit years have increased in the recent times which is a matter of concern since the central India region is quite susceptible to the monsoon rainfall and a large number of population is directly dependent on the rainfall received during the monsoon season. The severity in the increased drought years may be an alarm for the upcoming future for this region.
## ii. Recurrence Interval
Occurrences of extreme rainfall have been a matter of concern in various parts of the world due to their severe environmental impact. As a result, it has been extensively researched to discover severe events and their probable occurrence in various places. While the current study's trend results indicate the presence of a positive (negative) trend. From 1901 to 2019, we used an SD-based scheme to estimate the occurrence of extreme years, with 1.5 SD (+1.5 SD) denoting excess/flood and -1.5 SD denoting deficit. The excess years are shown by the blue line, while the deficit years are represented by the red line (Figure 9). The recurrence interval (RI) shows the return time of any extreme event with similar intensity. The flood event that occurred over India during the monsoon time in 1961 tends to repeat with similar intensity in nearly 60 years. On average excess as well as deficit event for India's monsoon season is 35 years, which means India can see a deficit of excess rainfall every 35 years approximately. When compared to the first half the data (1901 - 1961), the blue spikes are rising in height for both annual and monsoon precipitation, resulting in a rise in both number and intensity. The increase in the intensity and frequency of drought conditions over India is also indicated by the recurrence interval for deficit years, it is clear that the spikes have increased in the second half (1961-2019).
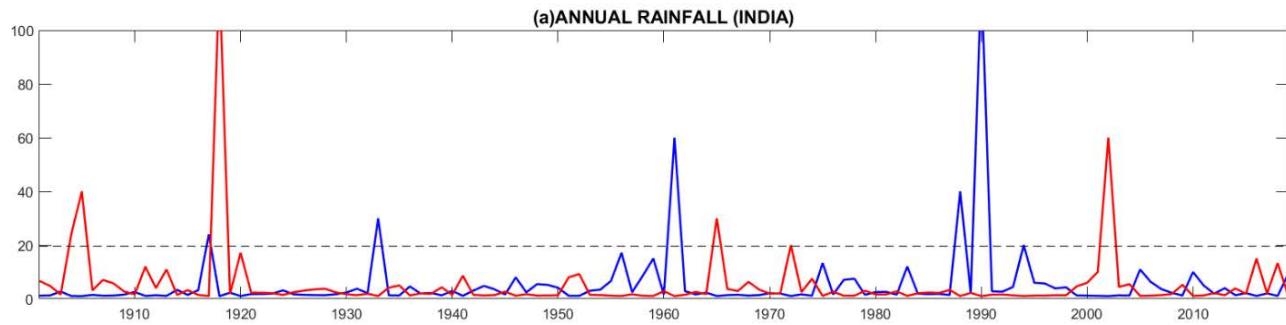 Figure 3 but for the homogenous rainfall regions of north east, north west, south and central India.
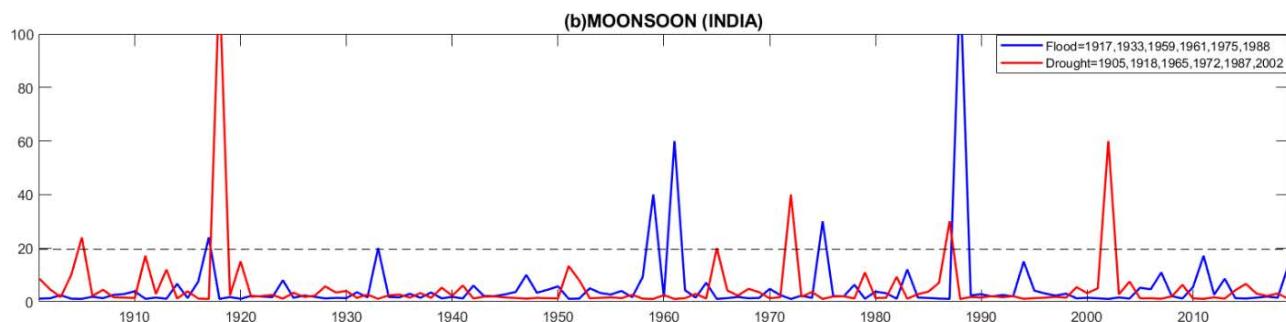 Figure 9: Weibull's recurrence interval period and trends of the excess (+1.5 SD) and (-1.5 SD) rainfall events over the study period for (a) annual and (b) monsoon rainfall. The Blue lines indicate the flood events whereas the red lines depict the intervals of drought events. The dashed lines mark the limit of 1.5SD.
## iii. Intra-seasonal variability
Figure 10 illustrates the number of active and break days in relation to the average rainfall over India and Central India. Both the methods discussed in section 2.2.5 were used to calculate the total number of active and break days and both the methods showed similar results. The red/black lines represent the total number of active/break days respectively, whereas the grey bars represent the mean seasonal rainfall in mm.day $^{-1}$. Considering the rainfall over India, the number of active and break days are quite balanced as both the black and red lines lie closely on the chart. Over central India, the number of break days is quite higher than the number of active days for almost all the monsoon seasons. As the spikes get higher in the second half after 1960, we can detect a rise in the frequency of the break phase over central India. This increase in the break phase supports figure 10 (b) result, which shows that deficit years are becoming more frequent and intense. The number of active/break days for all India is similar as the low rainfall regions of
north west India and high rainfall areas such as the hilly regions of India might be balancing each other when considered as a whole. The increase in the frequency as well as the number of break days over central India may be a concern for the large scale agricultural and other economic activities associated over this particular region.
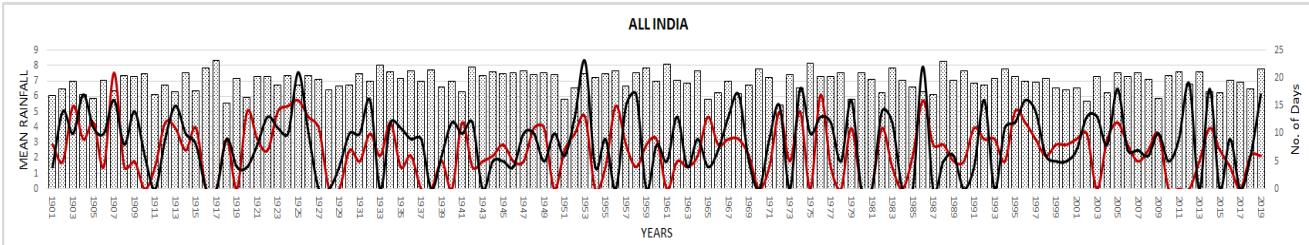
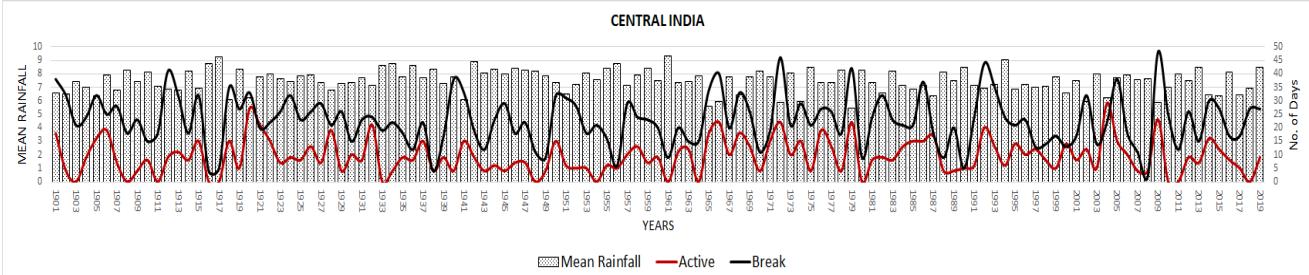 Figure 10: Total number of active (black line) and break (red line) days during the monsoon season over all (a) India and (b) central India along with the seasonal monsoon rainfall (grey histograms) over the respective regions.
## IV. CONCLUSION
This study is aimed at the understating the recent rainfall trends in India from 1901 to 2019 for different seasons and summer monsoon season in particular. Time series analysis and various nonparametric trend analysis scores are used to understand significant trends. The monsoonal rainfall over India as a whole was found to possess positive trend but the variability in seasonal rainfall was observed to be more in the recent 2-3 decades. This infers that the number of extreme rainfall years increased in the recent past. Over the north eastern India which is generally considered as a heavy rainfall region showed a decreasing trend with more number of extreme rainfall years in the recent past. Over the southern India and the central India, the trend in rainfall over the past century was found to be flat and the mean rainfall remained constant over the past century. The MKT was used as a preliminary trend analyzer for obtaining the monotonic trend values at a significance level of $90\%$. Three regions were found significant as the z-values were higher and the corresponding p-values were less the 0.1. The premonsoon rainfall over India and the pre-monsoon and annual rainfall over north west India were found to show strong positive trend as per the MKT. The collected results from the MKT were then put to the test using an innovative trend analysis (ITA) method that has some advantages in terms of graphical representation of data.
The regions which showed significant trends were studied using the ITA to verify if the changes in rainfall trends have occurred during the recent times or earlier times. Over India and north west India, most of the excess rainfall years lied above the diagonal line which infers that the rainfall has been increasing in the latter half of the century i.e. post-1960. However, over central India, there were been mixed results of increase/ decrease in rainfall as there were more drought years in the earlier epoch whereas there were more excess years in the recent epoch.
Focusing on the trends in monsoon rainfall over India and central India, the trend lines were positive/ negative over India/central India when studied for the entire 119 years. Central India showed a decreasing trend which may adversely affect a large number of population as large scale agricultural activities as well as important river systems are home to this region. On dividing the entire time series into 30 years slices, it was observed that the rainfall showed a sharp increasing trend from 1901-1950 after which the 30-year trend lines showed a significant decreasing trend. Over the recent 30-year i.e. 1990-2020, the rainfall trend was relatively flatter which infers that the monsoon rainfall and its variability is quite significant on multi-decadal time scales. Another alarming fact from the time series is that there were more number of sharp spikes in the recent 30-40 years with more number of excess/drought anomalous years. The number of spikes were more and quite strong for the central India region with more number of drought years in particular. There has been an increase in the intensity and frequency of deficit years after 1960 over central India in particular. Though there is not much change in the mean seasonal monsoon rainfall over the recent epoch, there has been a drastic increase in the monsoon variability in the form of increases total number of break days. Flood years have been complimented by a greater number of active days where as normal as well as drought years are accompanied by more number of break days. This may pose a challenge for the next epoch for the agricultural sector as well as the sectors involved with the hydrology during the monsoon season.
### ACKNOWLEDGEMENT
The authors acknowledge IMD for providing the daily gridded rainfall data over a timescale of 119 years. The second author acknowledges UGC for providing financial assistance in carrying out this research.
Generating HTML Viewer...
References
48 Cites in Article
S Río,L Herrero,R Fraile,A Penas (2011). Spatial distribution of recent rainfall trends in Spain (1961-2006).
B Sarojini,P Stott,E Black,D Polson (2012). Fingerprints of changes in annual and seasonal precipitation from CMIP5 models over land and ocean.
Tommaso Caloiero,Paola Caloiero,Francesco Frustaci (2018). Long‐term precipitation trend analysis in Europe and in the Mediterranean basin.
S Dash,M Kulkarni,U Mohanty,K Prasad (2009). Changes in the characteristics of rain events in India.
S Dash,J Kumar,M Shekhar (2004). On the decreasing frequency of monsoon depressions over the Indian region.
Daniel Dourte,Sanjay Shukla,Piara Singh,Dorota Haman (2013). Rainfall Intensity-Duration-Frequency Relationships for Andhra Pradesh, India: Changing Rainfall Patterns and Implications for Runoff and Groundwater Recharge.
Anmin Duan,Meirong Wang,Yonghui Lei,Yangfan Cui (2013). Trends in Summer Rainfall over China Associated with the Tibetan Plateau Sensible Heat Source during 1980–2008.
S Gadgil,P Joseph (2003). On breaks of the Indian monsoon.
X Gao,Y Shi,R Song,F Giorgi,Y Wang,D Zhang (2008). Reduction of future monsoon precipitation over China: comparison between a high resolution RCM simulation and the driving GCM.
Pavel Groisman,David Easterling (1994). Variability and Trends of Total Precipitation and Snowfall over the United States and Canada.
P Guhathakurta,M Rajeevan,D Sikka,A Tyagi (2015). Observed changes in southwest monsoon rainfall over India during 1901-2011.
G Hegerl,E Black,R Allan,W Ingram,D Polson,K Trenberth,. Zhang,X (2015). Challenges in quantifying changes in the global water cycle.
S Herath,U Ratnayake (2004). Monitoring rainfall trends to predict adverse impacts-a case study from Sri Lanka (1964-1993).
Shipra Jain,Popat Salunke,Saroj Mishra,Sandeep Sahany (2019). Performance of CMIP5 models in the simulation of Indian summer monsoon.
Liya Jin,Birgit Schneider,Wonsun Park,Mojib Latif,Vyacheslav Khon,Xiaojian Zhang (2014). The spatial–temporal patterns of Asian summer monsoon precipitation in response to Holocene insolation change: a model-data synthesis.
P Koteswaram (1958). The Easterly Jet Stream in the Tropics.
V Krishnamurthy,J Kinter (2003). The Indian monsoon and its relation to global climate variability.
K Kumar,Balaji Rajagopalan,Mark Cane (1999). On the Weakening Relationship Between the Indian Monsoon and ENSO.
K Kumar,M Rajeevan,D Pai,A Srivastava,B Preethi (2013). On the observed variability of monsoon droughts over India.
Vijay Kumar,Sharad Jain,Yatveer Singh (2010). Analysis of long-term rainfall trends in India.
J Kuttippurath,S Murasingh,P Stott,B Sarojini,Madan Jha,P Kumar,P Nair,H Varikoden,S Raj,P Francis,P Pandey (2021). Observed rainfall changes in the past century (1901–2019) over the wettest place on Earth.
Jelena Luković,Branislav Bajat,Dragan Blagojević,Milan Kilibarda (2014). Spatial pattern of recent rainfall trends in Serbia (1961–2009).
P Maharana,R Agnihotri,A Dimri (2021). Changing Indian monsoon rainfall patterns under the recent warming period 2001–2018.
Henry Mann (1945). Nonparametric Tests Against Trend.
Kate Marvel,Céline Bonfils (2013). Identifying external influences on global precipitation.
Olaniya Mayowa,Sahar Pour,Shamsuddin Shahid,Morteza Mohsenipour,Sobri Harun,Arien Heryansyah,Tarmizi Ismail (2015). Trends in rainfall and rainfall-related extremes in the east coast of peninsular Malaysia.
Hari Meena,Deepesh Machiwal,Priyabrata Santra,Pratap Moharana,D Singh (2018). Trends and homogeneity of monthly, seasonal, and annual rainfall over arid region of Rajasthan, India.
U Mohanty,P Sinha,M Mohanty,R Maurya,M Rao (2019). A review on the monthly and seasonal forecast of the Indian summer monsoon.
D Pai,M Rajeevan,O Sreejith,B Mukhopadhyay,N Satbha (2014). Development of a new high spatial resolution (0.25× 0.25) long period (1901-2010) daily gridded rainfall data set over India and its comparison with existing data sets over.
Dileep Panda,A Kumar (2014). The changing characteristics of monsoon rainfall in India during 1971-2005 and links with large scale circulation.
B Parthasarathy (1984). Interannual and long-term variability of Indian summer monsoon rainfall.
Morteza Qadimi,Omid Alizadeh,Parviz Irannejad (2021). Impacts of the El Niño-Southern Oscillation on the strength and duration of the Indian summer monsoon.
P Raj,P Azeez (2010). Changing rainfall in the Palakkad plains of South India.
M Rajeevan,Sulochana Gadgil,Jyoti Bhate (2006). Active and break spells of the Indian summer monsoon.
M Rajeevan,D Pai,R Anil Kumar,B Lal (2007). New statistical models for long-range forecasting of southwest monsoon rainfall over India.
M Rajeevan,Sulochana Gadgil,Jyoti Bhate (2010). Active and break spells of the Indian summer monsoon.
Atul Saini,Netrananda Sahu,Pankaj Kumar,Sridhara Nayak,Weili Duan,Ram Avtar,Swadhin Behera (1225). Advanced Rainfall Trend Analysis of 117 Years over West Coast Plain and Hill Agro-Climatic Region of India.
S Salma,S Rehman,M Shah (2012). Rainfall trends in different climate zones of Pakistan.
Pranab Sen (1968). Estimates of the Regression Coefficient Based on Kendall's Tau.
S Shahid (2011). Trends in extreme rainfall events of Bangladesh.
S Sharmila,S Joseph,A Sahai,S Abhilash,R Chattopadhyay (2015). Future projection of Indian summer monsoon variability under climate change scenario: An assessment from CMIP5 climate models.
O Singh,M Kumar (2013). Flood events, fatalities and damages in India from 1978 to 2006.
Hossein Tabari (2020). Climate change impact on flood and extreme precipitation increases with water availability.
Andréa Taschetto,Matthew England (2009). An analysis of late twentieth century trends in Australian rainfall.
V Mini,V Pushpa,K Manoj,* (2016). INTER ANNUAL VARIABILITY OF ONSET DATES OF SOUTH WEST MONSOON OVER KERALA DURING 1975-2013.
Yuefeng Wang,Youpeng Xu,Hossein Tabari,Jie Wang,Qiang Wang,Song Song,Zunle Hu (2020). Innovative trend analysis of annual and seasonal rainfall in the Yangtze River Delta, eastern China.
P Webster,V Magaña,T Palmer,J Shukla,R Tomas,M Yanai,T Yasunari (1998). Monsoons: Processes, predictability, and the prospects for prediction.
Ramesh Yadav,Mathew Roxy (2019). On the relationship between north India summer monsoon rainfall and east equatorial Indian Ocean warming.
No ethics committee approval was required for this article type.
Data Availability
Not applicable for this article.
How to Cite This Article
Manas Ranjan Mohanty. 2026. \u201cComprehensive Trend Analysis of Past Century Indian Summer Monsoon Rainfall and its Variability\u201d. Global Journal of Human-Social Science - B: Geography, Environmental Science & Disaster Management GJHSS-B Volume 23 (GJHSS Volume 23 Issue B1): .
Explore published articles in an immersive Augmented Reality environment. Our platform converts research papers into interactive 3D books, allowing readers to view and interact with content using AR and VR compatible devices.
Your published article is automatically converted into a realistic 3D book. Flip through pages and read research papers in a more engaging and interactive format.
Our website is actively being updated, and changes may occur frequently. Please clear your browser cache if needed. For feedback or error reporting, please email [email protected]
Thank you for connecting with us. We will respond to you shortly.