## I. INTRODUCTION
### a) A Growing, Clean Economy
Canada is currently competing globally for its share in a low carbon economy [1]. According to the Government of Canada vision, the country must capitalize on Canada's competitive advantages, including critical resources needed by the world, and the country's skilled and diverse workforce. Canada is bringing solutions for and "business bridges" between highest-quality manufacturing at home and exporting leading products and services globally.
To successfully grow the economy while averting the worst impacts of climate change, the Government of Canada is committed to meeting an ambitious climate target of $40 - 45\%$ emissions reductions by 2030 and achieving net-zero emissions (where our economy either emits no greenhouse gas emissions or offsets its emissions) by 2050 [2].
### b) Total Electrification Targets and Steps
Electricity is becoming the key fuel for low carbon economy activities in Canada. Today the country is committed to total electrification. By fully decarbonizing Canada's electricity grids by 2035, our country is enabling the rest of the economy to electrify by 2050 [3].
According to the 2023 federal budget, Canada's electricity demand is expected to double by 2050. To meet this increased demand with a sustainable, secure, and affordable grid, the country's electricity capacity must increase by 2.2 to 3.4 times compared to current levels. To achieve both objectives, the Government of Canada is committed to ensuring that an emissions-free grid ("Clean Grid") target has been achieved by 2035 [4]. These commitments expect phaseout of coal generation in 2030, clean grid deployment, with last sales of new internal combustion engine vehicles in 2035, and net-zero total emissions in 2050 [2].
### c) Energy Transition means Dispatchable Renewables
Ensuring the increasing penetration of renewable power into the energy supply mix, towards total electrification, is very often referred to as an "energy transition" [5]. Moving from fossil fuel-based to clean electricity-based electricity sources and scaling the growth of clean electricity changed the role of renewables from historically "secondary" to today's "primary" in building Canada's low carbon economy.
This means that all clean electricity generation fleets on the grid, including variable renewables such as wind or solar, should be made dispatchable by keeping necessary clean dispatchability reserves.
Dispatchable renewables in Canada are presented by large reservoir-based hydro power strongly established in the country. Hydro power generating stations have been for many years contributing to electricity use at home as well as to
exporting electricity as a valuable product. This includes hydro power in Newfoundland and Labrador, Quebec, Manitoba, and British Columbia [6-10].
Dispatchable renewables opportunities in Canada are also presented by geothermal resources. Enhanced Geothermal Systems for power generation based on deep geothermal resources can provide power generation as well as clean dispatchability reserves. Geothermal power is economically attractive in energy transition process [11-14] that is seen as a longer-term objective in Canada. The high capacity factor of geothermal power makes it particularly attractive as a renewable resource for highly dispatchable electricity generation. Geothermal resources with high $(>150^{\circ}\mathrm{C})$ temperatures allow very high potential for electrical generation in regions of northeastern and southern Yukon, northern Alberta, and southern Northwest Territories.
Using hydro and geothermal power sources and clean dispatchability resources for variable renewables allows for integrating dispatchable renewable fleets to address the Clean Grid goals in Canada in mid- and long-term.
### d) Realizing Electric Federalism
Achieving net zero goals in Canada through energy transition requires an approach often referred to as electric federalism [15]. In the Canadian federation, electric federalism presents coherent policy actions from federal, provincial, and territorial governments focused on upgrading and aligning all electricity systems in Canada to meet net zero in a timely manner.
Currently, electricity In Canada is provincially regulated, and system planning still occurs in silos, leaving no overarching entity to enact policies and changes that ensure these benefits are realized. Instead, it is voluntary on the part of provinces and territories.
The electric federalism approach is seen as a core basis for moving forward in integrating renewable dispatchable fleets through regional integration and related close collaboration. Interregional integration through strong interties will improve economic efficiency due to the technical benefits of larger, integrated power systems.
Based on the understanding of electric federalism in 2024, policy interventions from federal, provincial, and territorial governments are expected to upgrade and transform electricity systems in Canada, allowing for growing renewable dispatchable fleets. This includes considerable policy leadership from the provinces, since they control many of the key policy levers, and an important enabling and accelerating role played by the federal government [15].
### e) Investment in Dispatchable Renewables: Calling for Actions
Completing Renewable Dispatchable Fleets integration efforts and achieving Clean Grid goals and objectives within 2025-2035 time frame requires prompt and efficient investment decisions at federal and provincial levels.
The federal government can complement its policy efforts related to Renewable Dispatchable Fleets—including support for integration in the electricity sector—with financial support for clean dispatchable reserves deployment that incentivize provincial and territorial governments to exercise their policy tools. In return for coordinated provincial and territorial policy action focused on investments in Renewable Dispatchable Fleets, the federal government could offer more stable long-term funding for provincial and territorial electricity transformations [15].
As indicated in Canada's 2023 Budget, "...Given the long lead times and high upfront costs for electricity generation and transmission projects—and with our allies and partners set to invest heavily in preparing their own electrical grids for the future—Canada needs to move quickly to avoid the consequences of underinvestment" [1].
The Canada Infrastructure Bank is seen as an active partner in supporting these efforts by making investments in renewable energy, energy storage, and transmission projects. These investments may position the Canada Infrastructure Bank as the government's primary financing tool for supporting clean electricity generation, transmission, and storage projects, including for major Renewable Dispatchable Fleet Integration projects in Canada.
Overall, based on the electric federalism rooted in negotiated agreements of the federal government with provinces, as well as historical and current experiences of the provinces with power transmissions, intra-provincial interties and international interconnections, Renewable Dispatchable Fleets in Canada would provide a unique solution for the country to achieve its net zero goals and commitments "in a way that makes sense in the Canadian federation" [15].
This paper is focused on efficient and effective ways of growing Renewable Dispatchable Fleets in Canada's energy transition. It describes proposed changes in clean dispatchability reserves meeting clean generation mix and "Clean Grid 2035" objectives and commitments. Specifically, the following issues are discussed:
- Available dispatchability reserves for variable renewables planned in each of the provinces and territories by 2035;
- Review of existing Clean Dispatchability Reserves in each of the provinces;
- Review of new Renewable Dispatchable assets for each of the provinces using the experience with their existing renewable assets and geo-economical [16] resources;
- Review of an electric federalism [15] approach to potential shares of Clean Dispatchability Reserves considered by the provinces to meet the Canadian "Clean Grid 2035" commitment.
## II. MATERIALS AND METHODS
### a) Approaching Dispatchable Renewables
## i. Clean Grid Readiness Commitment
A starting point for approaching dispatchable renewables vision in Canada is closely related to clean grid as a major goal. Indeed, among the ten provinces that have been using $99.8\%$ of electricity in Canada, seven provinces, for different geo-economic reasons, historically committed to clean electricity generation, mostly based on hydro or/and uranium (even Ontario, the second largest electricity generation-wise in Canada, has only less than $7\%$ of electricity from natural gas in 2022). Only three provinces (Alberta, Saskatchewan, and Nova Scotia) have had their electricity generation heavily based on fossil fuels and are currently addressing a unique task of deploying very large scale renewable fleets within a decade to contribute to Canada's Clean Grid 2035 commitment [17].
Table 1.1 below shows "clean grid" readiness targets (in percent) for each of the Canadian provinces. These targets indicate electricity generation projections of the Canada Energy Regulator (CER). Most recent data provided by CER is analysed in its Energy Future report of 2023 (further-EF2023) [18] presenting first long-term outlook. The report presents its key findings in Current Measures, Canada NetZero, and Global NetZero scenarios (Global NetZero scenario is not discussed in this paper).
Table 1.1: Clean Grid Readiness Targets by Province
<table><tr><td rowspan="2">Electricity Generation:
Clean Grid Readiness, %</td><td colspan="2">2030</td><td colspan="2">2035</td></tr><tr><td>NetZero</td><td>Current</td><td>NetZero</td><td>Current</td></tr><tr><td>Alberta</td><td>36.6%</td><td>17.9%</td><td>95.1%</td><td>20.6%</td></tr><tr><td>British Columbia</td><td>81.0%</td><td>84.8%</td><td>96.4%</td><td>85.8%</td></tr><tr><td>Manitoba</td><td>99.8%</td><td>99.8%</td><td>99.9%</td><td>98.7%</td></tr><tr><td>New Brunswick</td><td>96.7%</td><td>98.0%</td><td>99.1%</td><td>99.1%</td></tr><tr><td>Newfoundland and Labrador</td><td>100%</td><td>100%</td><td>100%</td><td>100%</td></tr><tr><td>Northwest Territories</td><td>85.3%</td><td>95.1%</td><td>94.1%</td><td>96.7%</td></tr><tr><td>Nova Scotia</td><td>92.4%</td><td>35.2%</td><td>99.7%</td><td>39.8%</td></tr><tr><td>Nunavut</td><td>6.0%</td><td>6.1%</td><td>35.5%</td><td>39.4%</td></tr><tr><td>Ontario</td><td>87.3%</td><td>90.9%</td><td>97.6%</td><td>90.8%</td></tr><tr><td>Prince Edward Island</td><td>97.7%</td><td>98.3%</td><td>99.8%</td><td>99.6%</td></tr><tr><td>Quebec</td><td>99.2%</td><td>98.7%</td><td>99.3%</td><td>96.2%</td></tr><tr><td>Saskatchewan</td><td>52.2%</td><td>52.3%</td><td>98.3%</td><td>61.1%</td></tr><tr><td>Yukon</td><td>50.2%</td><td>54.6%</td><td>69.8%</td><td>74.2%</td></tr></table>
Shaded in Table 1.1 are the provinces of Alberta, Saskatchewan, and Nova Scotia which because of historical business development reasons require support in Clean Grid Readiness.
According for EF2023, in Canada NetZero scenario variable renewables Alberta, Saskatchewan and Nova Scotia are expected to deploy $50\%$ of wind power generation and $63.7\%$ of solar power generation in Canada. While, as a leading nation globally, Canada has committed to the clean electricity grid concept supporting a low-carbon economy and adaptation to climate change, thoughtful and strategic business and community approaches have to be supported in Alberta, Saskatchewan, and Nova Scotia to meet the federally proposed timelines.
These approaches have to keep all clean/renewable sources dispatchable, and to strengthen electricity export opportunities both in Eastern and Western Canada. Today these approaches clearly exist and are technically doable within the "clean grid 2035" time frame.
In Eastern Canada they are presented by large-scale onshore and/or offshore wind power in the Canadian part of the Atlantic Rim (e.g., off Sable Island and other related areas) that can be supported by hydro power from Newfoundland and Labrador (so called "Atlantic Axis" of power transmission).
In Western Canada they are also presented by large-scale deep geothermal power on the border of Alberta, British Columbia and Yukon in the Canadian part of the Pacific Rim overlapping the Pacific Ring of Fire. This major geothermal opportunity may be called the "Pacific Axis" of power transmission. The opportunity will not only address electricity needs in the regions, but it can also provide power dispatchability reserves much
beyond the target provinces in Western Canada. Technologies for enhanced geothermal systems have been developed and tested in Alberta and invested in globally (see [19,20]. It is expected that negotiations of the federal government with Alberta and Saskatchewan will bring this opportunity to the forefront of public policies and decision making at the federal and provincial levels.
While the EF2023 report reviewed five "What If" cases (such as wide-scale adoption of hydrogen, small modular reactor, direct air capture and carbon capture, utilization, and storage technologies maturity, and higher peak electricity demand due to electric vehicles charging) that may address uncertainties on the pathway to net-zero and possible changes in key assumptions in the report, it did not look into the ways of supporting the growth of variable renewables by available dispatchability reserves planned in each of the provinces and territories by 2035, the role of existing Clean Dispatchability Reserves in each of the provinces, including Renewable Dispatchability Reserves, and opportunities with Enhanced Geothermal systems and technologies based on Canadian geo-economical resources [16].
Although the future of energy in Canada is broader than the economic and technical factors driving the projections in EF2023, and many of these factors are beyond the scope of EF2023 analysis, some of these factors require critical attention and should be very promptly addressed as they touch very sensitive decisions of Canadian provinces and realities of electric federalism in Canada.
The following sections of this paper are dedicated to the two related factors: dispatchability of variable renewables, and enhanced geothermal systems
as a renewable dispatchable asset available for deployment and critically needed in Canada.
## ii. Data Sources and Assumptions
### a. Data Sources
For this publication the Author used the data on electricity demand, generation, capacity, interchange, and other related data for provinces in Canada provided publicly by the Canada Energy Regulator's (CER) [21]. Projections to 2050 were presented by CER in the "Canada's Energy Future 2023" (further - EF2023) report [18]. The data as of February 2024 was used.
The period for Energy Supply and Demand Projections was limited in this paper to 2023-2035 and focused on the Canadian "Clean Grid 2035" commitment.
The core data tables were limited to Canada NetZero and Current Measures scenarios presented in [18].
The core data tables included:
- End - Use Demand (petajoules)
- Electricity Generation by Primary Fuel (GWh)
- Electricity Generation by Technology (GWh)
- Electricity Capacity by Primary Fuel(MW)
- Electricity Capacity by Technology (MW)
- Electricity Interchange (GWh)
Electricity generation technology and its capacity included fossil fuel group, such as Carbon Capture, Utilization and Storage (CCUS) technology advancements that capture the greenhouse gas carbon dioxide (CO2) and utilize it or store it safely underground (this includes Coal and Coke, Natural Gas, and Oil), cleaner fuel group (Bioenergy, Bioenergy with CCUS,
In Current Measures scenario (table 1.3.1):
Coal with CCUS, Natural Gas with CCUS) and clean fuel group of technologies (Hydro, Hydrogen, Onshore Wind, Offshore Wind, Solar (Distributed), Solar (Utility scale), Uranium, Uranium SMR).
The recent CER's EF2023 report [18] does not include geothermal electricity generation, a very powerful clean primary fuel and electricity generation technology with major energy resources in Canada.
### b. Assumptions
Only existing and/or ready for deployment cleaner fuel and clean fuel technologies were used for "clean grid 2035" commitment.
Specifically, Cleaner Fuel included:
- Coal with CCUS and Natural Gas with CCUS
- Biomass with CCUS generation (conventional) biomass was not included in "clean grid 2035" analysis)
In Clean Fuel the following assumptions were made:
- No tidal and wave generation was used in 2035 or earlier.
- No geothermal generation was used in EF2023 in the 2023-2035 period; in this paper Enhanced Geothermal Systems were proposed to be used starting 2031 after 7 years (2024 to 2030) of development.
## iii. Current Vision of Clean Grid Support
Based on the Canada Energy Regulator's vision [18] of expected changes in Alberta, Saskatchewan and Nova Scotia, the situation in these three provinces defining a need for "clean grid" support to achieve the 2035 target is seen as follows:
Table 1.3.1: Electricity demand, generation, and interchange in target provinces: Current Measures
<table><tr><td rowspan="2">Current Measures
Scenario, TWh</td><td colspan="3">2025</td><td colspan="3">2030</td><td colspan="3">2035</td></tr><tr><td>Demand</td><td>Generation</td><td>Interchange</td><td>Demand</td><td>Generation</td><td>Interchange</td><td>Demand</td><td>Generation</td><td>Interchange</td></tr><tr><td>Alberta</td><td>83.83</td><td>93.01</td><td>9.18</td><td>92.17</td><td>105.74</td><td>13.57</td><td>100.55</td><td>112.39</td><td>11.84</td></tr><tr><td>Saskatchewan</td><td>27.00</td><td>26.60</td><td>-0.39</td><td>29.41</td><td>28.39</td><td>-1.01</td><td>31.68</td><td>30.77</td><td>-0.90</td></tr><tr><td>Nova Scotia</td><td>11.79</td><td>7.81</td><td>-3.98</td><td>12.92</td><td>9.53</td><td>-3.38</td><td>13.86</td><td>10.13</td><td>-3.73</td></tr></table>
and in Canada NetZero scenario (table1.3.2):
Table 1.3.2: Electricity demand, generation, and interchange in target provinces: Canada NetZero
<table><tr><td rowspan="2">Canada Net-Zero Scenario, TWh</td><td colspan="3">2025</td><td colspan="3">2030</td><td colspan="3">2035</td></tr><tr><td>Demand</td><td>Generation</td><td>Interchange and Loss</td><td>Demand</td><td>Generation</td><td>Interchange and Loss</td><td>Demand</td><td>Generation</td><td>Interchange and Loss</td></tr><tr><td>Alberta</td><td>81.61</td><td>90.39</td><td>8.77</td><td>97.15</td><td>106.78</td><td>9.63</td><td>117.17</td><td>128.49</td><td>11.32</td></tr><tr><td>Saskatchewan</td><td>26.08</td><td>25.75</td><td>-0.33</td><td>30.26</td><td>29.76</td><td>-0.50</td><td>36.41</td><td>35.38</td><td>-1.03</td></tr><tr><td>Nova Scotia</td><td>11.97</td><td>7.80</td><td>-4.17</td><td>13.70</td><td>14.10</td><td>0.40</td><td>15.52</td><td>21.66</td><td>6.15</td></tr></table>
EF2023 data for the 2025 to 2035 period including Electricity Demand, Generation, and Interchange in all Canadian provinces is summarised in Appendix A.
EF2023 electricity generation data by fuel for Alberta, Saskatchewan and Nova Scotia for NetZero and Current Measures scenarios is presented in Appendix B. Based on EF2023 data, the current vision of Canada's Clean Electricity Future presents an approach where
clean (Hydro, Onshore Wind, Offshore Wind, Solar (Distributed), Solar (Utility scale), Uranium SMR) and cleaner (e.g., Bioenergy with CCUS, Natural Gas with CCUS) fuels are planned to be used to achieve the "clean grid 2035" target in Alberta, Saskatchewan, and Nova Scotia.
In the NetZero scenario the following technology capacity for clean and cleaner fuels is expected as follows (table 1.3.3):
<table><tr><td>Alberta, Saskatchewan, and Nova Scotia - Total, MW</td><td>2025</td><td>2030</td><td>2035</td></tr><tr><td>Cleaner Fuels, MW</td><td>0</td><td>2,090</td><td>5,587</td></tr><tr><td>Cleaner Fuels, %</td><td>0%</td><td>13%</td><td>11%</td></tr><tr><td>Clean Fuels, MW</td><td>8,749</td><td>14,309</td><td>45,055</td></tr><tr><td>Clean Fuels, %</td><td>100%</td><td>87%</td><td>89%</td></tr><tr><td>Total clean/cleaner fuels, MW</td><td>8,749</td><td>16,399</td><td>50,642</td></tr><tr><td>Total clean/cleaner fuels, %</td><td>100%</td><td>100%</td><td>100%</td></tr></table>
<table><tr><td>Alberta, Saskatchewan, and Nova Scotia - Total, MW</td><td>2025</td><td>2030</td><td>2035</td></tr><tr><td>Cleaner Fuels, MW</td><td>0</td><td>2,090</td><td>5,587</td></tr><tr><td>Cleaner Fuels, %</td><td>0%</td><td>13%</td><td>11%</td></tr><tr><td>Clean Fuels, MW</td><td>8,749</td><td>14,309</td><td>45,055</td></tr><tr><td>Clean Fuels, %</td><td>100%</td><td>87%</td><td>89%</td></tr><tr><td>Total clean/cleaner fuels, MW</td><td>8,749</td><td>16,399</td><td>50,642</td></tr><tr><td>Total clean/cleaner fuels, %</td><td>100%</td><td>100%</td><td>100%</td></tr></table>
Specifically, the total of clean technology capacity in the three provinces presents the major effort in the country in NetZero scenario - see tables 1.3.4 and 1.3.5 below:
Table 1.3.4: Clean and Cleaner Fuel Capacity in Target Provinces
<table><tr><td>Canada NetZero Scenario</td><td colspan="2">Alberta</td><td colspan="2">Saskatchewan</td><td colspan="2">Nova Scotia</td></tr><tr><td rowspan="2">Technology Capacity, MW</td><td colspan="2">Deployed between</td><td colspan="2">Deployed between</td><td colspan="2">Deployed between</td></tr><tr><td>2026-2030</td><td>2031-2035</td><td>2026-2030</td><td>2031-2035</td><td>2026-2030</td><td>2031-2035</td></tr><tr><td>Solar (Distributed)</td><td>279.17</td><td>500</td><td>80</td><td>50</td><td>9</td><td>2.5</td></tr><tr><td>Solar (Utility scale)</td><td>750</td><td>11070</td><td>32</td><td>1354</td><td>0</td><td>0</td></tr><tr><td>Offshore Wind</td><td>0</td><td>0</td><td>0</td><td>0</td><td>2000</td><td>3000</td></tr><tr><td>Onshore Wind</td><td>1560</td><td>11440</td><td>850</td><td>1800</td><td>0</td><td>0</td></tr><tr><td>Natural Gas with CCUS</td><td>2090</td><td>2200</td><td>0</td><td>13.3</td><td>0</td><td>0</td></tr><tr><td>Bioenergy with CCUS</td><td>0</td><td>728</td><td>0</td><td>556</td><td>0</td><td>0</td></tr><tr><td>Uranium SMR</td><td>0</td><td>459</td><td>0</td><td>1070</td><td>0</td><td>0</td></tr></table>
Table 1.3.5: Clean and Cleaner Fuel Capacity Shares
<table><tr><td>Canada NetZero Scenario</td><td colspan="2">CANADA</td><td colspan="4">Alberta, Saskatchewan, and Nova Scotia TOTAL</td></tr><tr><td rowspan="2">Technology Capacity, MW</td><td colspan="2">Deployed between</td><td colspan="2">Deployed between</td><td colspan="2">Share, % Deployed between</td></tr><tr><td>2026-2030</td><td>2031-2035</td><td>2026-2030</td><td>2031-2035</td><td>2026-2030</td><td>2031-2035</td></tr><tr><td>Solar (Distributed)</td><td>1,237</td><td>1,329</td><td>368</td><td>553</td><td>30%</td><td>42%</td></tr><tr><td>Solar (Utility scale)</td><td>1,350</td><td>14,862</td><td>782</td><td>12,424</td><td>58%</td><td>84%</td></tr><tr><td>Offshore Wind</td><td>2,000</td><td>3,000</td><td>2,000</td><td>3,000</td><td>100%</td><td>100%</td></tr><tr><td>Onshore Wind</td><td>5,319</td><td>27,046</td><td>2,410</td><td>13,240</td><td>45%</td><td>49%</td></tr><tr><td>Natural Gas with CCUS</td><td>2,090</td><td>2,213</td><td>2,090</td><td>2,213</td><td>100%</td><td>100%</td></tr><tr><td>Bioenergy with CCUS</td><td>0</td><td>1,451</td><td>0</td><td>1,284</td><td>0%</td><td>89%</td></tr><tr><td>Uranium SMR</td><td>300</td><td>13,072</td><td>0</td><td>1,529</td><td>0%</td><td>12%</td></tr></table>
In the NetZero scenario the clean fuel effort made by Alberta, Saskatchewan, and Nova Scotia in 2035 is led by wind power (20.7 GW, 103.8 TWh) followed by solar power (14.1 GW, 21.6 TWh) and Uranium SMR (1.5 GW, 9.46 TWh).
Table 1.3.5 shows the provinces leadership in deployed capacity in Canada: $49\%$ onshore wind, $100\%$ offshore wind, $84\%$ utility-scale solar.
To address the issues related to these capacities, the review and discussion in this paper is focused on clean fuels only, presenting close to $89\%$ of the potential effort by 2035.
Variable renewables capacity data for Alberta, Saskatchewan and Nova Scotia planned by Canada Energy Regulator for 2030 and 2035 (see tables 1.3.4 and 1.3.5) is used in the following sections to define
available dispatchability reserves required and available in these target provinces.
### b) Making All Renewables Dispatchable
## i. Power Dispatchability Definition and Applications
Dispatchable sources are electricity sources that can be ramped up or down in a relatively short time - from milliseconds (e.g., grid batteries or spinning reserves) to minutes (e.g. natural gas and hydro turbines) and hours (e.g., coal, biomass, or nuclear plants), which is defined by electricity demand (load) and related operating conditions in the power grid [22,23].
Depending on the nature of dispatchable sources, they may be used for grid operations tasks such as load matching and peak matching, as well as supporting so-called "lead-in times" required by large coal or natural gas fueled electricity generators to reach full output.
This functionality of dispatchable sources may be extended to ancillary services that include active power/frequency control and reactive power/voltage control, on various timescales for maintaining grid stability and security [24].
## ii. Dispatchability of Renewables Today
Today's general understanding of the dispatchability of renewable power plants divides them into two major groups:
- Non-dispatchable: Solar photovoltaic (PV) and wind power plants
- Dispatchable: Hydroelectric, biomass, geothermal and ocean thermal energy conversion-based power plants.
For techno-economical reasons related to the temperature of the surface waters in Canada's Maritime Zones [25], ocean thermal energy conversion technology applications [26, 27] are not described in this paper.
Also, for local carbon economy reasons only natural gas-based and biomass power plants enabled with Carbon Capture, Utilization and Storage (CCUS) solutions are further discussed in this paper.
## iii. Capacity Value of Variable Renewables for Dispatchability Reserves
When dealing with variable ("non-dispatchable") renewable power sources such as wind or solar PV, grid operators have to keep ready-to-use dispatchable reserves to continuously maintain the balance between electricity generation (supply) and consumption (demand).
The amount of dispatchable reserves needed to be at hand in any utility service area with wind and/or solar power plants addressing the natural intermittency (variability) of these resources to smooth out electricity generation is defined by the Capacity Value of variable
generation plants. Capacity Value is the contribution that a plant makes toward the planning reserve margin [28] measuring the amount of generation capacity available to meet expected demand in planning horizon. For variable generation plants it means that a dedicated dispatchable reserves matching these plants will be added to the reserve margin.
When variable (wind or solar) generation is deployed, to ensure resource adequacy [29-32] of an electricity system grid operators determine Capacity Value of variable generation using reliability-based methods such as Effective Load Carrying Capability (ELCC), Equivalent Firm Capacity (EFC) or Equivalent Conventional Power (ECP) [33]. E.g., ELCC of a variable generation plant is defined as the amount by which the system's loads can increase when the plant is added to the electricity system while maintaining the same system reliability of the system. Determined through a set of detailed calculations considering all possible intermittency and/or contingency scenarios for a utility, ELCC defines the required planning reserve that may or may not be available depending on the renewable generation output [34-37].
For growing penetration of wind and solar power in electricity generation, ELCC defines incremental changes in variable generation plants deployment and cumulative changes in variable generation.
An example of wind deployment is presented by Nova Scotia Power Inc. [38]. Adding 355 MW of wind power to 545 MW of wind power existing in the system brought incremental capacity value of $12\%$ for this change and changed cumulative capacity value of wind power in the system from $26\%$ (141.7 MW) at 545 MW level to $19\%$ (171 MW) at 900 MW level. It is important to highlight that while cumulative capacity value of variable generation in terms of physical capacity (MW) is increasing with its penetration in the system, it is also decreasing as the fraction of its nameplate capacity (\%).
Using the cumulative capacity value of wind power and solar power in Nova Scotia, Alberta, and Saskatchewan, and in Canada overall, we can define the level of dispatchable reserves to contribute to the planning reserve margins that are required for variable generation deployment towards Clean Grid 2035 targets in both Current Measures and Canada NetZero scenarios presented by EF2023 – see Tables 2.3.1 and 2.3.2 below.
Table 2.3.1: Determining Dispatchable Reserves for Variable Generation Capacity (Canada NetZero Scenario) Table 2.3.2: Determining Dispatchable Reserves for Variable Generation Capacity (Current Measures Scenario)
<table><tr><td rowspan="2">Canada NetZero Scenario, MW</td><td colspan="3">Alberta</td><td colspan="3">Saskatchewan</td><td colspan="3">Nova Scotia</td></tr><tr><td>2025</td><td>2030</td><td>2035</td><td>2025</td><td>2030</td><td>2035</td><td>2025</td><td>2030</td><td>2035</td></tr><tr><td>Total capacity, MW</td><td>21,478</td><td>25,857</td><td>46,914</td><td>7,476</td><td>8,454</td><td>11,891</td><td>3,314</td><td>5,940</td><td>8,130</td></tr><tr><td>Solar (Distributed), MW</td><td>220.83</td><td>500</td><td>1000</td><td>20</td><td>100</td><td>150</td><td>1</td><td>10</td><td>12.5</td></tr><tr><td>Solar (Utility scale), MW</td><td>1180</td><td>1930</td><td>13000</td><td>84</td><td>116</td><td>1470</td><td>0.37</td><td>0.37</td><td>0.37</td></tr><tr><td>Total Solar Power, MW</td><td>1,401</td><td>2,430</td><td>14,000</td><td>104</td><td>216</td><td>1,620</td><td>1</td><td>10</td><td>13</td></tr><tr><td>Grid Penetration Solar, % of total capacity</td><td>6.5%</td><td>9.4%</td><td>29.8%</td><td>1.4%</td><td>2.6%</td><td>13.6%</td><td>0.0%</td><td>0.2%</td><td>0.2%</td></tr><tr><td>Capacity Value Solar, %</td><td>25.0%</td><td>18.0%</td><td>10.0%</td><td>32.0%</td><td>30.0%</td><td>15.0%</td><td>0.0%</td><td>35.0%</td><td>35.0%</td></tr><tr><td>Capacity Value Solar, MW</td><td>350</td><td>437</td><td>1,400</td><td>33</td><td>65</td><td>243</td><td>0</td><td>4</td><td>5</td></tr><tr><td>Offshore Wind, MW</td><td>0</td><td>0</td><td>0</td><td>0</td><td>0</td><td>0</td><td>0</td><td>2000</td><td>5000</td></tr><tr><td>Onshore Wind, MW</td><td>4,500</td><td>6,060</td><td>17,500</td><td>2,140</td><td>2,990</td><td>4,790</td><td>603</td><td>603</td><td>603</td></tr><tr><td>Total Wind Power, MW</td><td>4,500</td><td>6,060</td><td>17,500</td><td>2,140</td><td>2,990</td><td>4,790</td><td>603</td><td>2,603</td><td>5,603</td></tr><tr><td>Grid Penetration Wind, % of total capacity</td><td>21.0%</td><td>23.4%</td><td>37.3%</td><td>28.6%</td><td>35.4%</td><td>40.3%</td><td>18.2%</td><td>43.8%</td><td>68.9%</td></tr><tr><td>Capacity Value Wind, %</td><td>17.0%</td><td>17.0%</td><td>12.0%</td><td>19.0%</td><td>18.0%</td><td>17.0%</td><td>20.0%</td><td>19.0%</td><td>17.0%</td></tr><tr><td>Capacity Value Wind, MW</td><td>765</td><td>1030</td><td>2100</td><td>407</td><td>538</td><td>814</td><td>121</td><td>495</td><td>953</td></tr><tr><td>Total Variable Capacity Value, MW</td><td>1,115</td><td>1,468</td><td>3,500</td><td>440</td><td>603</td><td>1,057</td><td>121</td><td>498</td><td>957</td></tr><tr><td>Total Variable Capacity Value, % of grid capacity</td><td>5.2%</td><td>5.7%</td><td>7.5%</td><td>5.9%</td><td>7.1%</td><td>8.9%</td><td>3.6%</td><td>8.4%</td><td>11.8%</td></tr></table>
<table><tr><td rowspan="2">Current Measures
Scenario, MW</td><td colspan="3">Alberta</td><td colspan="3">Saskatchewan</td><td colspan="3">Nova Scotia</td></tr><tr><td>2025</td><td>2030</td><td>2035</td><td>2025</td><td>2030</td><td>2035</td><td>2025</td><td>2030</td><td>2035</td></tr><tr><td>Total capacity, MW</td><td>20,115</td><td>24,327</td><td>26,277</td><td>6,926</td><td>7,614</td><td>9,208</td><td>3,423</td><td>4,219</td><td>3,250</td></tr><tr><td>Solar (Distributed), MW</td><td>188</td><td>300</td><td>550</td><td>64</td><td>96</td><td>811</td><td>1</td><td>5</td><td>8</td></tr><tr><td>Solar (Utility scale), MW</td><td>1,500.0</td><td>1,500.0</td><td>3,500.0</td><td>20</td><td>60</td><td>90</td><td>0.37</td><td>0.37</td><td>0.37</td></tr><tr><td>Total Solar Power, MW</td><td>1,688</td><td>1,800</td><td>4,050</td><td>84</td><td>156</td><td>901</td><td>1</td><td>5</td><td>8</td></tr><tr><td>Grid Penetration Solar, % of total capacity</td><td>8.4%</td><td>7.4%</td><td>15.4%</td><td>1.2%</td><td>2.0%</td><td>9.8%</td><td>0.0%</td><td>0.1%</td><td>0.2%</td></tr><tr><td>Capacity Value Solar, %</td><td>20%</td><td>21%</td><td>17.50%</td><td>30%</td><td>28%</td><td>19%</td><td>35%</td><td>35%</td><td>35%</td></tr><tr><td>Capacity Value Solar, MW</td><td>338</td><td>378</td><td>709</td><td>25</td><td>44</td><td>171</td><td>0.48</td><td>2</td><td>3</td></tr><tr><td>Onshore Wind, MW</td><td>2,850</td><td>3,750</td><td>3,750</td><td>1,800</td><td>2,630</td><td>3,280</td><td>603</td><td>657</td><td>828</td></tr><tr><td>Total Wind Power, MW</td><td>2,850</td><td>3,750</td><td>3,750</td><td>1,800</td><td>2,630</td><td>3,280</td><td>603</td><td>657</td><td>828</td></tr><tr><td>Grid Penetration Wind, % of total capacity</td><td>14.2%</td><td>15.4%</td><td>14.3%</td><td>26.0%</td><td>34.5%</td><td>35.6%</td><td>17.6%</td><td>15.6%</td><td>25.5%</td></tr><tr><td>Capacity Value Wind, %</td><td>18%</td><td>17%</td><td>17%</td><td>19%</td><td>18%</td><td>17%</td><td>19%</td><td>19%</td><td>19%</td></tr><tr><td>Capacity Value Wind, MW</td><td>513</td><td>638</td><td>638</td><td>342</td><td>473</td><td>558</td><td>115</td><td>125</td><td>157</td></tr><tr><td>Total Variable Capacity Value, MW</td><td>851</td><td>1,016</td><td>1,346</td><td>367</td><td>517</td><td>729</td><td>115</td><td>127</td><td>160</td></tr><tr><td>Total Variable Capacity Value, % of grid capacity</td><td>4.2%</td><td>4.2%</td><td>5.1%</td><td>5.3%</td><td>6.8%</td><td>7.9%</td><td>3.4%</td><td>3.0%</td><td>4.9%</td></tr></table>
Capacity value levels used in Tables 2.3.1, 2.3.2 are based on [35, Fig. 5] for wind power; and [37, Fig. 11] for solar PV.
Tables 2.3.1, 2.3.2 show that Variable Capacity Value indicates considerable dispatchability reserves required in every province adding variable generation to achieve the Clean Grid 2035 objective. This is specifically important in Alberta, Saskatchewan and Nova Scotia promptly growing their variable resources.
In the Canada NetZero scenario (table 2.3.1) within 2025 to 2035 period variable dispatchability reserves in Alberta will grow from $5.2\%$ to $7.5\%$, in Saskatchewan - from $5.9\%$ to $8.9\%$, and in Nova Scotia - from $3.6\%$ to $11.8\%$ of provincial grid capacity.
A summary of Variable Dispatchability Reserves needed in Canada and their growth in 2025-2035 in NetZero scenario is shown in Table 2.3.3 below:
Table 2.3.3: Variable Dispatchability Reserves needed in Canada by 2035
<table><tr><td>NetZero Scenario: Variable Dispatchability Reserves needed, MW</td><td>2025</td><td>2030</td><td>2035</td></tr><tr><td>Eastern Canada:</td><td></td><td></td><td></td></tr><tr><td>Newfoundland and Labrador</td><td>16</td><td>18</td><td>19</td></tr><tr><td>Nova Scotia</td><td>121</td><td>498</td><td>957</td></tr><tr><td>Prince Edward Island</td><td>75</td><td>100</td><td>101</td></tr><tr><td>New Brunswick</td><td>93</td><td>107</td><td>442</td></tr><tr><td>Quebec</td><td>782</td><td>805</td><td>1,025</td></tr><tr><td>Ontario</td><td>1,879</td><td>2,223</td><td>3,211</td></tr><tr><td>Subtotal Eastern Canada:</td><td>2,966</td><td>3,751</td><td>5,756</td></tr><tr><td>Western Canada:</td><td></td><td></td><td></td></tr><tr><td>Manitoba</td><td>68</td><td>102</td><td>105</td></tr><tr><td>Saskatchewan</td><td>440</td><td>603</td><td>1,057</td></tr><tr><td>Alberta</td><td>1,115</td><td>1,468</td><td>3,500</td></tr><tr><td>British Columbia</td><td>1,024</td><td>1,626</td><td>2,231</td></tr><tr><td>Subtotal Western Canada:</td><td>2,647</td><td>3,798</td><td>6,894</td></tr><tr><td>Total Canada</td><td>5,613</td><td>7,549</td><td>12,649</td></tr></table>
## III. EXPECTED RESULTS AND OUTCOMES
### a) Clean Electricity Sources for Dispatchability Reserves
## i. Dispatchable Renewable Sources
Within the Clean Grid 2035 vision it is important that variable dispatchability reserves come from dispatchable renewable sources.
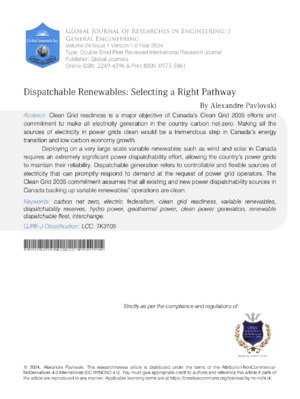
In Canada's environmental context two highly powerful dispatchable energy sources are available in the country: reservoir-based hydropower and deep geothermal power.
From an immediate readiness standpoint, reservoir-based hydro power can be seen as a strategic dispatchable renewable source available for load-
matching (within a few hours) and possibly for peak-matching (within a few minutes).
Specifically, major reservoir-based hydropower resources in Newfoundland and Labrador, Quebec and Manitoba may be used as dispatchability reserves for deploying variable resources in these - and neighbouring - provinces.
However, it is important to note that using shares of these hydropower sources as dispatchability reserves may reduce their ability to export electricity to the U.S.
Deep geothermal power sources, while not commercially tested in Canada, provide even higher opportunities for Clean Grid 2035 and beyond. Located in the area with very high geothermal resources bordering Alberta, British Columbia, and Yukon [geothermal references], these sources are realized with Enhanced Geothermal Systems (EGS). As a very efficient highly dispatchable resource with capacity factor of $90\%$, EGS is seen as a strong competitor to any clean electricity solutions considered in Western Canada. Technical and economic aspects of EGS are discussed in Section 4 of this paper.
## ii. Hydropower: Changing the Role
Changing the role of reservoir-based hydropower resources from being export-focused to
becoming dispatchability reserves-focused to promptly deploy variable generation across the country presents a strategic opportunity for Clean Grid 2035.
From an economic angle, existing (and growing) power capacity should be seen firstly for meeting electricity demand and related dispatchability requirements, and only secondly for electricity exports. Because of the changes in variable capacity in each of the provinces' electricity generation mix, current export practices should be reviewed/upgraded to establish these priorities. Provincial generation capacity mix should clearly define changes in interconnections between the provinces to provide variable dispatchability reserves.
Favourable conditions for interchange with neighboring provinces should be established within the "electric federalism" context to make this a winning strategy for the provinces contributing variable dispatchability reserves, and for Canada in general.
## iii. Interchange Resources as a Key Asset
Interchange resources including interprovincial out/in flows and exports/imports may be generally defined as a difference between Electricity Demand and Generation in the provinces. This difference includes transmission and distribution losses.
Table 3.3.1: Interchange Resources*
<table><tr><td>NetZero Scenario:
Resources for Interchange, TWh</td><td>2025</td><td>2030</td><td>2035</td></tr><tr><td>Eastern Canada:</td><td></td><td></td><td></td></tr><tr><td>Newfoundland and Labrador</td><td>32.84</td><td>32.47</td><td>32.43</td></tr><tr><td>Nova Scotia</td><td>-4.17</td><td>0.40</td><td>6.15</td></tr><tr><td>Prince Edward Island</td><td>-0.53</td><td>-0.51</td><td>-0.19</td></tr><tr><td>New Brunswick</td><td>-3.38</td><td>-6.67</td><td>-3.41</td></tr><tr><td>Quebec</td><td>20.56</td><td>35.06</td><td>36.72</td></tr><tr><td>Ontario</td><td>-9.60</td><td>-9.83</td><td>18.55</td></tr><tr><td>Western Canada:</td><td></td><td></td><td></td></tr><tr><td>Manitoba</td><td>7.24</td><td>14.47</td><td>20.51</td></tr><tr><td>Saskatchewan</td><td>-0.33</td><td>-0.50</td><td>-1.03</td></tr><tr><td>Alberta</td><td>8.77</td><td>9.63</td><td>11.32</td></tr><tr><td>British Columbia</td><td>2.02</td><td>-5.07</td><td>-5.92</td></tr></table>
A simplified methodology for defining a part of interchange resources available as variable dispatchability reserves using EF2023 data may be presented as follows.
$$
G = D \times (1+TLF+DLF) + IF, or
$$
$$
IF = [G-Dx (1+TLF+DLF)], and
$$
$$
I = D R + if + E F, and
$$
$$
D R C = D R / (C F \times 8 7 6 0), w h e r e:
$$
TLF - Transmission loss factor (%)
DLF - Distribution loss factor (%)
G - Generation (TWh)
D - Demand (TWh)
IR - Interchange Resource (TWh),
IF – Interprovincial Flow (TWh),
EF-Export Flow (TWh),
DR - Dispatchability Reserves as a potential Interchange component (TWh)
DRC - Dispatchability Reserves Capacity (MW)
CF - Capacity factor of dispatchability reserve - related generation source, e.g., hydro power or geothermal power (%)
Calculations based on EF2023 data (see Table 3.3.1) show that Newfoundland and Labrador, and Quebec in Eastern Canada and Manitoba in Western Canada have interchange resources based on reservoir-based hydropower that can be used as dispatchability reserves. Nova Scotia and Alberta cannot use their resources for variable dispatchability planning.
However, due to long-term agreements between Newfoundland and Labrador and Quebec,
generation for variable dispatchability applications is limited to Muskrat Falls Generation Station (4.5 TWh annual at $62.3\%$ capacity factor). With Quebec hydro capacity at $73.6\%$ capacity factor (e.g., transmitting electricity from Churchill Falls station in NL) and Manitoba hydro capacity at $75\%$ capacity factor, the sources for variable dispatchability reserves are seen as follows:
Table 3.3.2: Interchange Resources versus Variable Dispatchability Reserves Needed
<table><tr><td>NetZero Scenario: Interchange Resources Capacity, MW</td><td>2025</td><td>2030</td><td>2035</td></tr><tr><td>Newfoundland and Labrador</td><td>824</td><td>824</td><td>824</td></tr><tr><td>Quebec</td><td>941</td><td>2,769</td><td>2,319</td></tr><tr><td>Manitoba</td><td>830</td><td>1,880</td><td>2,734</td></tr><tr><td>Total Canada</td><td>2,595</td><td>5,473</td><td>5,877</td></tr></table>
<table><tr><td>NetZero Scenario: Variable Dispatchability Reserves needed, MW</td><td>2025</td><td>2030</td><td>2035</td></tr><tr><td>Subtotal Eastern Canada:</td><td>2,966</td><td>3,751</td><td>5,756</td></tr><tr><td>Subtotal Western Canada:</td><td>2,647</td><td>3,798</td><td>6,894</td></tr><tr><td>Total Canada</td><td>5,613</td><td>7,549</td><td>12,649</td></tr></table>
Comparing the dispatchability reserves sources and needs, we see that there is a clear gap between the sources and required uses in variable dispatchability reserves, and solutions should be discussed to address this dispatchability gap.
## iv. Realizing Clean Dispatchability Reserves Strategy
Below are some examples describing possible realization of the "hydropower-as-a-clean-dispatchability-reserve" strategy in Eastern and Western Canada, using interchange capacity as a source of variable dispatchability reserves.
a. Eastern Canada
In the Canada NetZero scenario, the needs for dispatchability reserves may be as follows.
In Eastern Canada, hydropower capacity in Newfoundland and Labrador presented by Muskrat Falls Generating Station may be considered as a major
source for variable dispatchability reserves for Nova Scotia.
By 2030 Nova Scotia plans to deploy 5 GW of offshore wind capacity to start exporting electricity. Dispatchability reserves required for variable capacity in Nova Scotia present 498 MW in 2030 and 957 MW in 2035 (see Table 2.3.3.). The installed capacity of Muskrat Falls Generating Station (NL) is 824 MW. It will provide $60\%$ of its capacity to ensure related capacity value in Nova Scotia's planning reserves only for 2.6 GW of wind power in 2030. In 2035 with expected 5.6GW of wind power in Nova Scotia, the full capacity of Muskrat Falls Generating Station will not be enough, and required difference in capacity would be required from Quebec.
Table 3.4.1: Variable dispatchability reserves for Nova Scotia
<table><tr><td>NetZero Scenario</td><td>2025</td><td>2030</td><td>2035</td></tr><tr><td>Muskrat hydro capacity, MW</td><td>824</td><td>824</td><td>824</td></tr><tr><td>Muskrat capacity factor, %</td><td>62.30%</td><td>62.30%</td><td>62.30%</td></tr><tr><td>Variable capacity in Nova Scotia, MW</td><td>604</td><td>2,613</td><td>5,616</td></tr><tr><td>Variable dispatchability reserves needed in Nova Scotia, MW</td><td>121</td><td>498</td><td>957</td></tr><tr><td>Muskrat hydro capacity available for electricity export, MW</td><td>703</td><td>326</td><td>0</td></tr><tr><td>Nova Scotia's purchase of dispatchability reserves from Quebec, MW</td><td>0</td><td>0</td><td>133</td></tr></table>
(2) Clean dispatchability needs in Prince Edward Island, New Brunswick, and Ontario
In Eastern Canada, the provinces of Prince Edward Island, New Brunswick and Ontario do not plan
to export electricity and do not have available reserves for variable capacity. The variable dispatchability needs of these provinces are as follows:
Table 3.4.2: Variable dispatchability reserves for Prince Edward Island, New Brunswick, and Ontario
<table><tr><td>NetZero Scenario</td><td>2025</td><td>2030</td><td>2035</td></tr><tr><td>Variable capacity in Prince Edward Island, MW</td><td>358.5</td><td>484.7</td><td>484.8</td></tr><tr><td>Dispatchability reserves for variable capacity required for PEI, MW</td><td>75.3</td><td>99.8</td><td>101.1</td></tr><tr><td>Variable capacity in New Brunswick, MW</td><td>430.2</td><td>488.2</td><td>2,297.7</td></tr><tr><td>Dispatchability reserves for variable capacity required for New Brunswick, MW</td><td>93.2</td><td>106.6</td><td>441.8</td></tr><tr><td>Variable capacity in Ontario, MW</td><td>10,750.6</td><td>13,792.7</td><td>23,199.7</td></tr><tr><td>Dispatchability reserves for variable capacity required for Ontario, MW</td><td>1,879.3</td><td>2,222.6</td><td>3,210.9</td></tr></table>
As shown in Table 3.4.2, while very minor support in 2025 may be needed to support dispatchability reserves in Prince Edward Island and New Brunswick, much higher need is seen with dispatchability reserves for variable capacity in Ontario.
According to Canada Energy Regulator [18], variable capacity in Quebec is expected to grow from
4,580 MW in 2025 to 5,840 MW in 2035. Availability to use interchange capacity based on hydro power for variable dispatchability reserves (calculated at $73.6\%$ capacity factor) in Eastern Canada is shown in Table 3.4.3. It includes opportunities to address the needs of Nova Scotia, Prince Edward Island, New Brunswick, and Ontario.
Table 3.4.3: Quebec Interchange Capacity available for Eastern Canada
<table><tr><td>NetZero Scenario</td><td>2025</td><td>2030</td><td>2035</td></tr><tr><td>Quebec interchange availability, TWh</td><td>6.07</td><td>17.85</td><td>14.95</td></tr><tr><td>Quebec hydro capacity for electricity export/interprovincial outflows, MW</td><td>941</td><td>2,769</td><td>2,319</td></tr><tr><td>Variable capacity in Quebec, MW</td><td>4,580</td><td>4,660</td><td>5,840</td></tr><tr><td>Dispatchability reserves needed for variabl</td><td>0</td><td>0</td><td>133</td></tr><tr><td>Dispatchability reserves needed for variable capacity in Prince Edward Island, MW</td><td>75</td><td>100</td><td>101</td></tr><tr><td>Dispatchability reserves needed for variable capacity in New Brunswick, MW</td><td>93</td><td>107</td><td>442</td></tr><tr><td>Dispatchability reserves needed for variable capacity in Ontario, MW</td><td>1,879</td><td>2,223</td><td>3,211</td></tr><tr><td>Quebec interchange capacity available after dispatchability reserves purchase by Nova Scotia, Prince Edwa</td><td>-1,127</td><td>0</td><td>0</td></tr><tr><td>Interchange resources available in Manitoba after support to Ontario, MW</td><td>0</td><td>1,312</td><td>36</td></tr></table>

Summarizing dispatchability aspects in Canada NetZero scenario: figures in Tables 3.4.1-3.4.3 show that dispatchable hydropower resources in Eastern Canada (such as Newfoundland and Labrador, and Quebec) can provide variable dispatchability reserves for grid planning support for the Maritimes but are not sufficient for addressing the clean dispatchability reserves needs of variable capacity in Ontario (see Table 3.4.3). However, this may be addressed in 2030 and 2035 by receiving dispatchability reserves support from Manitoba.
### b. Western Canada
In Western Canada opportunities to use hydropower as dispatchability reserve look as follows.
The reservoir-based hydropower resources of Manitoba have their total capacity of 2.3 GW (based on [39-41]). The hydro power resources in Manitoba, focused on electricity export, can be redirected to supporting dispatchability reserves in the province and beyond in Western Canada. A very small share of these resources can be supporting variable generation in Manitoba (see Table 3.4.4 below).
Table 3.4.4: Hydro Power sources in Manitoba supporting Dispatchability Reserves
<table><tr><td>Canada NetZero Scenario</td><td>2025</td><td>2030</td><td>2035</td></tr><tr><td>Manitoba hydro capacity, MW</td><td>6,070</td><td>7,590</td><td>7,670</td></tr><tr><td>Manitoba interchange capacity available, MW</td><td>830</td><td>1,880</td><td>2,734</td></tr><tr><td>Manitoba variable capacity, MW</td><td>320</td><td>466</td><td>476</td></tr><tr><td>Dispatchability reserves for variable capacity required for Manitoba, MW</td><td>68</td><td>102</td><td>105</td></tr><tr><td>Manitoba interchange capacity available after its dispatchability reserve adjustment, MW</td><td>762</td><td>1,778</td><td>2,629</td></tr></table>
The Manitoba hydro capacity available for export after its dispatchability reserve adjustment can be considered to support the clean dispatchability reserves needs of variable capacity in Ontario in coordination with
Quebec (Table 3.4.2). Or - it can be used to support dispatchability reserves needs of variable capacity in Saskatchewan:
Table 3.4.5: Variable dispatchability reserves for Saskatchewan
<table><tr><td>Canada NetZero Scenario</td><td>2025</td><td>2030</td><td>2035</td></tr><tr><td>Saskatchewan variable capacity, MW</td><td>2,244</td><td>3,206</td><td>6,410</td></tr><tr><td>Dispatchability reserves for variable capacity required for Saskatchewan, MW</td><td>440</td><td>603</td><td>1,057</td></tr><tr><td>Manitoba interchange capacity available after Saskatchewan dispatchability reserve adjustment, MW</td><td>322</td><td>1,175</td><td>1,572</td></tr></table>
However, Manitoba interchange capacity can only partially cover the needs for variable dispatchability reserves in Alberta:
Table 3.4.6: Variable dispatchability reserves for Alberta
<table><tr><td>Canada NetZero Scenario</td><td>2025</td><td>2030</td><td>2035</td></tr><tr><td>Alberta variable capacity, MW</td><td>5,901</td><td>8,490</td><td>31,500</td></tr><tr><td>Dispatchability reserves for variable capacity required for Alberta, MW</td><td>1,115</td><td>1,468</td><td>3,500</td></tr><tr><td>Manitoba interchange capacity available after Saskatchewan and Alberta dispatchability reserve adjustment, MW</td><td>-793</td><td>-293</td><td>-1,928</td></tr></table>
Also, the needs for dispatchability reserves for variable capacity required for British Columbia are not
covered and have to be addressed by other clean dispatchability reserves sources:
Table 3.4.7: Variable dispatchability reserves for British Columbia
<table><tr><td>Canada NetZero Scenario</td><td>2025</td><td>2030</td><td>2035</td></tr><tr><td>British Columbia variable capacity, MW</td><td>5,721</td><td>11,710</td><td>16,890</td></tr><tr><td>Dispatchability reserves for variable capacity required for British Columbia, MW</td><td>1,024</td><td>1,626</td><td>2,231</td></tr></table>
Overall, should Manitoba provide their export-oriented capacity as clean dispatchability reserves to Ontario or sell electricity into the U.S., the following
dispatchability reserves would be needed for Saskatchewan, Alberta, and British Columbia in total:
Table 3.4.8: Variable dispatchability reserves for Saskatchewan, Alberta, and British Columbia
<table><tr><td>Canada NetZero Scenario</td><td>2025</td><td>2030</td><td>2035</td></tr><tr><td>Dispatchability reserves for variable capacity required for Saskatchewan, Alberta, and British Columbia – total*, MW</td><td>2,579</td><td>3,696</td><td>6,789</td></tr></table>
As within the Clean Grid 2035 timeframe neither Saskatchewan nor Alberta or British Columbia probably will have available export or other clean dispatchability reserves supporting their variable capacity, other clean dispatchability resources can be used in Western Canada.
One of such sources that is seen as highly attractive for Western Canada's use is Enhanced Geothermal Systems (EGS) located in the area with very high geothermal resources bordering Alberta, British Columbia, and Yukon [11]. As a very efficient highly
dispatchable resource with capacity factor of $90\%$, EGS is seen as a strong competitor to any solutions being considered in Alberta and British Columbia. While technical and economic aspects of EGS are discussed in Section 4 of this paper, here we only indicate the figures relating to dispatchability reserve needs.
To establish EGS dispatchability reserve needs, reservoir-based hydro and enhanced geothermal capacity should be matched for electricity generation. This can be defined using a capacity factor ratio that can be applied in reserve planning:
$$
E G S \text{capacity} (M W) = \text{hydropowercapacity} (M W) \times C F R,
$$
where CFR = hydropower capacity factor/EGS capacity factor is capacity factor ratio.
Using hydropower capacity factor of $75\%$ and EGS capacity factor of $90\%$, we determine capacity
factor ratio of 0.8333 that is used for adjusting EGS dispatchability reserve:
3.4.9: Enhanced Geothermal Systems-based dispatchability reserves for Saskatchewan, Alberta, and British Columbia
<table><tr><td>Canada NetZero Scenario</td><td>2025</td><td>2030</td><td>2035</td></tr><tr><td>Enhanced Geothermal Systems-based dispatchability reserves for variable capacity in Saskatchewan, Alberta and British Columbia, MW</td><td>2,149</td><td>3,080</td><td>5,657</td></tr></table>
## v. Integrating Dispatchable Renewable Fleets
Enhanced geothermal systems can be used not only in planning and deployment of clean dispatchability reserves, but they can also be effectively competing with other resources in EF2023 within the Glean Grid 2035 timeframe.
For example, Table 3.5.1 below shows the current Canada NetZero scenario for Alberta:
Table 3.5.1: Canada NetZero scenario for Alberta - current
<table><tr><td rowspan="2">Canada NetZero ALBERTA</td><td colspan="3">Capacity, MW</td><td colspan="3">Generation, TWh</td></tr><tr><td>2025</td><td>2030</td><td>2035</td><td>2025</td><td>2030</td><td>2035</td></tr><tr><td>Solar (Distributed)</td><td>221</td><td>500</td><td>1,000</td><td>0.33</td><td>0.76</td><td>1.51</td></tr><tr><td>Solar (Utility scale)</td><td>1,180</td><td>1,930</td><td>13,000</td><td>2.09</td><td>3.47</td><td>23.98</td></tr><tr><td>Onshore Wind</td><td>4,500</td><td>6,060</td><td>17,500</td><td>16.05</td><td>21.53</td><td>65.15</td></tr><tr><td>Hydro</td><td>894</td><td>894</td><td>894</td><td>1.65</td><td>1.65</td><td>1.35</td></tr><tr><td>Hydrogen</td><td>0</td><td>0</td><td>0</td><td>0.00</td><td>0.00</td><td>0.00</td></tr><tr><td>Natural Gas</td><td>14,300</td><td>14,000</td><td>8,660</td><td>68.85</td><td>66.07</td><td>5.28</td></tr><tr><td>Natural Gas with CCUS</td><td>0</td><td>2,090</td><td>4,290</td><td>0.00</td><td>11.70</td><td>21.23</td></tr><tr><td>Oil</td><td>7</td><td>7</td><td>7</td><td>0.02</td><td>0.00</td><td>0.00</td></tr><tr><td>Battery Storage</td><td>90</td><td>90</td><td>90</td><td></td><td></td><td></td></tr><tr><td>Bioenergy</td><td>286</td><td>286</td><td>286</td><td>1.41</td><td>1.60</td><td>1.04</td></tr><tr><td>Bioenergy with CCUS</td><td>0</td><td>0</td><td>728</td><td>0.00</td><td>0.00</td><td>5.74</td></tr><tr><td>Geothermal with EGS</td><td></td><td></td><td></td><td></td><td></td><td></td></tr><tr><td>Uranium SMR</td><td>0</td><td>0</td><td>459</td><td>0.00</td><td>0.00</td><td>3.20</td></tr><tr><td>Total</td><td>21,478</td><td>25,857</td><td>46,914</td><td>90.4</td><td>106.8</td><td>128.5</td></tr></table>
This scenario can be effectively transformed in a scenario with EGS deployment:
Table 3.5.2: Canada NetZero scenario for Alberta - adjusted by EGS capacity
<table><tr><td rowspan="2">Canada NetZero
ALBERTA</td><td colspan="3">Capacity, MW</td><td colspan="3">Generation, TWh</td></tr><tr><td>2025</td><td>2030</td><td>2035</td><td>2025</td><td>2030</td><td>2035</td></tr><tr><td>Solar (Distributed)</td><td>221</td><td>500</td><td>1,000</td><td>0.33</td><td>0.76</td><td>1.51</td></tr><tr><td>Solar (Utility scale)</td><td>1,180</td><td>1,930</td><td>6,430</td><td>2.09</td><td>3.47</td><td>11.86</td></tr><tr><td>Onshore Wind</td><td>4,500</td><td>6,060</td><td>10,060</td><td>16.05</td><td>21.53</td><td>37.45</td></tr><tr><td>Hydro</td><td>894</td><td>894</td><td>894</td><td>1.65</td><td>1.65</td><td>1.35</td></tr><tr><td>Hydrogen</td><td>0</td><td>0</td><td>0</td><td>0</td><td>0</td><td>0</td></tr><tr><td>Natural Gas</td><td>14,300</td><td>3,000</td><td>0</td><td>68.85</td><td>14.16</td><td>0.00</td></tr><tr><td>Natural Gas with
CCUS</td><td>0</td><td>2,090</td><td>4,290</td><td>0.00</td><td>11.70</td><td>21.23</td></tr><tr><td>Oil</td><td>7</td><td>7</td><td>7</td><td>0.02</td><td>0</td><td>0</td></tr><tr><td>Battery Storage</td><td>90</td><td>90</td><td>90</td><td></td><td></td><td></td></tr><tr><td>Bioenergy</td><td>286</td><td>0</td><td>0</td><td>1.41</td><td>0.00</td><td>0.00</td></tr><tr><td>Bioenergy with
CCUS</td><td>0</td><td>0</td><td>0</td><td>0</td><td>0</td><td>0</td></tr><tr><td>Geothermal with
EGS</td><td>0</td><td>6,788</td><td>6,986</td><td>0</td><td>53.51</td><td>55.08</td></tr><tr><td>Uranium SMR</td><td>0</td><td>0</td><td>0</td><td>0</td><td>0</td><td>0</td></tr><tr><td>Total</td><td>21,478</td><td>21,359</td><td>29,758</td><td>90.4</td><td>106.8</td><td>128.5</td></tr></table>
Furthermore, Enhanced Geothermal Systems (EGS) located in the area with very high geothermal resources bordering Alberta, British Columbia, and Yukon [11], can be used for dispatchability resources/load matching not only in Western Canada, but will allow for addressing these needs in Ontario and in Eastern Canada (see Section 4).
Overall, the proposed approach to using hydropower as a variable dispatchability reserve from Newfoundland and Labrador, and Quebec for Eastern Canada, and combining hydropower in Manitoba and geothermal power in Alberta/Yukon as dispatchability reserves for Western Canada makes variable resources like wind and solar dispatchable, upgrading all power
grids in Canada to Clean Grid practices in 2035 and further in 2050.
Using dispatchable hydropower and geothermal power together with wind and solar power would make all generating capacity in Canada dispatchable and would establish its leading clean dispatchability practices in North America. It would also present an opportunity for Dispatchable Integrated Renewable Fleets in all Canadian provinces and beyond.
### b) Geothermal Technology as a Strategic Opportunity
## i. Strategic Opportunities with Geothermal
Dramatically scaling up clean electricity generation to meet the Clean Grid 2035 objective means leveraging and promptly deploying strategic solutions. Canada has at hand. One of these very few strategic solutions for addressing the net-zero electricity gap in the country is Geothermal Power Generation.
While geothermal resources in Canada have massive potential to provide clean energy across the country, geothermal power generation has largely remained undeveloped [20]. Today, with Canada's leadership in energy transition and total electrification, and Canada Energy Regulator's detailed look into Canada's Energy Future, enhanced geothermal generation opportunities must be viewed from a crucial strategic angle.
It is generally well known that geothermal generation provides clean, renewable, round-the-clock electricity, not depending on weather, season, and time of day; it emits little or no greenhouse gases, and has a small environmental footprint, very competitive to renewable resources like wind, solar or hydro [42]. What is not often mentioned is that enhanced geothermal generation brings to power grids in Canada two unique opportunities: a powerful source of dispatchable baseload, and a "power storage" for dispatchability reserves allowing for unlimited growth of variable renewables like wind or solar. Understanding this in the context of the Clean Grid 2035 commitment, Canada must promptly strengthen geothermal power generation in Western provinces - moving from a "lagging behind" position in North America, and globally, to a world leader in exporting deep geothermal expertise and technology internationally [13].
## ii. Geothermal Resources in Canada
High temperature geothermal resources in Canada are a part of the Pacific Ring of Fire, a tectonic belt of volcanoes and earthquakes [43], and the related Canada's Pacific Rim. Volcanic belts are common in the Canadian Cordillera [11, 14]. British Columbia, Yukon and Northwest Territories are home to a region of volcanoes and volcanic activity in the Pacific Ring of Fire.
Geothermal resources of the Pacific Rim are the most efficient and economic means to generate geothermal power, with high temperature resources $(>150^{\circ}\mathrm{C})$ typically targeted for highly dispatchable electricity generation.
These high temperatures allow very high potential for electricity generation in regions of northeastern British Columbia and southern Yukon, northern Alberta, and southern Northwest Territories. Regional temperatures suitable for electricity generation, $150^{\circ}\mathrm{C}$ or more, can be reached at relatively shallow depths of 3.5-4.5 km in northwestern Alberta and
northeastern BC. For communities in the southern Mackenzie Corridor and in southwest Yukon, temperatures $>150^{\circ}\mathrm{C}$ can be reached at depths of 3.5-5 km.
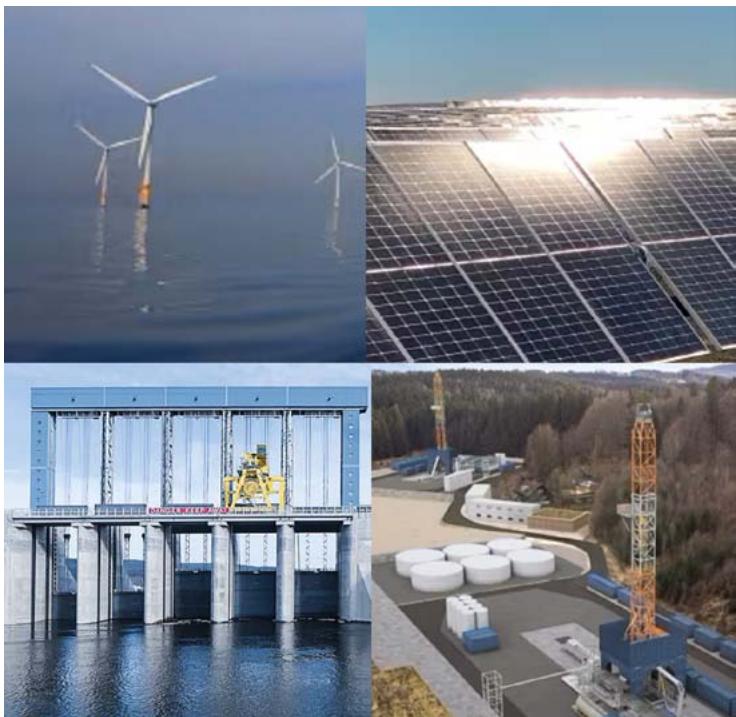
To estimate the thermal energy, or heat content, for deploying geothermal power plants, a $4 \times 4 \mathrm{~km}$ rock mass, $1 \mathrm{~km}$ thick ( $16 \mathrm{~km}^{3}$ total volume) was considered by S. E. Grasby et al in [11]. Cooling this rock mass from an initial temperature of $150^{\circ} \mathrm{C}$ to a final temperature of $30^{\circ} \mathrm{C}$ results in $5 \times 10^{18}$ Joules, or 1.39 PetaWatt-hours (PWh).
The actual accessible and usable geothermal energy resource is estimated by applying a factor of 0.02 of in-place thermal energy, or $1 \times 10^{17}$ J (27.8 TWh) for the same rock volume of $16\mathrm{km}^3$. Comparing 27.8 TWh power output of this geothermal unit with electricity demand in 2023 in British Columbia (65.10 TWh), Alberta (80.69 TWh) or Saskatchewan (25.45 TWh) shows a very limited number of units (e.g. one geothermal unit for transmission to Saskatchewan or three geothermal units in Alberta) that can cover the electricity needs in these provinces.
Fig. 4.2.1: Heat Energy at $3.5\mathrm{km}$ depth [11]
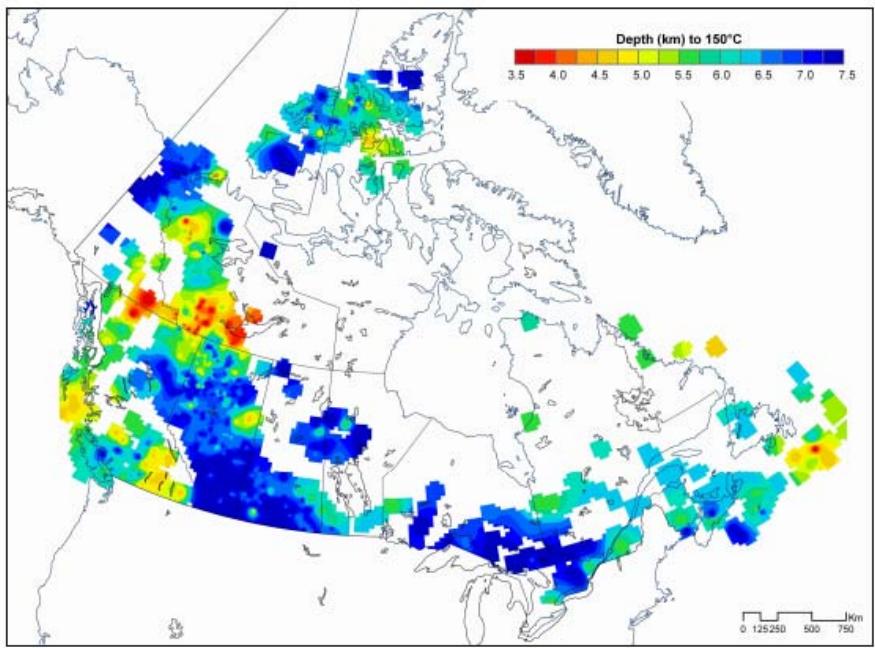
Fig. 4.2.2: Depth (km) to $150^{\circ}\mathrm{C}$ temperature [11]
It has been found [12] that multiple locations of heat value resources are available at moderate depths which have already been reached in oil and gas drilling operations. Based on petroleum industry experience in the Western Canadian Sedimentary Basin (WCSB), it is common to drill 4 to $6\mathrm{km}$ deep wells in deeper parts of this area, and technology to achieve such depths is readily available.
Many locations with enhanced geothermal generation potential in the WCSB occur in northeastern British Columbia, parts of northwestern Alberta and central Alberta (including the Lac La Biche high), and in Saskatchewan (Williston Basin high).
Also, in the WCSB these depths are mainly reached below the sedimentary cover. These sediments form an effective thermal blanket that decrease the depth required to reach effective temperatures for enhanced geothermal development. As drilling through sedimentary rocks is less expensive than in the areas of crystalline rock, enhanced geothermal deployment in these areas is more economically attractive.
Specifically, the Alberta Basin area is seen as a practical approach for geothermal electricity generation [12]. Opportunities of access to the Northern Lights Transmission line and the Edmonton-West coal power corridor were reviewed for power transmission within the
Alberta electricity system to make this geothermal power generation economic and leverage its highly efficient dispatch.
## iii. Enhanced Geothermal Systems for Electricity Generation
Enhanced Geothermal Systems (EGS) bring geothermal energy for electricity generation from heat produced in the subsurface. This heat is generated from natural radiogenic decay of elements in the upper crust as well as primordial heat generated from the formation of the planet.
EGS use fluid injected deep underground under carefully controlled conditions; this fluid absorbs energy from hot rock formations and carries this energy to the surface to drive turbines and generate electricity in flash steam or binary-cycle geothermal power plants [44,45].
Modern EGS are divided into two major groups: open-loop and closed-loop systems. The open-loop systems have fluid pumped down injection wells into hot rock formations, migrate through the hot rock and while collecting heat, get captured by extraction wells, and
pumped back to the surface where the heat is converted into electricity [46]. The wells are often drilled horizontally to maximize the volume of hot rock exposed to the fluid. The closed-loop systems have the fluid pumped into a well contained within the underground pipes, recovered and re-used. The closed-loop EGS presents two approaches. A single-well approach uses concentric pipes to pump a heat transfer fluid down a vertical wellbore and along a directional wellbore, have it make U-turn and flow back within a concentric pipe. A multiple-well (doublet) approach has the fluid conveyed back to the surface up a second vertical wellbore to be pumped back to the injection wellbore.
Leading examples of EGS solutions in North America are presented by such technology developers as Fervo Energy (Houston, Texas) and Eavor Technologies Inc. (Calgary, Alberta) [47].
Fervo Energy presents first-of-a-kind EGS horizontal doublet well system, consisting of an injection and production well pair within a high-temperature, hard rock geothermal formation [48] (see Fig. 4.3.1).
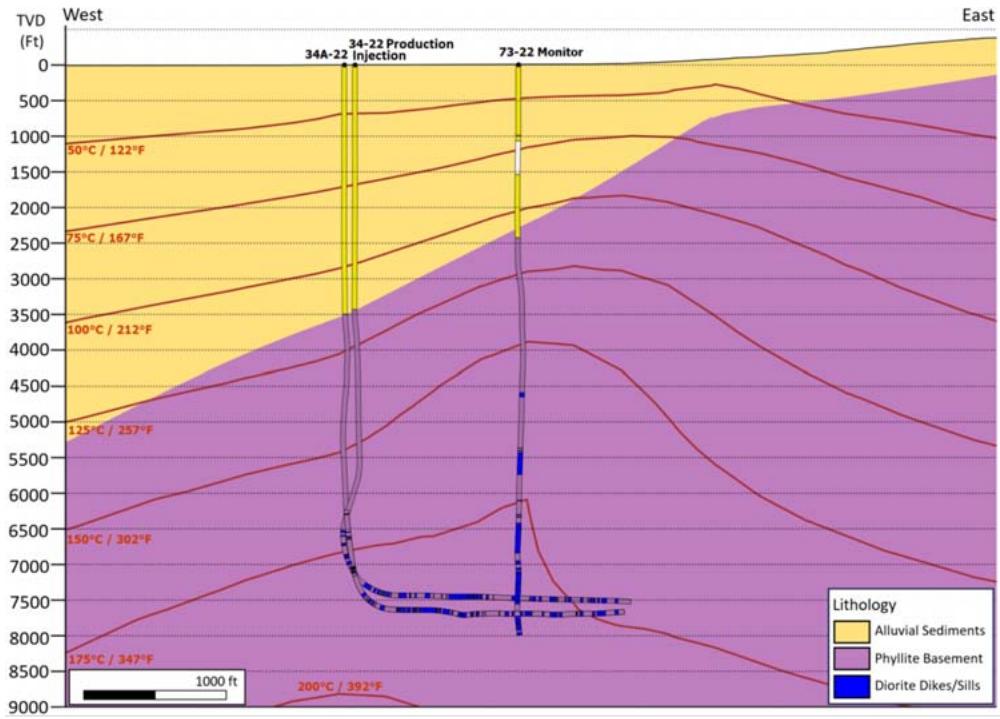
Fig. 4.3.1: A cross-section of the horizontal doublet EGS system and deep vertical monitoring well [48]. Credits to Fervo Energy
Eavor Technologies presents a Eavor-Loop™, consisting of large U-tube shaped well with 2 multilaterals. Eavor-Lite™ Pilot (see Figure 4.3.2) is a full-scale prototype of the Eavor-Loop™. The laterals are approximately 1700m long and are placed in the Rock Creek formation at depth of 2400m.
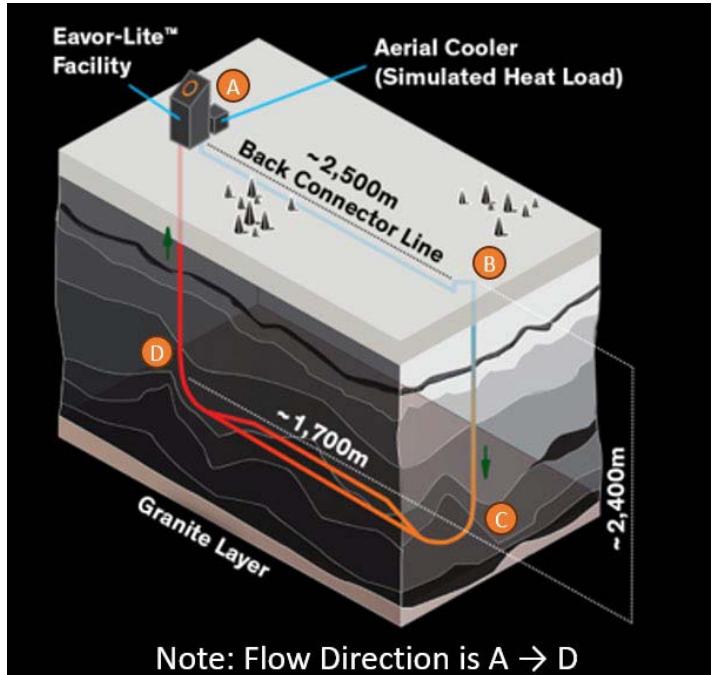
Fig. 4.3.2: Schematic of Eavor-Lite™ Pilot[49,50]. Credits to Eavor Technologies
EGS use human-made reservoirs to inject fluid and extract economical amounts of heat from low permeability and/or low porosity geothermal resources. The fluid in EGS carries energy to the surface through wells, driving turbines and generating electricity [44,45].
The high capacity factor of geothermal power (90%) makes it particularly attractive as a dispatchable renewable resource.
## iv. Economics of Enhanced Geothermal Systems
While geothermal energy resources in Canada are unique and attractive because of their geo-economic positioning in Western Canada, Enhanced Geothermal Systems (EGS) for electricity generation in Canada present a longer-term objective in energy transition process towards Net Zero [11,14].
To support this statement, three major parameters of EGS should be reviewed to analyse costs and risk factors of deploying this technology: capital expenditures (CAPEX) covering equipment, engineering and deployment costs of a plant, operational expenditures (OPEX) covering fuel, maintenance, and support costs of this plant, and levelized cost of energy (LCOE) indicating the net present cost of electricity generation over the anticipated lifetime of the plant.
Table 4.4.4 below presented by [egs16] compares different power-station options based on their CAPEX and LCOE. CAPEX represents the upfront funds needed for plant development, and LCOE compares the lifetime costs of different energy systems using a 30-year payback period:
Table 4.4.4: Electricity source CAPEX and LCOE, USD [13]
<table><tr><td></td><td>Electricity source</td><td>CAPEX (\$/kW)</td><td>LCOE (\$/kWh)</td><td>Cost Estimate Date, Notes, Source</td></tr><tr><td>1</td><td>Geothermal (hydrothermal)</td><td>2,400 - 6,200</td><td>0.07 - 0.12</td><td>\( (2019)^2 \)</td></tr><tr><td>2</td><td>Geothermal ('near hydrothermal' EGS)</td><td>9,000 - 10,000</td><td>0.1 - 0.3</td><td>\( (2019)^2 \)</td></tr><tr><td>3</td><td>Geothermal ('deep' [3-6km] EGS)</td><td>20,000 - 46,000</td><td>0.16 - 0.42</td><td>(2019) (low=flash, high=binary cycle) \( {}^{3} \)</td></tr><tr><td>4</td><td>Hydroelectric</td><td>2,500 - 16,000</td><td>0.06 - 0.36</td><td>\( (2019)^4 \)</td></tr><tr><td>5</td><td>Solar (Utility PV)</td><td>~1,400</td><td>0.03 - 0.05</td><td>(2019) (w/o battery storage) \( {}^{5} \)</td></tr><tr><td>6</td><td>Wind (land)</td><td>~1,450</td><td>0.25 - 0.08</td><td>\( (2019)^6 \)</td></tr><tr><td>7</td><td>Nuclear</td><td>~6,800</td><td>~0.08</td><td>\( (2019)^7 \)</td></tr><tr><td>8</td><td>Coal</td><td>4,000 - 6,200</td><td>~0.09 - ~0.16</td><td>(2017) (low = new plant; high = with CCS (carbon capture + storage) \( {}^{8} \)</td></tr><tr><td>9</td><td>Natural Gas</td><td>920 - 3,300</td><td>~0.06 - ~0.16</td><td>(2017) (low = turbine combined cycle; high = same + CCS) \( {}^{9} \)</td></tr><tr><td>10</td><td>Tidal</td><td>"high"</td><td>0.2 - 0.45</td><td>(2020) (~535MW in operation worldwide; most 'tidal barrageage' (~522MW) \( {}^{10} \)</td></tr><tr><td>11</td><td>Wave</td><td>"high"</td><td>0.3 - 0.55</td><td>(2020) (< 3MW in operation worldwide) \( {}^{10} \)</td></tr></table>
According to the Canada Energy Regulator [51], in 2021 the capacity cost for a geothermal power plant was estimated between US $4,500 to$ 6,050 per kilowatt (kW) of capacity, and the levelized cost of energy - US$56 to $93 per megawatt hour (MWh).
Geothermal plants, like hydroelectric and nuclear plants, are capital-intensive - in the case of near-hydrothermal and deep EGS plants, far more so than wind or solar installations [13]. However, as noted earlier, these plants can often be built out incrementally, starting with a small pilot plant and then scaling up. This option is not available with nuclear or hydroelectric plants.
In terms of geothermal CAPEX, drilling and well completion dominate the expenditures with on average 54 percent of all capital costs (see Fig. 4.4.1 [13, 52]):
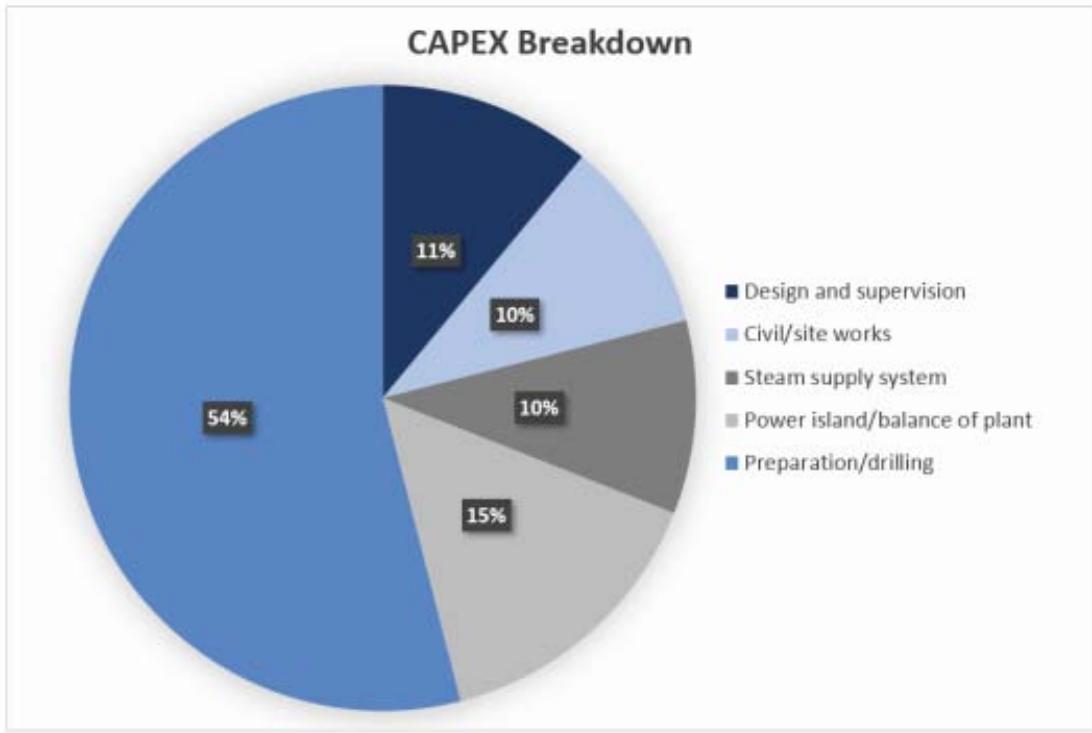
Fig. 4.4.1: CAPEX breakdown for geothermal projects (based on data from Belyakov 2019 [13, 52])
From environmental risk angle geothermal plants produce significantly less footprint and related landscape disturbance than solar, wind, and hydroelectricity indicating much smaller risks to lands
and ecosystems. Power density (in watts generated per square meter of power plant footprint) of competing clean electricity technologies is presented in Table 4.4.2 below [13]:
Table 4.4.2: Comparative Power densities of selected net-zero energy sources [13, 53]
<table><tr><td>Electricity source</td><td>Range of power density \( \left( {\mathrm{W}/{\mathrm{m}}^{2}}\right) \)</td><td>Mean power density (W/m2)</td></tr><tr><td>Utility-scale PV</td><td>\( {4.2} - {7.5} \)</td><td>5.8</td></tr><tr><td>High-temp geothermal (>250°C)</td><td>1.6 – 8.4</td><td>4.9</td></tr><tr><td>Offshore wind</td><td>\( {2.2} - {6.3} \)</td><td>4.2</td></tr><tr><td>Onshore wind</td><td>\( {2.4} - {3.8} \)</td><td>3.1</td></tr><tr><td>Low-temp geothermal (<250°C)</td><td>0.5 – 2.9</td><td>1.6</td></tr><tr><td>Large hydro</td><td>0.2 – 1.0</td><td>0.5</td></tr><tr><td>Oil crops</td><td>N/A</td><td>0.2</td></tr><tr><td>Wood crops</td><td>N/A</td><td>0.2</td></tr></table>
## v. Geothermal Fuel vision in North America
### a. United States
On September 8th, 2022, the Enhanced Geothermal Shot was announced in Houston, Texas. Its target is to reduce the cost of EGS by $90\%$, to $\$45$ per megawatt hour by 2035.
The Enhanced Geothermal Shot is part of the U.S. Department of Energy's Earthshots™ Initiative to tackle key remaining technical challenges to reaching
U.S. climate goals and leverage economic opportunities [44, 45, 54].
While today a small portion of the geothermal energy is accessible with current technology in the U.S., research and innovation to advance enhanced geothermal systems (EGS), which create human-made reservoirs to access energy, is expected to unlock geothermal resources and put new, clean, dispatchable electricity on the grid.
According to the Advanced Technology Innovation approach considered with substantial drilling and EGS advancements, EGS power plants are assumed to be built with 100 MW of capacity to maximize project efficiency [54]. Based on GeoVision Analysis [55,56] EGS future growth is forecast.
Three scenarios are considered in this analysis: Business-as-Usual (BAU), Improved Regulatory Timeline (IRT) and Technology Improvement (TI). In the BAU scenario, installed geothermal capacity increases from 2,542 MWe in 2016 to 5,924 MWe by 2050. The IRT scenario estimates 12,891 MWe of total installed geothermal capacity by 2050. In the TI scenario, total installed geothermal capacity reaches 60,701 MWe by 2050.
As of 2019, developing, testing, and accelerating breakthroughs in EGS technologies to advance the uptake of geothermal resources has been led by the Frontier Observatory for Research in Geothermal Energy - Utah FORGE, a dedicated underground field laboratory sponsored by the U.S. Department of Energy. Working in coordination with Utah FORGE, in July 2023 Fervo Energy announced that it successfully completed a full-scale well test in Nevada that confirmed the commercial viability of its next-generation technology (see Fig. 4.5.1, 4.5.2). A next-generation geothermal plant backed by Google has started sending carbon-free electricity to the grid in Nevada, where the tech company operates some of its massive data centers [57].
Fig. 4.5.1: Fervo Energy's 3.5-megawatt enhanced geothermal plant in Nevada. Credits to Google/Fervo Energy
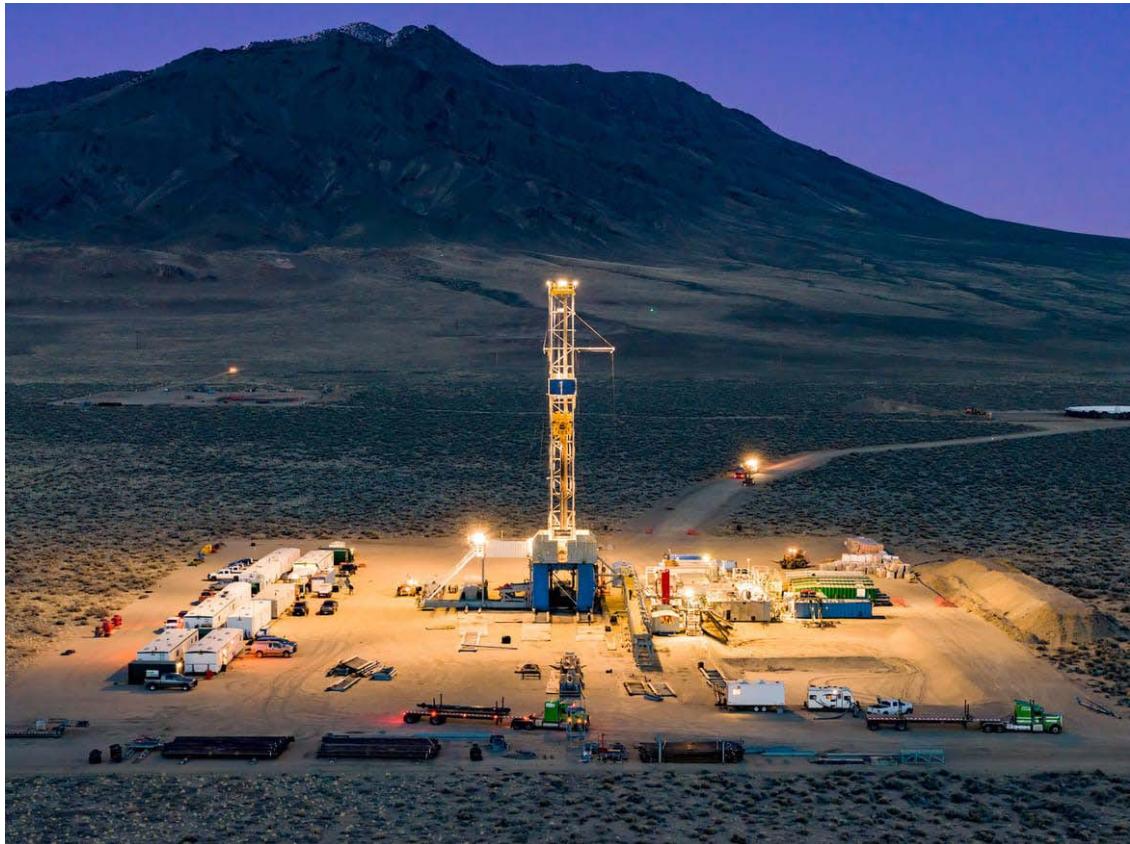
Fig. 4.5.2: Fervo uses horizontal drilling techniques to tap the earth's heat. Credits to Fervo Energy
### b. Canada
The Government of Canada is advancing the country's transition to a low-carbon economy in Canada through strategic investments and innovative partnerships including geothermal energy.
In June 2022, federal funding was provided to Novus Earth to execute a front-end engineering design (FEED) study for the Latitude 53 geothermal energy project with a closed-loop enhanced geothermal system in the community of Hinton, Alberta. This investment was provided by Natural Resources Canada's Smart Renewables and Electrification Pathways (SREPs) program that provides support for smart renewable energy and electrical grid modernization projects.
In October 2023, Eavor Technologies Inc. (Eavor), Calgary, Alberta, a pioneer in the field of advanced geothermal energy solutions, announced the successful completion of $182 million in financing of its Eavor-Loop™ enhanced geothermal system solution. This significant investment will enable Eavor to accelerate the development and deployment of its revolutionary geothermal technology. The equity round was led by OMV AG, with participation from Canada Growth Fund ("CGF"), Japan Energy Fund, Monaco Asset Management and Microsoft's Climate Innovation Fund as well as from existing investors.
In February 2024 Eavor announced a significant add-on investment from Kajima Corporation, one of Japan's construction giants [58]. This strategic alliance
promises to accelerate the global transition to sustainable energy by facilitating the expansion of Eavor's innovative technology across various sectors (see Fig. 4.5.3).
Fig. 4.5.3: Eavor Technologies Secures Major Investment from Kajima for Geothermal Advancement [57]. Credits to Eavor Energy
As Canada's federal government is increasing its support of geothermal technology, provincial advances in geothermal are also matching this growth. Specifically, Alberta is strengthening its position to lead development and deployment and attract investment in geothermal industry with a natural geographical advantage, leadership in drilling technology, and extensive oil and gas expertise [59]. Geothermal Resource Tenure Regulation in Alberta [60] today is the primary regulation that deals with the tenure of geothermal leases in Alberta. This new regulation, and amendments to other regulations, took effect on January 1, 2022.
Also, while geothermal development efforts are growing in Canadian provinces, research is underway in Canada's three territories: Yukon, Northwest Territories and Nunavut, to assess geothermal resources of target communities [14]. This includes deep geothermal systems as a long-term objective that may provide sufficient energy to meet communities' heavy heating needs. Results suggest that geothermal technologies can provide important carbon reductions and are economically attractive.
## IV. CONCLUSIONS AND RECOMMENDATIONS
1. Clean Grid readiness is a major objective of Canada's Clean Grid 2035 achievements and commitment to make all electricity generation in the country carbon net-zero. Making all the sources of electricity in power grids clean will make a
tremendous step in Canada's energy transition and low carbon economy growth.
2. A major effort in cleaning the grid within a decade is focused on decarbonizing power generation in three provinces historically using fossil fuels for growth: Alberta, Saskatchewan, and Nova Scotia.
An outstanding undertaking in cleaning energy generation mix in these three provinces is deploying variable renewables – wind and solar power at very large scale in the country. In the Canada NetZero scenario of energy future presented by Canada Energy Regulator, total capacity of variable renewables in Alberta, Saskatchewan, and Nova Scotia by 2035 is 27.9GW (49% of 56.7 GW) of wind power and 15.6 GW (59% of 26.4 GW) in Canada, and these variable renewables will generate 104TWh (50% of 207.5 TWh) of wind and 29 TWh (64% of 45TWh) of solar power in the country.
3. Deploying very large scale of variable renewables in Canada requires an extremely significant power dispatchability effort, allowing the country's power grids to maintain their reliability. Clean Grid 2035 commitment also assumes that all existing and new power dispatchability sources in Canada backing up variable renewables' operations are clean.
4. Choosing to have the renewable segment of clean dispatchability sources lead in Canada's Clean Grid efforts and creating renewable dispatchable fleets will make all variable renewables in the country dispatchable. This would make a tremendous change in upgrading Canada's power grids and its contribution to low carbon economy in general.
5. Canada is capable and committed to making this leadership change in dispatchability of variable renewables.
Indeed, Canada's electricity systems historically had been built on extremely strong reservoir-based hydro power in Newfoundland and Labrador, Quebec, Manitoba. These renewable dispatchable resources can be used to back up variable renewables' growth in Alberta, Saskatchewan, and Nova Scotia, and in the country in general.
Canada is also geographically built on geothermal resources. Geothermal resources in the Pacific Rim including the regions of northeastern British Columbia and southern Yukon, northern Alberta and southern Northwest Territories bring very high potential for highly dispatchable electricity generation. Due to their unique position in Western Canada, deep geothermal resources allow for deploying Enhanced Geothermal Systems (EGS) for electricity generation at high scale. Capabilities of Enhanced Geothermal power plants based on very high (90%) capacity factor and dispatchability will provide variable dispatchability reserves in Western Canada that will strengthen and support Canada's Clean Grid 2035 efforts. As a part of these leadership efforts, Canada must catch up with the U.S. in positioning and developing EGS partnerships and investments.
As Canada's federal government is increasing its support of geothermal technology, provincial advances in Enhanced Geothermal Systems led by Canadian clean technology companies such as Eavor Technologies Inc. are also matching this growth.
6. Opportunities with current and growing Clean Grid efforts may allow for changing the role of reservoir-based hydro power in Canada from electricity export-oriented to variable renewables dispatchability support-oriented. Backing up the growth of variable renewables will in turn allow for growing export of electricity in Eastern Canada (from offshore fleets in the Atlantic Rim such as Sable Island) and in Western Canada (from geothermal plants in the Pacific Rim such as in northern Alberta).
7. Comparison of the dispatchability reserves sources and needs for variable renewables shows that there is a clear gap between the sources and required uses in variable dispatchability reserves, and solutions should be discussed and agreed on to address this dispatchability gap.
Examples describing possible realization of the Clean Dispatchability Reserves Strategy in Eastern and Western Canada, using interchange capacity as a source for variable dispatchability reserves, are presented in Section 3 of this paper. They show that dispatchable hydropower resources in Eastern
Canada (such as Newfoundland and Labrador, and Quebec) can provide variable dispatchability reserves for grid planning support for the Maritimes but are not sufficient for addressing the clean dispatchability reserves needs of variable capacity in Ontario (see Tables 3.4.1-3.4.3). However, this may be addressed in 2030 and 2035 by receiving dispatchability reserves support from Manitoba. However, should Manitoba provide its export-oriented capacity as clean dispatchability reserves to Ontario or sell electricity into the U.S., dispatchability reserves would be needed for Saskatchewan, Alberta, and British Columbia (see Table 3.4.8).
8. The approach proposed here to using hydropower as a variable dispatchability reserve for Eastern Canada and combining hydropower and geothermal power as dispatchability reserves for Western Canada will make variable renewables dispatchable, upgrading all power grids in Canada to $100\%$ Clean Grid readiness by 2035 and maintaining this Clean Grid commitment in 2050 and beyond. Using dispatchable hydropower and geothermal power together with wind and solar power in Renewable Dispatchable Fleets in Alberta, Saskatchewan and Nova Scotia would make all renewable capacity in these provinces dispatchable, establishing leading clean dispatchability practices in North America. It is an opportunity for Dispatchable Integrated Renewable Fleets present in all Canadian provinces.
9. To agree on renewable dispatchable fleets deployment and existing dispatchability reserves commitments from the provinces owning and operating large scale reservoir-based hydro power plants, Canada's "electric federalism" concept and approach should be demonstrated efficiently and promptly. A summary of Variable Dispatchability Reserves needed in Canada and their growth in 2025-2035 in NetZero scenario is shown in Section 2 of this paper. It brings attention to economic pricing solutions for hydro dispatchability assets in Manitoba, Quebec, and Newfoundland and Labrador.
10. Scaling up clean electricity generation to meet Clean Grid 2035 objectives means leveraging and promptly deploying strategic solutions Canada has at hand. Although the future of energy in Canada is broader than the economic and technical factors driving the projections in EF2023, some of these factors such as Renewable Dispatchability Reserves for variable renewables, and highly dispatchable Enhanced Geothermal systems and technologies require critical attention and should be very promptly addressed as they touch very sensitive decisions of Canadian provinces and realities of electric federalism in Canada.
## ACKNOWLEDGMENTS AND CONFLICTS OF INTEREST
Acknowledgments: The author is extremely grateful to Marlene Moore for the concept discussions supporting the vision expressed in the manuscript.
The author is also much obliged to John Harker for his strategic review of the manuscript and for thoughtful editing.
Conflicts of Interest: The author declares no conflict of interest.
Appendix A: Electricity Futures by Province - Summary of the CER Findings (based on EF2023data [21])
Newfoundland and Labrador
<table><tr><td>Newfoundland and Labrador, TWh</td><td>2025</td><td>2026</td><td>2027</td><td>2028</td><td>2029</td><td>2030</td><td>2031</td><td>2032</td><td>2033</td><td>2034</td><td>2035</td></tr><tr><td colspan="12">Demand</td></tr><tr><td>Canada Net-Zero</td><td>12.5</td><td>12.6</td><td>12.8</td><td>12.9</td><td>13.1</td><td>13.2</td><td>13.3</td><td>13.3</td><td>13.4</td><td>13.5</td><td>13.5</td></tr><tr><td>Current Measures</td><td>12.3</td><td>12.4</td><td>12.5</td><td>12.5</td><td>12.6</td><td>12.7</td><td>12.7</td><td>12.8</td><td>12.8</td><td>12.9</td><td>13.0</td></tr><tr><td colspan="12">Generation</td></tr><tr><td>Canada Net-Zero</td><td>45.4</td><td>45.4</td><td>45.5</td><td>45.7</td><td>45.7</td><td>45.6</td><td>45.7</td><td>45.8</td><td>45.8</td><td>45.9</td><td>46.0</td></tr><tr><td>Current Measures</td><td>45.1</td><td>45.2</td><td>45.2</td><td>45.3</td><td>45.3</td><td>45.2</td><td>45.2</td><td>45.3</td><td>45.3</td><td>45.3</td><td>45.3</td></tr><tr><td colspan="12">Interchanges</td></tr><tr><td>Canada Net-Zero</td><td>32.3</td><td>32.2</td><td>32.1</td><td>32.1</td><td>31.9</td><td>31.7</td><td>31.7</td><td>31.6</td><td>31.5</td><td>31.4</td><td>31.3</td></tr><tr><td>Current Measures</td><td>32.6</td><td>32.6</td><td>32.5</td><td>32.6</td><td>32.4</td><td>32.3</td><td>32.3</td><td>32.2</td><td>32.2</td><td>32.2</td><td>32.2</td></tr></table>
Prince Edward Island
<table><tr><td>Prince Edward Island, TWh</td><td>2025</td><td>2026</td><td>2027</td><td>2028</td><td>2029</td><td>2030</td><td>2031</td><td>2032</td><td>2033</td><td>2034</td><td>2035</td></tr><tr><td colspan="12">Demand</td></tr><tr><td>Canada Net-Zero</td><td>1.9</td><td>1.9</td><td>2.0</td><td>2.0</td><td>2.1</td><td>2.2</td><td>2.2</td><td>2.3</td><td>2.4</td><td>2.4</td><td>2.5</td></tr><tr><td>Current Measures</td><td>1.9</td><td>1.9</td><td>2.0</td><td>2.0</td><td>2.0</td><td>2.1</td><td>2.1</td><td>2.2</td><td>2.2</td><td>2.3</td><td>2.3</td></tr><tr><td colspan="12">Generation</td></tr><tr><td>Canada Net-Zero</td><td>1.3</td><td>1.4</td><td>1.5</td><td>1.5</td><td>1.6</td><td>1.7</td><td>1.7</td><td>1.7</td><td>1.7</td><td>1.8</td><td>2.3</td></tr><tr><td>Current Measures</td><td>1.2</td><td>1.3</td><td>1.4</td><td>1.5</td><td>1.6</td><td>1.7</td><td>1.7</td><td>1.8</td><td>1.9</td><td>2.0</td><td>2.2</td></tr><tr><td colspan="12">Interchanges</td></tr><tr><td>Canada Net-Zero</td><td>-0.6</td><td>-0.6</td><td>-0.6</td><td>-0.6</td><td>-0.6</td><td>-0.6</td><td>-0.7</td><td>-0.8</td><td>-0.8</td><td>-0.9</td><td>-0.4</td></tr><tr><td>Current Measures</td><td>-0.7</td><td>-0.7</td><td>-0.6</td><td>-0.6</td><td>-0.6</td><td>-0.5</td><td>-0.5</td><td>-0.4</td><td>-0.4</td><td>-0.4</td><td>-0.2</td></tr></table>
Nova Scotia
<table><tr><td>Nova Scotia, TWh</td><td>2025</td><td>2026</td><td>2027</td><td>2028</td><td>2029</td><td>2030</td><td>2031</td><td>2032</td><td>2033</td><td>2034</td><td>2035</td></tr><tr><td colspan="12">Demand</td></tr><tr><td>Canada Net-Zero</td><td>12.0</td><td>12.3</td><td>12.6</td><td>13.0</td><td>13.4</td><td>13.7</td><td>14.1</td><td>14.4</td><td>14.8</td><td>15.1</td><td>15.5</td></tr><tr><td>Current Measures</td><td>11.8</td><td>12.0</td><td>12.2</td><td>12.5</td><td>12.7</td><td>12.9</td><td>13.1</td><td>13.3</td><td>13.5</td><td>13.7</td><td>13.9</td></tr><tr><td colspan="12">Generation</td></tr><tr><td>Canada Net-Zero</td><td>7.8</td><td>9.6</td><td>11.7</td><td>13.0</td><td>13.9</td><td>14.1</td><td>15.8</td><td>17.6</td><td>19.1</td><td>20.4</td><td>21.7</td></tr><tr><td>Current Measures</td><td>7.8</td><td>8.4</td><td>9.1</td><td>9.4</td><td>9.5</td><td>9.5</td><td>9.6</td><td>9.9</td><td>10.0</td><td>10.0</td><td>10.1</td></tr><tr><td colspan="12">Interchanges</td></tr><tr><td>Canada Net-Zero</td><td>-5.0</td><td>-3.5</td><td>-1.8</td><td>-0.9</td><td>-0.4</td><td>-0.7</td><td>0.6</td><td>1.8</td><td>2.8</td><td>3.5</td><td>4.1</td></tr><tr><td>Current Measures</td><td>-4.7</td><td>-4.5</td><td>-4.0</td><td>-3.9</td><td>-4.0</td><td>-4.2</td><td>-4.4</td><td>-4.3</td><td>-4.4</td><td>-4.6</td><td>-4.6</td></tr></table>
New Brunswick
<table><tr><td>New Brunswick, TWh</td><td>2025</td><td>2026</td><td>2027</td><td>2028</td><td>2029</td><td>2030</td><td>2031</td><td>2032</td><td>2033</td><td>2034</td><td>2035</td></tr><tr><td colspan="12">Demand</td></tr><tr><td>Canada Net-Zero</td><td>15.7</td><td>15.8</td><td>16.0</td><td>16.3</td><td>16.6</td><td>16.8</td><td>17.0</td><td>17.2</td><td>17.5</td><td>17.7</td><td>18.0</td></tr><tr><td>Current Measures</td><td>15.3</td><td>15.5</td><td>15.6</td><td>15.8</td><td>16.0</td><td>16.2</td><td>16.4</td><td>16.5</td><td>16.7</td><td>16.9</td><td>17.1</td></tr><tr><td colspan="12">Generation</td></tr><tr><td>Canada Net-Zero</td><td>12.3</td><td>12.1</td><td>12.1</td><td>11.0</td><td>11.0</td><td>10.1</td><td>11.0</td><td>12.0</td><td>13.1</td><td>13.8</td><td>14.6</td></tr><tr><td>Current Measures</td><td>12.0</td><td>12.2</td><td>12.4</td><td>11.2</td><td>11.2</td><td>10.0</td><td>11.0</td><td>12.1</td><td>13.2</td><td>14.2</td><td>15.0</td></tr><tr><td colspan="12">Interchanges</td></tr><tr><td>Canada Net-Zero</td><td>-4.0</td><td>-4.3</td><td>-4.6</td><td>-6.1</td><td>-6.4</td><td>-7.6</td><td>-7.0</td><td>-6.4</td><td>-5.8</td><td>-5.4</td><td>-5.2</td></tr><tr><td>Current Measures</td><td>-4.3</td><td>-4.2</td><td>-4.2</td><td>-5.6</td><td>-5.9</td><td>-7.1</td><td>-6.3</td><td>-5.4</td><td>-4.4</td><td>-3.6</td><td>-3.0</td></tr></table>
Quebec
<table><tr><td>Quebec, TWh</td><td>2025</td><td>2026</td><td>2027</td><td>2028</td><td>2029</td><td>2030</td><td>2031</td><td>2032</td><td>2033</td><td>2034</td><td>2035</td></tr><tr><td colspan="12">Demand</td></tr><tr><td>Canada Net-Zero</td><td>214.2</td><td>218.2</td><td>221.4</td><td>224.6</td><td>228.3</td><td>231.8</td><td>235.2</td><td>238.5</td><td>241.6</td><td>244.5</td><td>247.1</td></tr><tr><td>Current Measures</td><td>215.8</td><td>219.5</td><td>222.8</td><td>225.9</td><td>229.7</td><td>233.2</td><td>236.6</td><td>239.8</td><td>242.9</td><td>245.8</td><td>248.8</td></tr><tr><td colspan="12">Generation</td></tr><tr><td>Canada Net-Zero</td><td>234.7</td><td>243.7</td><td>250.4</td><td>257.3</td><td>261.9</td><td>266.9</td><td>270.8</td><td>273.1</td><td>275.3</td><td>277.6</td><td>283.9</td></tr><tr><td>Current Measures</td><td>235.6</td><td>244.2</td><td>250.7</td><td>257.8</td><td>262.3</td><td>268.9</td><td>271.2</td><td>274.1</td><td>277.6</td><td>281.8</td><td>285.3</td></tr><tr><td colspan="12">Interchanges</td></tr><tr><td>Canada Net-Zero</td><td>6.1</td><td>10.7</td><td>13.6</td><td>16.8</td><td>17.0</td><td>17.9</td><td>16.4</td><td>14.9</td><td>13.3</td><td>12.0</td><td>15.0</td></tr><tr><td>Current Measures</td><td>4.2</td><td>8.5</td><td>11.0</td><td>14.5</td><td>14.6</td><td>17.1</td><td>15.6</td><td>15.2</td><td>15.2</td><td>16.1</td><td>16.5</td></tr></table>
Ontario
<table><tr><td>Ontario, TWh</td><td>2025</td><td>2026</td><td>2027</td><td>2028</td><td>2029</td><td>2030</td><td>2031</td><td>2032</td><td>2033</td><td>2034</td><td>2035</td></tr><tr><td colspan="12">Demand</td></tr><tr><td>Canada Net-Zero</td><td>155.8</td><td>161.6</td><td>168.0</td><td>174.6</td><td>182.6</td><td>190.1</td><td>198.3</td><td>207.2</td><td>216.7</td><td>226.3</td><td>235.5</td></tr><tr><td>Current Measures</td><td>156.0</td><td>159.8</td><td>164.0</td><td>167.9</td><td>172.7</td><td>176.9</td><td>181.0</td><td>185.1</td><td>189.4</td><td>193.7</td><td>198.4</td></tr><tr><td colspan="12">Generation</td></tr><tr><td>Canada Net-Zero</td><td>146.2</td><td>148.4</td><td>153.0</td><td>161.1</td><td>167.1</td><td>180.2</td><td>193.1</td><td>208.8</td><td>223.6</td><td>241.4</td><td>254.1</td></tr><tr><td>Current Measures</td><td>148.4</td><td>150.6</td><td>153.1</td><td>157.8</td><td>159.8</td><td>164.3</td><td>167.0</td><td>172.1</td><td>174.8</td><td>179.5</td><td>182.1</td></tr><tr><td colspan="12">Interchanges</td></tr><tr><td>Canada Net-Zero</td><td>-2.4</td><td>-6.3</td><td>-8.9</td><td>-8.8</td><td>-11.9</td><td>-9.1</td><td>-11.5</td><td>-10.3</td><td>-10.8</td><td>-8.8</td><td>-12.7</td></tr><tr><td>Current Measures</td><td>-0.5</td><td>-3.1</td><td>-4.5</td><td>-3.7</td><td>-5.9</td><td>-4.9</td><td>-6.2</td><td>-5.5</td><td>-7.2</td><td>-7.1</td><td>-9.2</td></tr></table>
Manitoba
<table><tr><td>Manitoba, TWh</td><td>2025</td><td>2026</td><td>2027</td><td>2028</td><td>2029</td><td>2030</td><td>2031</td><td>2032</td><td>2033</td><td>2034</td><td>2035</td></tr><tr><td colspan="12">Demand</td></tr><tr><td>Canada Net-Zero</td><td>24.2</td><td>24.7</td><td>25.4</td><td>26.1</td><td>26.9</td><td>27.6</td><td>28.4</td><td>29.2</td><td>30.1</td><td>31.0</td><td>31.8</td></tr><tr><td>Current Measures</td><td>24.3</td><td>24.7</td><td>25.1</td><td>25.6</td><td>26.1</td><td>26.6</td><td>27.0</td><td>27.4</td><td>27.9</td><td>28.3</td><td>28.7</td></tr><tr><td colspan="12">Generation</td></tr><tr><td>Canada Net-Zero</td><td>31.4</td><td>32.3</td><td>34.5</td><td>35.5</td><td>40.8</td><td>42.1</td><td>43.1</td><td>44.4</td><td>45.6</td><td>46.9</td><td>52.3</td></tr><tr><td>Current Measures</td><td>31.5</td><td>32.1</td><td>33.8</td><td>34.2</td><td>38.4</td><td>38.9</td><td>39.3</td><td>39.8</td><td>40.1</td><td>40.3</td><td>40.7</td></tr><tr><td colspan="12">Interchanges</td></tr><tr><td>Canada Net-Zero</td><td>11.3</td><td>11.6</td><td>14.5</td><td>14.6</td><td>18.5</td><td>18.6</td><td>18.3</td><td>18.2</td><td>18.0</td><td>17.6</td><td>21.7</td></tr><tr><td>Current Measures</td><td>11.3</td><td>11.5</td><td>14.3</td><td>14.2</td><td>17.5</td><td>17.5</td><td>17.4</td><td>17.4</td><td>17.2</td><td>17.0</td><td>16.9</td></tr></table>
Saskatchewan
<table><tr><td>Saskatchewan, TWh</td><td>2025</td><td>2026</td><td>2027</td><td>2028</td><td>2029</td><td>2030</td><td>2031</td><td>2032</td><td>2033</td><td>2034</td><td>2035</td></tr><tr><td colspan="12">Demand</td></tr><tr><td>Canada Net-Zero</td><td>26.1</td><td>26.9</td><td>27.7</td><td>28.5</td><td>29.4</td><td>30.3</td><td>31.3</td><td>32.4</td><td>33.7</td><td>35.1</td><td>36.4</td></tr><tr><td>Current Measures</td><td>27.0</td><td>27.6</td><td>28.1</td><td>28.4</td><td>29.0</td><td>29.4</td><td>29.9</td><td>30.3</td><td>30.7</td><td>31.2</td><td>31.7</td></tr><tr><td colspan="12">Generation</td></tr><tr><td>Canada Net-Zero</td><td>25.8</td><td>26.5</td><td>27.5</td><td>27.9</td><td>28.8</td><td>29.8</td><td>31.8</td><td>33.2</td><td>34.8</td><td>36.9</td><td>35.4</td></tr><tr><td>Current Measures</td><td>26.6</td><td>27.6</td><td>28.0</td><td>27.6</td><td>28.1</td><td>28.4</td><td>28.9</td><td>29.3</td><td>29.8</td><td>30.4</td><td>30.8</td></tr><tr><td colspan="12">Interchanges</td></tr><tr><td>Canada Net-Zero</td><td>-2.1</td><td>-2.1</td><td>-2.0</td><td>-2.3</td><td>-2.3</td><td>-2.2</td><td>-2.5</td><td>-2.6</td><td>-2.6</td><td>-2.3</td><td>-5.4</td></tr><tr><td>Current Measures</td><td>-2.2</td><td>-2.3</td><td>-2.3</td><td>-3.1</td><td>-3.2</td><td>-3.3</td><td>-3.3</td><td>-3.3</td><td>-3.3</td><td>-3.2</td><td>-3.2</td></tr></table>
Alberta
<table><tr><td>Alberta, TWh</td><td>2025</td><td>2026</td><td>2027</td><td>2028</td><td>2029</td><td>2030</td><td>2031</td><td>2032</td><td>2033</td><td>2034</td><td>2035</td></tr><tr><td colspan="12">Demand</td></tr><tr><td>Canada Net-Zero</td><td>81.6</td><td>83.5</td><td>87.5</td><td>90.3</td><td>93.7</td><td>97.1</td><td>101.9</td><td>105.6</td><td>109.3</td><td>113.3</td><td>117.2</td></tr><tr><td>Current Measures</td><td>83.8</td><td>85.1</td><td>87.6</td><td>88.9</td><td>90.6</td><td>92.2</td><td>95.0</td><td>96.4</td><td>97.9</td><td>99.5</td><td>100.6</td></tr><tr><td colspan="12">Generation</td></tr><tr><td>Canada Net-Zero</td><td>90.4</td><td>92.4</td><td>96.1</td><td>100.0</td><td>103.4</td><td>106.8</td><td>112.9</td><td>116.5</td><td>119.3</td><td>122.3</td><td>128.5</td></tr><tr><td>Current Measures</td><td>93.0</td><td>95.3</td><td>98.3</td><td>101.3</td><td>103.8</td><td>105.7</td><td>108.3</td><td>109.5</td><td>110.8</td><td>112.0</td><td>112.4</td></tr><tr><td colspan="12">Interchanges</td></tr><tr><td>Canada Net-Zero</td><td>4.7</td><td>5.2</td><td>5.2</td><td>6.5</td><td>6.9</td><td>7.1</td><td>6.3</td><td>5.9</td><td>4.8</td><td>3.7</td><td>6.2</td></tr><tr><td>Current Measures</td><td>4.7</td><td>5.3</td><td>5.8</td><td>7.5</td><td>8.5</td><td>8.9</td><td>8.9</td><td>9.2</td><td>9.4</td><td>9.3</td><td>9.1</td></tr></table>
British Columbia
<table><tr><td>British Columbia, TWh</td><td>2025</td><td>2026</td><td>2027</td><td>2028</td><td>2029</td><td>2030</td><td>2031</td><td>2032</td><td>2033</td><td>2034</td><td>2035</td></tr><tr><td colspan="12">Demand</td></tr><tr><td>Canada Net-Zero</td><td>70.7</td><td>73.4</td><td>75.9</td><td>79.0</td><td>84.5</td><td>89.4</td><td>92.2</td><td>94.9</td><td>97.3</td><td>99.7</td><td>101.9</td></tr><tr><td>Current Measures</td><td>69.5</td><td>71.9</td><td>73.8</td><td>76.3</td><td>79.4</td><td>82.1</td><td>84.1</td><td>87.4</td><td>90.6</td><td>92.4</td><td>94.1</td></tr><tr><td colspan="12">Generation</td></tr><tr><td>Canada Net-Zero</td><td>72.7</td><td>73.6</td><td>74.9</td><td>75.9</td><td>80.4</td><td>84.3</td><td>88.9</td><td>92.1</td><td>95.3</td><td>98.8</td><td>96.0</td></tr><tr><td>Current Measures</td><td>72.4</td><td>73.4</td><td>74.1</td><td>74.8</td><td>77.0</td><td>78.8</td><td>80.9</td><td>83.9</td><td>86.4</td><td>88.2</td><td>89.6</td></tr><tr><td colspan="12">Interchanges</td></tr><tr><td>Canada Net-Zero</td><td>3.7</td><td>2.6</td><td>2.0</td><td>0.4</td><td>-0.1</td><td>-0.6</td><td>0.6</td><td>1.1</td><td>1.7</td><td>2.6</td><td>-2.5</td></tr><tr><td>Current Measures</td><td>-0.9</td><td>-2.2</td><td>-3.1</td><td>-4.6</td><td>-5.3</td><td>-5.9</td><td>-5.7</td><td>-5.9</td><td>-6.5</td><td>-6.3</td><td>-6.4</td></tr></table>
Appendix B: Electricity Generation Data by Fuel for Alberta, Saskatchewan, and Nova Scotia (based on Canada Future 2023 data)
### Alberta
In NetZero scenario, wind power deployment will include 750 MW in 2025, 313 MW per year in 2026-2030, and very powerful 2285 MW per year deployment in 2031-2035. Solar power deployment will include 150 MW per year in 2026-2030, and 2216 MW per year in
2031-2035. Uranium SMR will be deployed at 91.8 MW per year in 2031-2035.
In Current Measures scenario, wind power deployment of 900 MW in 2028, and solar power deployment of 231 MW in 2026, and 400 MW per year
(2000 MW total) in 2031-2035. No Uranium SMR deployment expected.
<table><tr><td rowspan="2">Alberta
Generation, TWh</td><td colspan="3">Canada
NetZero</td><td colspan="3">Current
Measures</td></tr><tr><td>2025</td><td>2030</td><td>2035</td><td>2025</td><td>2030</td><td>2035</td></tr><tr><td>Coal and Coke</td><td>0</td><td>0</td><td>0</td><td>0.00</td><td>0.00</td><td>0.00</td></tr><tr><td>Solar (Distributed)</td><td>0.33</td><td>0.76</td><td>1.51</td><td>0.28</td><td>0.45</td><td>0.83</td></tr><tr><td>Solar (Utility scale)</td><td>2.09</td><td>3.47</td><td>23.98</td><td>2.66</td><td>2.66</td><td>6.48</td></tr><tr><td>Onshore Wind</td><td>16.05</td><td>21.53</td><td>65.15</td><td>10.16</td><td>14.17</td><td>14.17</td></tr><tr><td>Hydro</td><td>1.65</td><td>1.65</td><td>1.35</td><td>1.65</td><td>1.65</td><td>1.65</td></tr><tr><td>Hydrogen</td><td>0.00</td><td>0.00</td><td>0.00</td><td>0.00</td><td>0.00</td><td>0.00</td></tr><tr><td>Bioenergy</td><td>1.41</td><td>1.60</td><td>1.04</td><td>1.59</td><td>1.19</td><td>0.86</td></tr><tr><td>Uranium SMR</td><td>0.00</td><td>0.00</td><td>3.20</td><td>0.00</td><td>0.00</td><td>0.00</td></tr><tr><td>Bioenergy with CCUS</td><td>0.00</td><td>0.00</td><td>5.74</td><td>0.00</td><td>0.00</td><td>0.00</td></tr><tr><td>Natural Gas</td><td>68.85</td><td>66.07</td><td>5.28</td><td>76.65</td><td>85.61</td><td>88.40</td></tr><tr><td>Natural Gas with CCUS</td><td>0.00</td><td>11.70</td><td>21.23</td><td>0.00</td><td>0.00</td><td>0.00</td></tr><tr><td>Oil</td><td>0.02</td><td>0.00</td><td>0.00</td><td>0.02</td><td>0.00</td><td>0.00</td></tr><tr><td>Total, including:</td><td>90.39</td><td>106.78</td><td>128.49</td><td>93.01</td><td>105.74</td><td>112.39</td></tr><tr><td>Clean Generation, TWh</td><td>20.12</td><td>39.11</td><td>122.17</td><td>14.75</td><td>18.93</td><td>23.13</td></tr><tr><td>Clean Generation, %</td><td>22.3%</td><td>36.6%</td><td>95.1%</td><td>15.9%</td><td>17.9%</td><td>20.6%</td></tr><tr><td>Non-Clean Generation, TWh</td><td>70.27</td><td>67.67</td><td>6.32</td><td>78.25</td><td>86.80</td><td>89.26</td></tr><tr><td>Non-Clean Generation, %</td><td>77.7%</td><td>63.4%</td><td>4.9%</td><td>84.1%</td><td>82.1%</td><td>79.4%</td></tr></table>
#### Saskatchewan
In NetZero scenario, wind power deployment expects a huge push of 1468 MW in 2024, 450MW in 2025, followed by 170 MW per year in 2026-2030, and 340 MW per year in 2031-2035. This is followed by solar power deployment: 20 MW in 2025, 32 MW in 2030, and then 270 MW per year in 2031-2035. Uranium SMR will be deployed at 214 MW per year from 2031 to 2035.
In Current Measures scenario, the same push of 1468 MW is indicated in 2024, 106 MW in 2025, 167 MW per year in 2026-2030, and 109 MW per year in 2031-2035 (209 MW in 2034). Solar power deployment will plan 32 MW in 2030, and 143 MW per year in 2031-2035
(53% of what is planned in NetZero). No Uranium SMR deployment expected.
#### Nova Scotia
In NetZero scenario, wind power will be deployed at 400 MW per year in 2026 to 2030, and then at 600 MW per year in 2031-2035.
In Current Measures scenario, wind power will increase annually by 38.5 MW per year from 2026 to 2030 and will continue growing: from 128.3 MW per year in 2031 to 122.5 MW per year in 2035.
No Uranium SMR deployment is expected in both scenarios.
<table><tr><td rowspan="2">Nova Scotia
Generation, TWh</td><td colspan="3">Canada
NetZero</td><td colspan="3">Current
Measures</td></tr><tr><td>2025</td><td>2030</td><td>2035</td><td>2025</td><td>2030</td><td>2035</td></tr><tr><td>Coal and Coke</td><td>3.34</td><td>0.00</td><td>0.00</td><td>3.34</td><td>0.00</td><td>0.00</td></tr><tr><td>Solar (Distributed)</td><td>0.00</td><td>0.01</td><td>0.02</td><td>0.00</td><td>0.01</td><td>0.01</td></tr><tr><td>Solar (Utility scale)</td><td>0.00</td><td>0.00</td><td>0.00</td><td>0.00</td><td>0.00</td><td>0.00</td></tr><tr><td>Offshore Wind</td><td>0.00</td><td>10.03</td><td>19.46</td><td>0.00</td><td>0.00</td><td>0.00</td></tr><tr><td>Onshore Wind</td><td>2.16</td><td>2.11</td><td>1.89</td><td>2.16</td><td>2.35</td><td>2.98</td></tr><tr><td>Hydro</td><td>0.98</td><td>0.87</td><td>0.23</td><td>0.98</td><td>0.99</td><td>0.99</td></tr><tr><td>Oil</td><td>0.00</td><td>0.00</td><td>0.00</td><td>1.23</td><td>5.82</td><td>5.67</td></tr><tr><td>Natural Gas</td><td>1.16</td><td>0.81</td><td>0.03</td><td>0.00</td><td>0.00</td><td>0.00</td></tr><tr><td>Bioenergy</td><td>0.15</td><td>0.27</td><td>0.04</td><td>0.10</td><td>0.33</td><td>0.36</td></tr><tr><td>Total, including:</td><td>7.79</td><td>14.10</td><td>21.66</td><td>7.81</td><td>9.49</td><td>10.01</td></tr><tr><td>Clean Generation, TWh</td><td>3.14</td><td>13.03</td><td>21.59</td><td>6.48</td><td>3.35</td><td>3.98</td></tr><tr><td>Clean Generation, %</td><td>40.3%</td><td>92.4%</td><td>99.7%</td><td>83.0%</td><td>35.2%</td><td>39.8%</td></tr><tr><td>Non-Clean Generation, TWh</td><td>4.65</td><td>1.07</td><td>0.07</td><td>1.33</td><td>6.15</td><td>6.03</td></tr><tr><td>Non-Clean Generation, %</td><td>59.7%</td><td>7.6%</td><td>0.3%</td><td>17.0%</td><td>64.8%</td><td>60.2%</td></tr></table>
Generating HTML Viewer...
References
50 Cites in Article
(2023). Minister Guilbeault highlights the big five new Clean Investment Tax Credits in Budget 2023 to support sustainable made-in-Canada clean economy.
(2024). Net-zero emissions by.
N Canada (2023). Powering Canada Forward: Building a clean, affordable, and reliable electricity system for every region of Canada.
Travis Carpenter (2023). Health Policy Trends: Regulations and Hospital Capacity.
Vasilii Ostin,Kateřina Maršíková (2009). Fostering Employee Sustainability: Competencies Formation for a Resilient Business Environment.
I Sapir,V Semenkov (2024). Churchill falls hydroelectric station in canada.
(2024). Map of the Muskrat Falls Hydroelectric Project..
(2010). Generating Stations, 2007 - Technology.
(2023). Map of Hydroelectric Generating Stations in Manitoba.
John Fannin (2009). Game of British Columbia : with a list of birds and mammals.
S Grasby,D Allen,S Bell,Z Chen,G Ferguson,A Jessop,M Kelman,M Ko,J Majorowicz,M Moore,J Raymond,R Therrien (2012). Geothermal energy resource potential of Canada.
J Majorowicz,M Moore (2008). Enhanced Geothermal Systems (EGS) Potential in the Alberta Basin.
Donnel Malkemus (2024). Geothermometry of Two Cascade Geothermal Systems.
M Miranda,F Comeau,J Raymond,L Gosselin,S Grasby,A Wigston,A Dehghani-Sanij,S Sternbergh,S Perreault (2022). Geothermal resources for energy transition: A review of research undertaken for remote northern Canadian communities.
Jennifer Galloway,R Patterson (2024). Introduction to Traditional Knowledge studies in support of geoscience tools for assessment of metal mining in Northern Canada.
(2024). Principal mineral areas, producing mines, and oil and gas fields in Canada.
Graham (2024). Eavor -the world's first scalable form of clean baseload power.
David Hornsby (2023). Why Canada must seize the moment and launch its long-awaited Africa strategy.
(2024). Energy Canada.
B Harack,B Harack (2016). How can renewables deliver dispatchable power on demand?.
(2024). Electric generation ancillary services.
(2007). Managing the Impacts of Human Activities on Fish Habitat: The Governance, Practices, and Science.
(2024). Ocean thermal energy conversion (OTEC).
Matthew Ascari,Howard Hanson,Lynn Rauchenstein,James Van Zwieten,Desikan Bharathan,Donna Heimiller,Nicholas Langle,George Scott,James Potemra,N Nagurny,Eugene Jansen (2012). Ocean Thermal Extractable Energy Visualization- Final Technical Report on Award DE-EE0002664. October 28, 2012.
No ethics committee approval was required for this article type.
Data Availability
Not applicable for this article.
How to Cite This Article
Alexandre Pavlovski. 2026. \u201cDispatchable Renewables: Selecting a Right Pathway\u201d. Global Journal of Research in Engineering - J: General Engineering GJRE-J Volume 24 (GJRE Volume 24 Issue J1): .
Explore published articles in an immersive Augmented Reality environment. Our platform converts research papers into interactive 3D books, allowing readers to view and interact with content using AR and VR compatible devices.
Your published article is automatically converted into a realistic 3D book. Flip through pages and read research papers in a more engaging and interactive format.
Our website is actively being updated, and changes may occur frequently. Please clear your browser cache if needed. For feedback or error reporting, please email [email protected]
Thank you for connecting with us. We will respond to you shortly.