Changes in soil moisture and temperature can directly influence soil carbon emissions, which can add carbon to the atmosphere and make the greenhouse effect more intense. In this sense, research is needed that contributes to this knowledge and that simulates future scenarios, allowing actions to be taken in advance. Thus, an experiment was set up in which carbon dioxide efflux was collected over a period of one year in three Brazilian biomes, Cerrado, Pantanal, and Cerrado-Amazonian Ecotone, and to verify the influence of soil moisture, leaf area index and litter, multiple regression models were carried out. Correlation analyses were performed, and subsequently, sensitivity analyses were conducted for possible efflux increases owing to 2ºC and 10% decreases or increases in soil temperature and moisture, respectively, simulating possible climate change scenarios. The results showed that of the three study areas, the Cerrado forest was most resistant to changes in these variables, and the correlation between the carbon efflux and the variables, soil temperature and moisture, were positive and significant for Cerrado and Pantanal.
## I. INTRODUCTION
Over the years, there has been a rapid increase in the number of ecosystem warming-related experiments, covering almost all terrestrial biomes, and the results of these studies provide relevant understanding regarding global soil respiration patterns owing to a warming climate (Wang et al., 2014), in that soil respiration plays a crucial role in regulating carbon cycling in terrestrial ecosystems and the atmospheric carbon dioxide $\left(\mathrm{CO}_{2}\right)$ concentration (Yang et al., 2022), and respiratory effluxes of carbon from the soil to the atmosphere are expected to rise with temperature, potentially intensifying future climate warming (Yan et al., 2022).
Carbon cycling in ecosystems occurs depending on the balance between CO2 fixation by plants and losses from respiration or physical removal from the soil. This is contingent on gross primary production and litter decomposition over time (Strong et al., 2017). Additionally, it is influenced by the underground environment, encompassing factors such as root biomass (Søe and Buchmann, 2005) and soil microbial biomass (Neergaard et al., 2002). Therefore, to understand the global carbon cycle, it is necessary to identify the factors that interfere with soil carbon dynamics (Neff and Hooper, 2002). Reportedly, it is expected that average global temperatures will rise $2 - 6^{\circ}\mathrm{C}$ by the end of the century (IPCC, 2007), and this increase may alter soil respiration. Kirshbaum (1995) reported that a rise in temperature by $1^{\circ}\mathrm{C}$ can bring about a $10\%$ increase in carbon emission in regions where the annual mean temperature is $5^{\circ}\mathrm{C}$.
The effect of soil temperature on carbon dioxide efflux has been sufficiently reported (Bond-Lamberty and Thomson, 2010a; Mahecha et al., 2010), and it is well established that temperature increases can stimulate microbial activity. However, for tropical ecosystems, soil moisture has also been identified as a factor that can affect soil carbon dynamics (Davidson et al., 2000; Adachi, 2006), with peak emissions being recorded at the beginning of the wet period (Chou et al., 2008; Borken and Matzner, 2009; Bowling et al., 2011; Nielsen and Ball, 2015; Wang et al., 2019) justified the need for forecast models, based on climate change scenarios.
Soils represent the most significant carbon store in the world (1500 Gt, e.g. $1.5 \times 10^{21} \mathrm{~g}$ ). According to the European Commission (2006), tropical forests contain large amounts of C in vegetation and soil, equivalent to $37\%$ of the global terrestrial C pool (Dixon et al., 1994). In this light, there are several biomes in the Brazilian territory, where it is necessary to evaluate these carbon emissions and the possible variables that influence them. The Amazon rainforest occupies an area of 5.3 million $\mathrm{km}^2$, which accounts for $40\%$ of the global tropical forest area (Aragão et al., 2014). At the southern edge of the Amazon, along a $4500\mathrm{km}$ stretch, the two largest biomes in South America meet, forming the Cerrado-Amazonian Ecotone (Marimon et al., 2006). Ecotones are transition zones between adjacent ecological systems, with a set of characteristics defined by space and time, and by the degree of interaction between the two connected systems (Holland, 2017). In recent years, the region has been altered owing to its economic potential, with advances in agriculture and livestock, resulting in a decrease in the natural vegetated areas, and it is estimated that by 2003, $\sim 15\%$ of the original area of this forest had already been deforested (Soares et al., 2006). The Cerrado biome, which is in the central portion of Brazil, and is characterized by a vegetation gradient divided into forest, Cerrado, and countryside formations, covers an area of approximately 2 million $\mathrm{km}^2$ (Schwieder et al., 2016). The South American Pantanal is the largest flooded area on the planet, encompassing an area of approximately $150,000\mathrm{km}^2$, with $12\%$ attributed to seasonal or temporary monomodal plains, this region is defined by the flood pulse of the Paraguay River and its tributaries, and plays an significant role in the global carbon balance (Dalmagro et al., 2018).
Thus, for a better understanding of the soil carbon efflux rates and the factors that control them in space and time in tropical forests, urban forests (Chen et al., 2013; Ng et al., 2014; Weissert et al., 2016), ecotones, and wetlands, further studies are needed (Pinto Jr. et al.,2018). In this regard, the objective of this study was to evaluate the sensitivity of the $\mathrm{CO}_{2}$ efflux in three Brazilian biomes to changes in soil temperature and moisture.
## II. MATERIAL AND METHODS
### a) Study area
The Brazilian savanna, locally known as Cerrado, is part of the conservation unit: the Mae Bonifácia Park, which is in an urban area, located in Cuiaba, the capital city of the Mato Grosso state, at $15^{\circ}34'44''\mathrm{S}$ and $56^{\circ}05'016''\mathrm{W}$. It covers an area of 77.16 hectares, and its altitude ranges between 164 and 195 m (Joaquim et al., 2018). According to Andrade et al. (2016), which characterized the park's species, has not undergone relevant anthropic actions that might have altered its biophysical characteristics, is the remaining fragment of the Cerrado in its natural form, therefore, the park was considered a good representation of the Cerrado biome.
The three areas climate is classified as Aw, according to the Köppen climate classification, is characterized by hot and humid rainy summers and dry winters (Alvares et al., 2013).
### b) Vegetation
To the Cerrado the most abundant vegetative species include Curatella Americana L., Albizia niopoides (Spruce ex Benth.), Anadenanthera colubrine (Vell.) Brennan, Samanea Tubulosa (Benth.) Barneby and J.W. Grimes., Stryphnodendron adstringens, and Inga vera Willd. Subsp. affinis (DC.). This Cerrado fragment is an area of native vegetation surrounded by anthropic barriers, which significantly impede the movement of animals as well as the flow of pollen or seeds. Isolated environments may contain endemic species due to the long period of isolation, and this makes such environments a priority for conservation (Novais et al., 2018a). In the Cerrado-Amazonian Ecotone there are botanical species, which are also present in the Amazonian and Cerrado forests, with the original vegetation forming a seasonal semideciduous forest, and the most abundant families include Anacardiaceae, Malvaceae, Bignoniaceae, Annonaceae, Apocynaceae, Meliaceae, Miristicaceae, and Rubiaceae, of which $81\%$ of the species are native to the region (Rodrigues, et al., 2015). And to the Pantanal the predominant species is Scheelea phalerata (family Arecaceae), which is popularly known as Acuri.
### c) Soil type
Alic Cambisol is the predominant soil in the Cerrado region, which is a typical mineral soil that is well drained, has a medium depth, with the presence of iron concretions along the profile in amounts greater than $50\%$ of the volume. To Cerrado-Amazonian Ecotone there are two soil types, Red Dystrophic Latosol (Red Latosol) and Hydromorphic Quartzenic Neosol. And to the Pantanal, the local soil is classified as Haplic Eutrophic Planosol, according to Gava et al. (2013).
### d) Soil carbon efflux and meteorological variables
Between August 2015 and July 2016, July 2017 and June 2018, and February 2014 and January 2015, five sample points, with a separation of approximately 10 meters, were selected in Cerrado, the Cerrado-Amazonian Ecotone, and Pantanal, respectively. At these points, measurements were made at one h-intervals, from eight am to four pm. Thus, a total of 540 samples were collected per year for each location.
Subsequently, the collections from the five monitored points were averaged.
The soil carbon efflux measurements were performed using a portable infrared gas analyzer (EGM-4, PP systems, Amesbury, MA, USA) connected to a soil $\mathrm{CO}_{2}$ flow chamber (SRC-1, PP Systems, Amesbury, MA, USA). Air temperature and relative humidity measurements were made using a portable microclimate station (Kestrel 4500 Weather Tracker, NK Company, Boothwyn, PA, USA), and at a soil depth of $5\mathrm{cm}$, soil temperatures were measured using a digital thermometer (Instrutherm TE-300, São Paulo, SP, Brazil) and soil moisture measurements were made monthly using the gravimetric method. Precipitation data was obtained from the National Meteorological Institute (INMET, 2018). Except for Pantanal, that leaf area index (LAI) was not collected, in the other study areas was measured using a linear ceptometer (AccuPar-LP 80, Decagon Devices, Washington, USA), and monthly averages were taken for all variables.
A collector with an area of $1\mathrm{m}^2$ placed at a height of $1.20\mathrm{m}$ was used to obtain litter. The litter produced was collected monthly, then stored for subsequent drying in a circulating oven for 72 hours. Afterward, it was weighed using a semi-analytical balance (Scoriza, 2012).
### e) Statistical analyses
Soil moisture, litterfall, and leaf area index (LAI) were subjected to regression analyses to explore the interdependence of these variables, which play crucial roles in soil CO2 efflux. The aim was to identify models that accurately describe the field experimental data gathered at the three sites. Furthermore, an examination of the impact of soil temperature and moisture on effluxes was conducted, with sensitivity analysis providing insights into potential scenarios related to climate change.
After conducting normality and homoscedasticity tests, Spearman correlation tests $(\rho)$ were employed to explore potential correlations among the variables. The Tukey test was then utilized to compare groups. Additionally, $p$ values: 0.05 were deemed statistically significant. Consequently, these datasets will facilitate the analysis of soil CO2 efflux, enabling the establishment of regression models.
## III. RESULTS AND DISCUSSION
### a) Characterization of variables
The analysis of the monthly litterfall (S), soil carbon efflux, precipitation (Ppt), leaf area index (LAI), soil temperature $(T_{s})$, and soil humidity $(\theta_{S})$ variations corresponding to the Cerrado, the Cerrado-Amazonian Ecotone, and the Pantanal forests are shown in Figure 1.
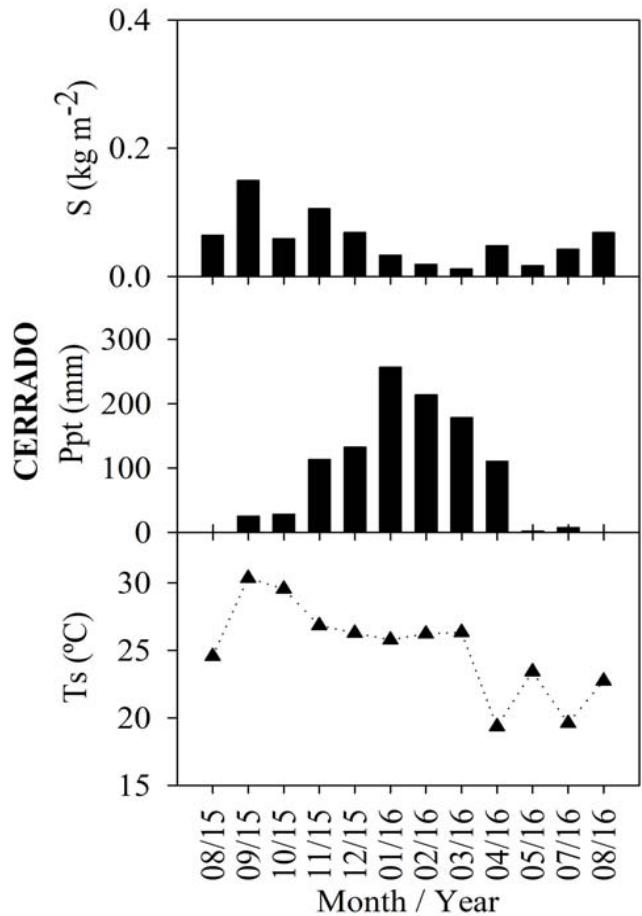
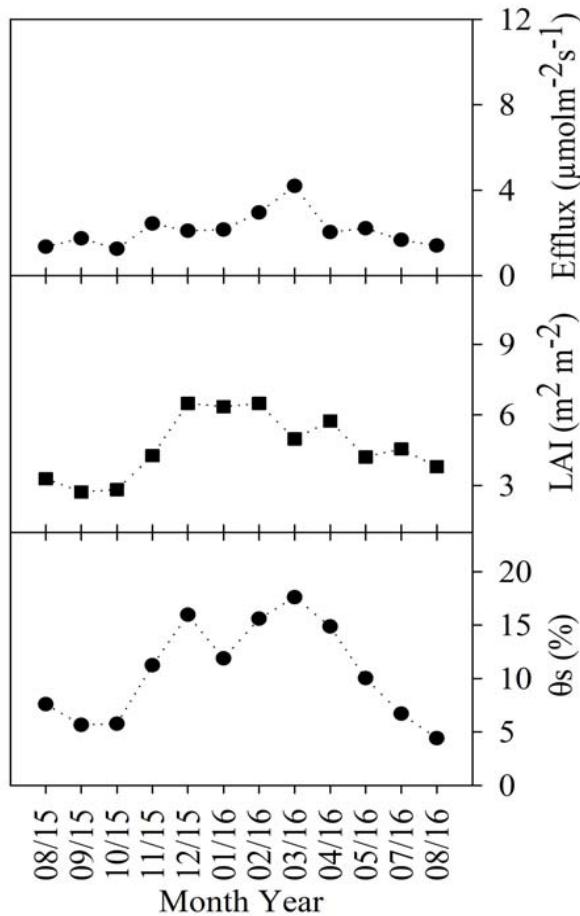
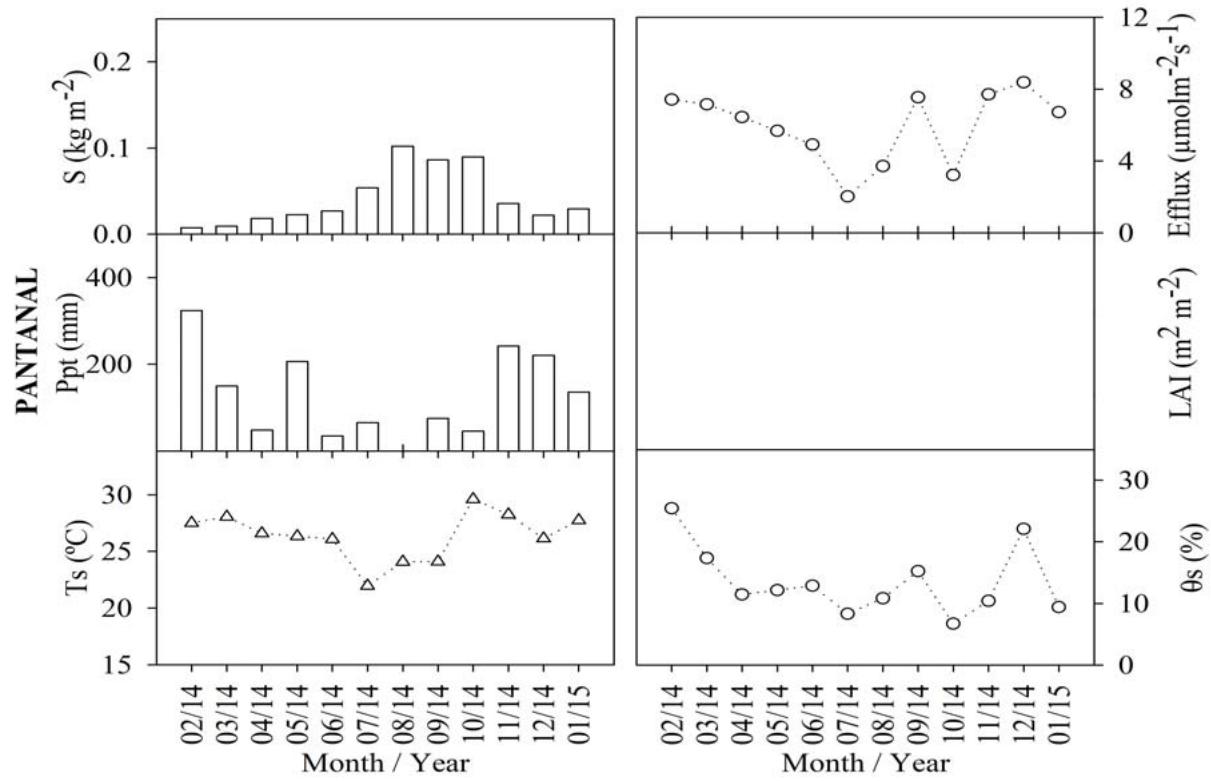
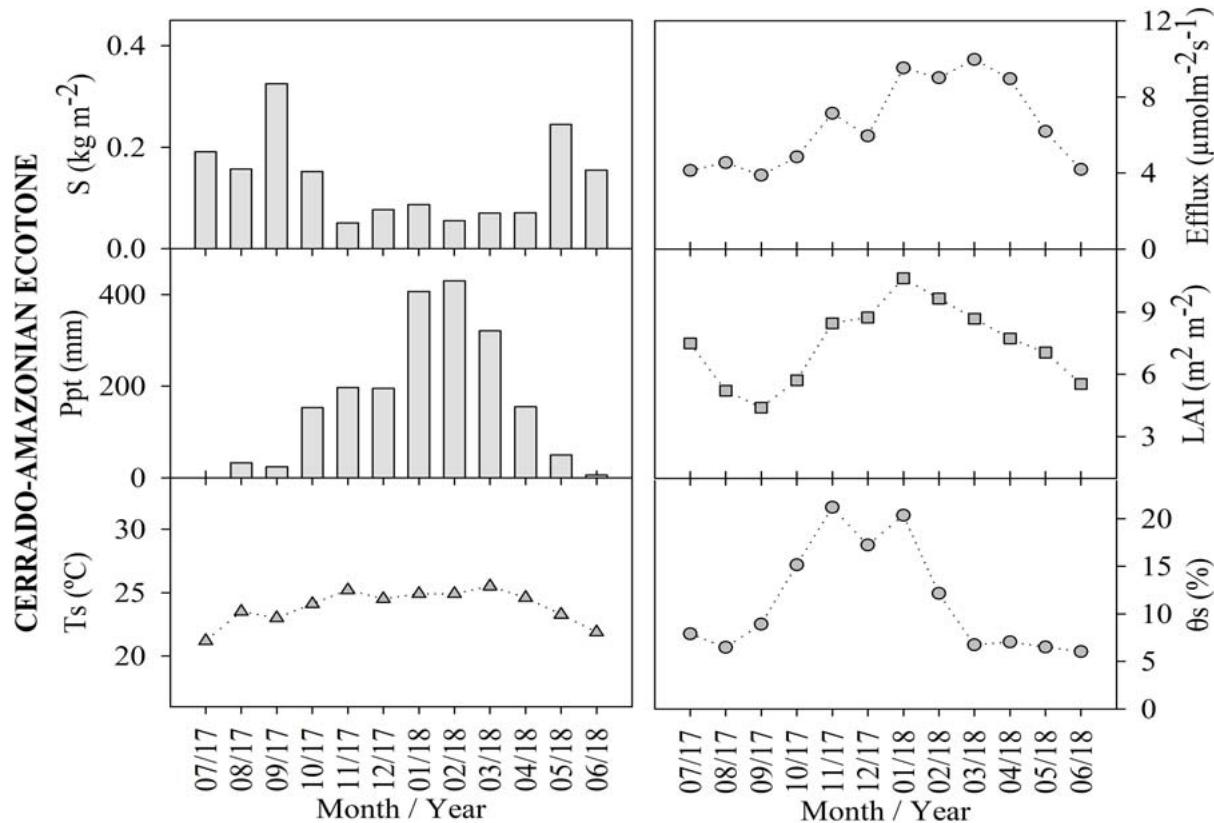 Figure 1: Monthly averages of soil carbon efflux, litterfall (S), leaf area index (LAI), precipitation (Ppt), soil temperature (Ts), soil moisture ( $\theta$ s), for Cerrado (Black), Cerrado-Amazonian Ecotone (Gray), and Pantanal (White) forests.
The annual averages of the soil carbon efflux were $6.52 \pm 2.31$, $2.12 \pm 0.81$, and $5.91 \pm 2.03$ for the Ecotone, the Cerrado, and the Pantanal forests, respectively. Additionally, there was no significant statistical difference ( $p < 0.05$ ) between the flows in the Cerrado-American Ecotone and the Pantanal forests. Maximum emissions (9.96 and $4.19 \mu \mathrm{mol} \cdot \mathrm{s}^{-1}$, respectively) were observed in March 2018 to the Ecotone and Cerrado, and the maximum emission (8.37 $\mu \mathrm{mol} \cdot \mathrm{s}^{-1}$ ) was observed in December 2014 to Pantanal,
The litter production values for Pantanal and the Ecotone, as well as those for Cerrado and the Ecotone, were found to be statistically different $(p < 0.05)$. However, the values corresponding to the Cerrado and Pantanal forests did not exhibit a significant difference. In September, both the Ecotone and Cerrado forests displayed their highest litter production, at approximately $0.325\mathrm{~kgm}^{-2}$ and $0.15\mathrm{~kgm}^{-2}$, respectively. It is noteworthy that the Ecotone and Cerrado forests produced the highest litter amounts during this month. In a study by Costa et al. (2022), it was reported that the dense Cerrado, exhibiting characteristics closer to the ecotone, had a monthly average litter production of $0.37\mathrm{~kgm}^{-2}$.
In the Pantanal, the highest level of litter production $(0.10\mathrm{kgm}^{-2})$ was observed in August 2014, values close to those found by Pinto Jr. et al. (2018) for the same month and biome. August and September months were considered as dry periods (Vourlitis and da Rocha, 2011), during which the plants in deciduous forests loose leaves the most as a result of water stress (Pavão et al., 2018), justifying these results.
This pattern was found to be reversed for the leaf area index (LAI), which as the rain starts, increases owing to the production of new leaves (Novais et al. 2018b), and corresponding to a significant positive correlation coefficient $(p < 0.01)$, i.e., 0.74 and 0.84 for LAI and precipitation in Cerrado and the Cerrado-American Ecotone, respectively. There was a statistically significant difference $(p < 0.001)$ between the LAI results for the Cerrado and Ecotone, $4.64 \pm 1.38$ and $7.6 \pm 1.92\mathrm{m}^2\mathrm{m}^{-2}$ respectively.
The average annual soil temperature and soil moisture for Cerrado, Pantanal, and the Ecotone were $25.08 \pm 3.40^{\circ}\mathrm{C}$ and $10.60 \pm 4.61\%$, $26.37 \pm 2.13^{\circ}\mathrm{C}$ and $13.52 \pm 5.62\%$, and $23.88 \pm 1.35^{\circ}\mathrm{C}$ and $11.30 \pm 5.73\%$, respectively.
Correlation analysis showed that there was a positive and significant correlation between soil moisture and efflux in Cerrado and Pantanal $(\rho = 0.755$ and $p = 0.003;\rho = 0.629$ and $p = 0.0263$, respectively), and the correlation with soil temperature was not significant. However, for the Ecotone, a positive and significant correlation was observed between the efflux and soil temperature $(\rho = 0.893$ and $p < 0.001)$, while that between soil moisture and the efflux was insignificant $(\rho = 0.683)$.
### b) Models
According Table 1, the regression models were set up from a combination of environmental variables or/and vegetation parameters.
<table><tr><td>Pantanal - Regression Model:</td><td colspan="3">Efflux = aTs2 + b(Ts0.2/θs)2.5</td></tr><tr><td>Parameters</td><td>Value</td><td>p-value</td><td>R2</td></tr><tr><td>a</td><td>0.011</td><td>< 0.001</td><td>0.745</td></tr><tr><td>b</td><td>-134.44</td><td>< 0.001</td><td></td></tr><tr><td>Ecotone - Regression model:</td><td colspan="3">Efflux = aTs2.4 + b(θs/Ts)0.4 + cIS0.4</td></tr><tr><td>Parameters</td><td>Value</td><td>p-value</td><td>R2</td></tr><tr><td>a</td><td>0.00235</td><td>< 0.05</td><td></td></tr><tr><td>b</td><td>-5.2436</td><td>< 0.05</td><td>0.832</td></tr><tr><td>c</td><td>1.0048</td><td>< 0.01</td><td></td></tr><tr><td>Cerrado - Regression model:</td><td colspan="3">Efflux = aTs0.25 + b θs1.25/Ts0.25 + cSI-3</td></tr><tr><td>Parameters</td><td>Value</td><td>p-value</td><td>R2</td></tr><tr><td>a</td><td>0.5654</td><td>< 0.001</td><td></td></tr><tr><td>b</td><td>0.0655</td><td>< 0.05</td><td>0.916</td></tr><tr><td>c</td><td>2.20E-08</td><td>< 0.001</td><td></td></tr></table>
The environmental variables that were part of all the models were Ts and $\theta_{s}$, which are possibly the main drivers of the efflux. In previous studies, it has been reported that these variables control soil respiration (Davidson et al., 1998; Davidson et al., 2006; Liu et al., 2019); however, in this study, it appeared that the soil efflux further depended on other controlling variables, such as LAI and S, except for Pantanal, for which data on LAI was not available for the same period; thus, the combination of LAI and S was not possible. This possibly had an effect on the accuracy of the regression model $(\mathsf{R}^2 = 0.745)$, which was substantially lower for this site compared with the Ecotone $(\mathsf{R}^2 = 0.832)$ and Cerrado $(\mathsf{R}^2 = 0.916)$, respectively. Additionally, for Pantanal and the Ecotone (Figure 2) the regression model underestimated the monthly efflux after January given that the magnitude of their dependent variables $(T_s$ and $\theta_s)$ did not change sufficiently to capture the efflux that primarily increased from the month of March (Figure 2).
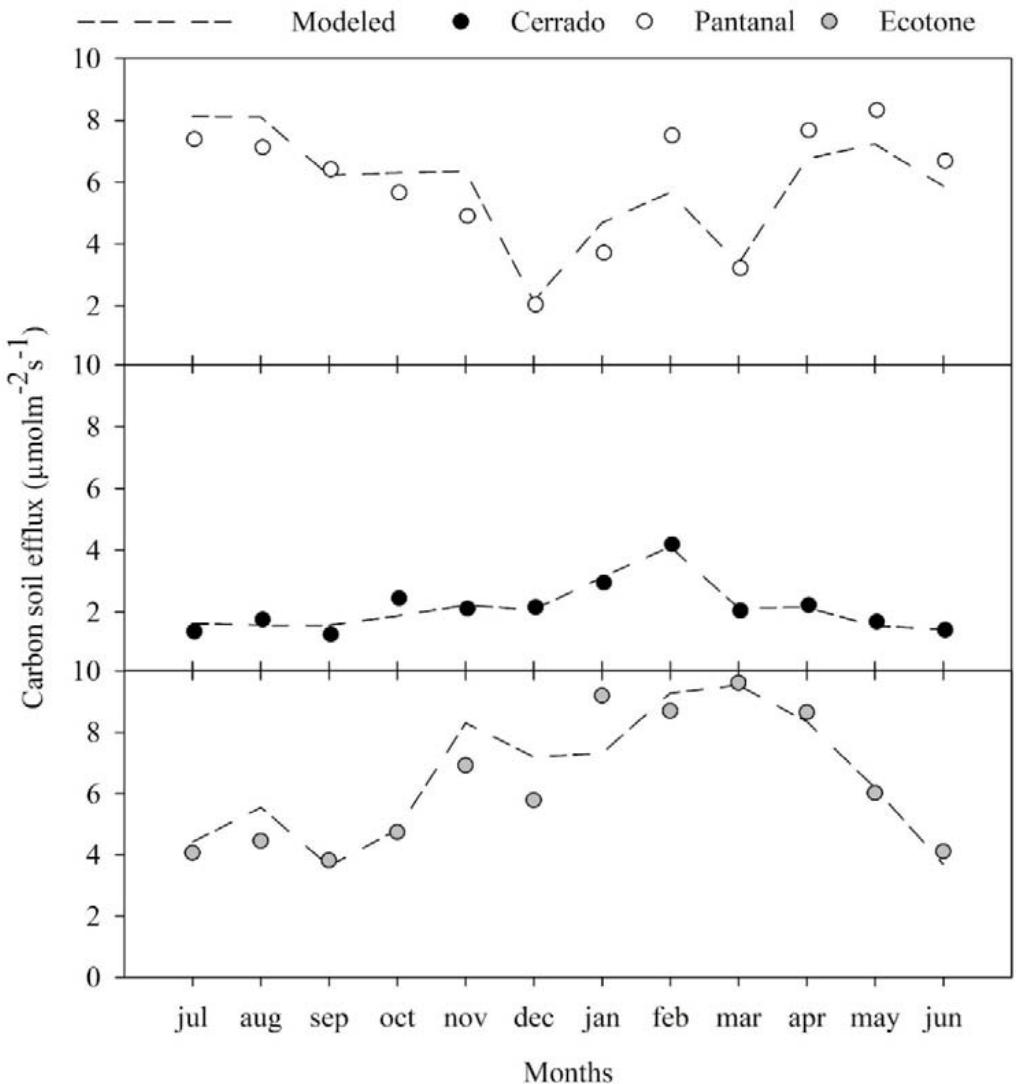 Figure 2: Monthly measured and modeled carbon soil efflux for Cerrado-Amazonian Ecotone (Gray), Pantanal (white) and Cerrado (Black).
In general, all the models had a high goodness-of-fit for efflux, and captured the dynamics and magnitude of observed efflux data. The models results suggest that the litter supply associated with an increase in ventilation, incident radiation, and soil evaporation, and a decrease in LAI, influence the soil carbon efflux. Thus, they can contribute to enhancing our understating of the efflux dynamics in tropical regions, based on the results of previous studies (Valentini et al., 2008; Lathuillière et al., 2017). Additionally, the regression models accurately described most of the efflux variations throughout the months for all the study sites, and could also perform additional analyses, such as the determination of the sensitivity of the efflux to the variables, Ts and $\theta_{s}$.
### c) Regression models and analysis of efflux sensitivity to Ts and $\theta_{s}$
The sensitivity analysis tested the effect of the relevant dependent variables that were included in the regression model, i.e., Ts and $\theta_{s}$, on the efflux (Table 2).
Table 2: Analysis of sensitivity of soil carbon efflux for soil temperature (Ts) and soil moisture $(\theta_{s})$ for Cerrado-Amazonian Ecotone, Pantanal and Cerrado.
<table><tr><td colspan="4">Effect on soil carbon efflux for each model</td></tr><tr><td>Variables</td><td>Cerrado</td><td>Cerrado-Amazonian Ecotone</td><td>Pantanal</td></tr><tr><td>Ts+2°C</td><td>0.6%</td><td>17.4%</td><td>19%</td></tr><tr><td>Ts+2°C and □s-10%</td><td>-2.7%</td><td>19.7%</td><td>9.7%</td></tr><tr><td>Ts+2°C and □s+10%</td><td>4.0%</td><td>15.2%</td><td>26%</td></tr></table>
The soil carbon efflux at the Cerrado site appeared to be unaffected by Ts or $\theta_{s}$ since the positive and negative changes in the magnitude of the efflux were considerably smaller than those corresponding to the Ecotone and Pantanal. This is an interesting finding because it showed that the observed efflux increased in response to a local increase in S (February), meaning that litter supply plays an important role in litter decomposition and $\mathrm{CO}_{2}$ emission. Moreover, the regression model for Cerrado may be able to describe the local emission peak via the inclusion $S_{1}$ variable. The Ecotone and Pantanal sites appeared to be more sensitive to Ts and $\theta_{s}$, even though the Ecotone site showed more sensitivity to Ts than $\theta_{s}$. When the soil moisture content varies by $10\%$, the expected variation in efflux was not significant compared with the $17.4\%$ increase in the efflux that resulted from an increase in Ts by $2^{\circ}\mathrm{C}$. This observation confirmed the strong correlation between the efflux and Ts observed at this site ( $\rho = 0.893$ and $\rho < 0.001$ ). The model was sensitive to variations of $2^{\circ}\mathrm{C}$ and $10\%$ for Ts and U in the Pantanal, resulting in a $26\%$ increase in soil carbon efflux. This value is $7\%$ higher compared to the model that only changed the temperature, being similar to Wang et al. (2014), who reported an increase in emissions of approximately $21\%$ owing to a $2^{\circ}\mathrm{C}$ rise in temperature.
Even though these sites are located less than $215\mathrm{km}$ apart, their soil types, vegetation characteristics, and climates are considerably different, and these differences were responsible for the distinguishing results. Additionally, the results obtained in this study further confirmed that the Mato Grosso state presents a complex mosaic landscape that may respond differently to climate changes. Therefore, it may be necessary to consider specific solutions that seek to establish sustainability as well as preventive actions to mitigate soil $\mathrm{CO}_{2}$ emissions. Once climate change is present, it is necessary to monitor carbon emissions in these biomes for a longer period to improve mathematical models and to advance the environmental management of the most sensitive areas. Given the fact that tropical ecosystems may be responsible for approximately $67\%$ of the total annual global $\mathrm{CO}_{2}$ efflux (Bond-Lamberty e Thomson, 2010b) changes in litter production and efflux due to climate and land-use change have important implications for global $\mathrm{CO}_{2}$ cycling. This serves as an alert to government officials and highlights the need for preventive actions to mitigate soil $\mathrm{CO}_{2}$ emissions (Pinto Jr. et al., 2018).
## IV. CONCLUSION
In this study, a positive and significant correlation was observed between soil moisture content and the efflux in Cerrado and Pantanal. However, in the Ecotone, an opposite observation was made; a positive and significant correlation existed only between soil temperature and efflux. These correlations allow us to increase our understanding of which variables influence carbon emissions. Another important result is that combinations of leaf area index and litterfall can be used to facilitate the representation of efflux seasonality. Compared to other locations, the Cerrado forest was the least sensitive to changes in temperature and humidity. For the Ecotone and Pantanal, an increase in soil temperature by $2^{\circ}\mathrm{C}$ resulted in an increase in carbon emissions by 19.7 and $26\%$, being a worrying result, given that these regions are constantly being deforested. Additionally, the biomes analyzed in this study have a complex mosaic landscape with regions that respond differently to warming, being recommended that this type of experiment be applied in more locations in this Brazilian region, in order to understand how changing vegetation cover influences carbon emissions.
Funding
This work was supported by the Mato Grosso Research Support Foundation-FAPEMAT [grant number 0194288/ 2017].
Generating HTML Viewer...
References
47 Cites in Article
M Adachi,Ys Bekku,W Rashidah,T Okuda,H Koizumi (2006). Differences in soil respiration between different tropical ecosystems.
C Alvares,J Stape,P Sentelhas,J Gonçalves,G Sparovek (2013). Köppen's climate classification map for Brazil.
Levi Andrade,Jonathan Zangeski Novais,Carlo Musis,Luciana Sanches,Susana Pereira (2016). EFEITOS DE BORDA SOBRE O MICROCLIMA DE UM PARQUE ECOLÓGICO URBANO EM CUIABÁ-MT.
Luiz Aragão,Benjamin Poulter,Jos Barlow,Liana Anderson,Yadvinder Malhi,Sassan Saatchi,Oliver Phillips,Emanuel Gloor (2014). Environmental change and the carbon balance of <scp>A</scp>mazonian forests.
B Bond-Lamberty,A Thomson (2010). A global database of soil respiration data.
Ben Bond-Lamberty,Allison Thomson (2010). Temperature-associated increases in the global soil respiration record.
W Borken,E Matzner Reappraisal of drying and wetting effects on C and N mineralization and fluxes in soils.
D Bowling,E Grote,J Belnap (2011). Rain pulse response of soil CO<sub>2</sub>exchange by biological soil crusts and grasslands of the semiarid Colorado Plateau, United States.
H Chen,W Zhang,F Gilliam,L Liu,J Huang,T Zhang,W Wang,J Mo (2013). Changes in soil carbon sequestration in <i>Pinus massoniana</i> forests along an urban-to-rural gradient of southern China.
Wendy Chou,Whendee Silver,Randall Jackson,Andrew Thompson,Barbara Allen‐diaz (2008). The sensitivity of annual grassland carbon cycling to the quantity and timing of rainfall.
Alan Costa,Alessandra Bartimachi,Heraldo Vasconcelos,Emilio Bruna,Ernane Vieira-Neto (2020). Annual litter production in a Brazilian Cerrado woodland savanna.
Higo Dalmagro,Michael Lathuillière,Iain Hawthorne,Douglas Morais,Osvaldo Pinto Jr,Eduardo Couto,Mark Johnson (2018). Carbon biogeochemistry of a flooded Pantanal forest over three annual flood cycles.
Eric. Davidson,Elizabeth Belk,Richard Boone (1998). Soil water content and temperature as independent or confounded factors controlling soil respiration in a temperate mixed hardwood forest.
Eric Davidson,Ivan Janssens,Yiqi Luo (2006). On the variability of respiration in terrestrial ecosystems: moving beyond<i>Q</i><sub>10</sub>.
R Dixon,A Solomon,S Brown,R Houghton,M Trexier,J Wisniewski (1994). Carbon Pools and Flux of Global Forest Ecosystems.
W Blum (2006). The Role of Soil Micromorphology in the Light of the European Thematic Strategy for Soil Protection.
Ricardo Gava,Paulo Freitas,Rogério Faria,Roberto Rezende,José Frizzone (2013). Soil water evaporation under densities of coverage with vegetable residue.
M Holland (2012). Ecotones: the role of landscape boundaries in the management and restoration of changing environments.
Ipcc (2007). Summary for policymakers.
Thiago Joaquim,Jonathan Novais,Levi Andrade,Karyna Rosseti,Maricéia Vilani,Susana Pereira (2018). Thermo-hygrometric modeling using ENVI-met® software to an urban park in Cuiabá – Brazil.
Miko Kirschbaum (1995). The temperature dependence of soil organic matter decomposition, and the effect of global warming on soil organic C storage.
Michael Lathuillière,Osvaldo Pinto,Mark Johnson,Rachhpal Jassal,Higo Dalmagro,Nei Leite,Alicia Speratti,Daniela Krampe,Eduardo Couto (2017). Soil CO<sub>2</sub>concentrations and efflux dynamics of a tree island in the Pantanal wetland.
Yanchun Liu,Shirong Liu,Renhui Miao,Yinzhan Liu,Dong Wang,Cancan Zhao (2019). Seasonal variations in the response of soil CO2 efflux to precipitation pulse under mild drought in a temperate oak (Quercus variabilis) forest.
Miguel Mahecha,Markus Reichstein,Nuno Carvalhais,Gitta Lasslop,Holger Lange,Sonia Seneviratne,Rodrigo Vargas,Christof Ammann,M Arain,Alessandro Cescatti,Ivan Janssens,Mirco Migliavacca,Leonardo Montagnani,Andrew Richardson (2010). Global Convergence in the Temperature Sensitivity of Respiration at Ecosystem Level.
B Marimon,E De S. Lima,T Duarte,L Chieregatto,J Ratter (2006). OBSERVATIONS ON THE VEGETATION OF NORTHEASTERN MATO GROSSO, BRAZIL. IV. AN ANALYSIS OF THE CERRADO–AMAZONIAN FOREST ECOTONE.
A Neergaard,J Porter,A Gorissen (2002). Distribution of assimilated carbon in plants and rhizosphere soil of basket willow (Salix viminalis L.).
Jason Neff,David Hooper (2002). Vegetation and climate controls on potential CO<sub>2</sub>, DOC and DON production in northern latitude soils.
B Ng,L Hutyra,H Nguyen,A Cobb,F Kai,C Harvey,L Gandois (2014). Carbon fluxes from an urban tropical grassland.
Uffe Nielsen,Becky Ball (2015). Impacts of altered precipitation regimes on soil communities and biogeochemistry in arid and semi‐arid ecosystems.
Jonathan Novais,Levi Andrade,Angélica Siqueira,Carlo Musis,Luciana Sanches,Osvaldo Pereira,Maria Pierangeli (2018). Avaliação do método de lambert-beer para estimativas de índice de área foliar no cerrado Mato-Grossense.
Jonathan Novais,Luciana Sanches,Vanessa Dias,Nadja Machado,Ludymilla Silva,Aryadne Aquino (2018). VARIAÇÃO ESPAÇO-TEMPORAL DA PAR REFLETIDA PELO SOLO E TRANSMITIDA PELO DOSSEL EM FLORESTA INUNDÁVEL NO PANTANAL MATO-GROSSENSE.
L Pavão,L Sanches,O Pinto Júnior,J Spolador (2019). The influence of litter on soil hydro-physical characteristics in an area of Acuri palm in the Brazilian Pantanal.
Susana Pereira,Jonathan Novais,Osvaldo Pinto Júnior,Carlo Musis,Levi Andrade,Thiago Joaquim,Maria Pierangeli (2018). Dinâmica temporal do efluxo de CO2 em fragmento de cerrado Mato-Grossense.
O Pinto Junior,G Vourlitis,E Carneiro,D De França,C Hentz,J Nogueira (2018). Interactions between Vegetation, hydrology, and litter inputs on decomposition and soil CO 2 efflux of tropical forests in the Brazilian Pantanal.
P Rodrigues,I Gomes,M Simon,J Nunes,R Añez (2015). Anais do(a) XII Simpósio de Estudos e Pesquisa em Ciências Ambientais na Amazônia.
Marcel Schwieder,Pedro Leitão,Mercedes Da Cunha Bustamante,Laerte Ferreira,Andreas Rabe,Patrick Hostert (2016). Mapping Brazilian savanna vegetation gradients with Landsat time series.
R Scoriza,M Pereira,G Pereira,D Machado,E Silva (2017). Métodos para coleta e análise de serrapilheira aplicados à ciclagem de nutrientes.
Yngrid Schuartz,Nantes Henriques (2021). Avaliação da precipitação estimada por sensor orbital no Pantanal Mato-Grossense.
B Soares,D Nepstad,L Curran,G Cerqueira,R Garcia,C Ramos,E Voll,A Mcdonald,P Lefebvre,P Schlesinger (2006). Modelling conservation in the Amazon basin.
A Søe,N Buchmann (2005). Spatial and temporal variations in soil respiration in relation to stand structure and soil parameters in an unmanaged beech forest.
A Strong,T Johnson,N Chiariello,C Field (2017). Experimental fire increases soil carbon dioxide efflux in a grassland long-term multifactor global change experiment.
Carla Valentini,Luciana Sanches,Sérgio De Paula,George Vourlitis,José De Souza Nogueira,Osvaldo Pinto,Francisco De Almeida Lobo (2008). Soil respiration and aboveground litter dynamics of a tropical transitional forest in northwest Mato Grosso, Brazil.
Yang Yang,Ting Li,Prem Pokharel,Liangxu Liu,Jiangbo Qiao,Yunqiang Wang,Shaoshan An,Scott Chang (2022). Global effects on soil respiration and its temperature sensitivity depend on nitrogen addition rate.
Yingjie Yan,Jinsong Wang,Dashuan Tian,Yiqi Luo,Xian Xue,Fei Peng,Jin-Sheng He,Lingli Liu,Lifen Jiang,Xin Wang,Yonghui Wang,Lei Song,Shuli Niu (2022). Sustained increases in soil respiration accompany increased carbon input under long-term warming across global grasslands.
Xin Wang,Lingli Liu,Shilong Piao,Ivan Janssens,Jianwu Tang,Weixing Liu,Yonggang Chi,Jing Wang,Shan Xu (2014). Soil respiration under climate warming: differential response of heterotrophic and autotrophic respiration.
Na Wang,Benjamin Quesada,Longlong Xia,Klaus Butterbach‐bahl,Christine Goodale,Ralf Kiese (2019). Effects of climate warming on carbon fluxes in grasslands— A global meta‐analysis.
L Weissert,J Salmond,L Schwendenmann (2016). Variability of soil organic carbon stocks and soil CO2 efflux across urban land use and soil cover types.
Explore published articles in an immersive Augmented Reality environment. Our platform converts research papers into interactive 3D books, allowing readers to view and interact with content using AR and VR compatible devices.
Your published article is automatically converted into a realistic 3D book. Flip through pages and read research papers in a more engaging and interactive format.
Our website is actively being updated, and changes may occur frequently. Please clear your browser cache if needed. For feedback or error reporting, please email [email protected]
Thank you for connecting with us. We will respond to you shortly.