I. INTRODUCTION
The economy of Ghana consists of three main subsectors of agriculture, services and manufacturing which provide employment opportunities. The average shares of GDP by agriculture, service and industry were , and between 2006 and 2016 (GSS 2017) and , , and in 2019 (GSS 2022). Poverty reduction requires significant income growth from economic growth; however, inclusive growth is the main channel for poverty reduction (Fosu, 2016). About of total agricultural land area is cultivated mostly by smallholder rain-fed farming, using rudimentary technologies whilst is irrigated. Small holder farming accounts for of total agricultural production in Ghana. Food crops are "crops that are intended entirely or primarily for home consumption whereas cash crops are defined as crops that are intended entirely or primarily for market (Govereh & Jayne 2003). Food crops include cereals (e.g., maize and rice), roots and tubers (e.g., yam and cassava) and legumes (e.g., cowpea and groundnuts). Fruits (e.g., avocado and mango) and vegetables (e.g., tomatoes and peppers) and industrial cash crops (e.g., cocoa, rubber, kola, coffee, and oil-palm) are important crops for export revenue (MOFA 2016).
Productivity is defined as output per unit input which is used to indicate the performance of crop production (Coelli et al., 2005). Agricultural output grows by improved weather conditions, conventional inputs, and enabled by rural infrastructure, institutional factors and policy frameworks (Thirtle et al., 2003; Reimers & Klasen 2013). According to the World Bank (2000), "poverty is pronounced deprivation in wellbeing" where well-being can be measured by an individual's possession of income, health, nutrition, education, assets, housing, and certain rights, such as freedom of speech. It is also a lack of opportunities, powerlessness, and vulnerability. Poverty rate in Sub-Saharan Africa was high at about and moderate at in South Asia in 2015 (Roser & Ortiz-Ospina, 2018; Fosu 2016). Non-income poverty measures of enrolment rates in senior-secondary schools and tertiary education and the quality of learning in both basic and post-basic education are low in poor countries (Molini & Paci, 2015). By the national poverty line of Ghana, the poverty rate in 1991 of decreased to in 2012 but increased to in 2016/17 (GSS, 2018). Similarly, in Uganda poverty reduced from in 2009 to in 2013 and geographical disparities characterised this poverty reduction (Ssewanyana, & Kasirye, 2014). Poverty rates by employment type showed that poverty among farmers reduced from in 2005 to in 2013; the rural population in the agricultural employment sector have the highest poverty incidence. Nationally, the Gini coefficient of in 2005 increased slightly to in 2013 (GSS, 2014).
Poverty is mainly caused by inadequate income or resources for an optimum consumption of commodities and services which consequently show symptoms of malnourishment and lack of assets (Sen, 1999; Stern & Rogers, 2005; Tebaldi and Mohan 2010). The agricultural sector of Ghana, which is led by smallholder farmers is burdened with low productivity due to low technology adoption and poor soils, weak infrastructure, low market access, high transaction costs and climatic shocks (ACDI/VOCA 2012). Improved agricultural productivity through innovative technologies that support sustainable development is an important channel that aids in poverty reduction and increased food and nutrition security (Al-Hassan and Diao 2007). Improving agricultural productivity is related to Sustainable Development Goal 8 to promote sustained, inclusive and sustainable economic growth, full and productive employment and decent work for all poverty and hunger reduction.
Christiaensen et al. (2011) found employment of poor people in agriculture and the linkage of agriculture with other sectors of the economy leads to poverty reduction. Agricultural productivity pathways to poverty reduction are through the effect of income from higher output; lower food prices and multiplier effects on rural economic growth (Grewal et al., 2012; Bresciani & Valdes, 2007). A related study found significant negative relationships between household's intensity of cash crop production and food security due to increasing food prices and competing activities for land use. The adverse relationship between cash crop production and household food security observed calls for caution; results suggest that positive relationships cannot be assumed, and that further empirical evidence is needed to better understand these tradeoffs (Anderman, et al. 2014). Food and cash crops have different production systems and synergistic effects or trade offs on farm households' livelihoods (Governeh and Jayne 2003). Crop farmers' poverty rate has not been disaggregated into food and cash crop types and their role on poverty reduction have not been assessed. This study therefore assesses the effect of food and cash crop productivities on poverty. The next section presents the methodology of the study, which entails the data and method of analysis, followed by the results and discussion and lastly conclusion.
II. METHODOLOGY
a) Conceptual Framework
The conceptual framework adapted for this study shows four pathways out of poverty, namely raising agricultural labor productivity, labor reallocation to rural non-farm activities, migration to reallocate labour to urban activities, and transfer of rural tax reduction or income transfers, price support and input subsidies (Schneider & Gugerty 2011). Food crops provide food and income while cash crops provide income for farm households towards poverty reduction (Figure 1). Food and cash crops have varied growth paths and unequal pathways for poverty reduction (Diao & Dorosh, 2007). The sub-sectors are distinct by agro ecological conditions, policy, markets and special role towards alleviating poverty. Food crops pathway for poverty reduction is broad-based mainly through supply of food for household consumption and sale of surplus food through domestic and regional market (Al-Hassan & Poulton 2009; Khan and Verma, 2018; Diao & Hazell, 2004). Cash crops are high value crops and provide mainly income in well-structured domestic and export markets (Diao & Hazell, 2004; Hill & Viner, 2014).
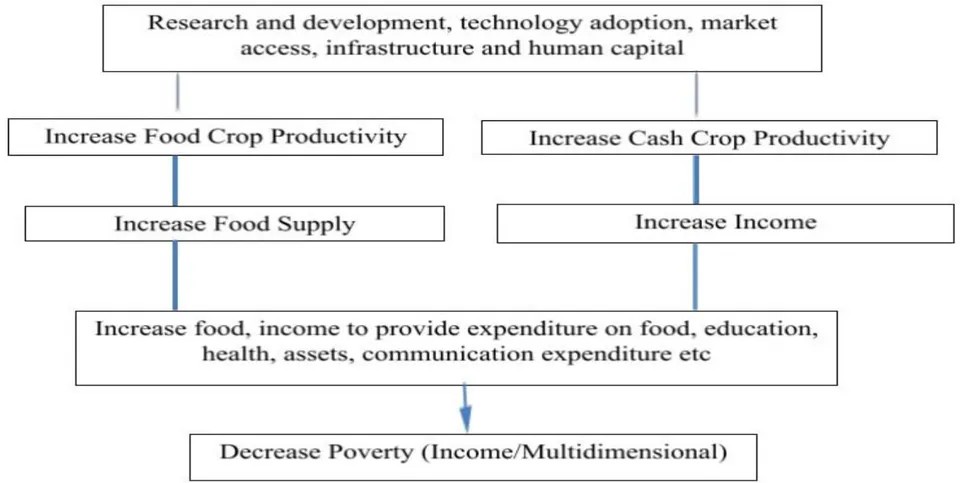
Adapted from Christiaensen & Kuhl (2011)
III. THEORETICAL FRAMEWORK
The household economic model provides the theoretical basis of this analysis. The indirect utility function of a rural household is given by is labour income to purchase commodities and services for optimum satisfaction and pj is price of crop j (Ravallion, 1996; Minten & Barrett 2008). The study assumes the labour income, y is decomposed into farm and non-farm labour income as defined in equation (1).
Labour income specified in equation (1) is totally differentiated to give equation (2):
Equation 2 is simplified as:
is given by where is the price elasticity with respect to productivity.
Higher crop productivity growth would increase crop output greater than the decline in crop prices to increase crop income and thereby reduce poverty (Nicholas & Snyder, 2008; Minten & Barrett 2008).
a) Estimation of Poverty Rate
The Foster-Greer-Thorbecke (1984) (FGT) poverty index is used to estimate the poverty headcount ratio, poverty gap and poverty severity among crop farmers. The measure uses consumption expenditure which is more reliable to obtain from households and more stable than income of farmers. The FGT measures are given as:
n = Number of households in a group q = The number of poor households per group
(z =) Poverty line of (1314) ((219); farmers below the poverty line are poor
Household expenditure per capita adult equivalent of the i-th household in the specified group
b) Relationship between Crop Productivity and Poverty Reduction
The effect of food and cash crop productivity on poverty is estimated using Panel logistic two stage
where, is productivity of the underlying technology, is the production function represents farm size, is farm labour supply is non-farm labour supply, is the wage rate for unskilled labour and is the given agroecological conditions.
instrumental variable fixed and random effects regression technique based on Hausman specification test (Dzanku 2015: Crown et al., 2011; Katchova, 2013). The food and cash crops productivities are measured as output value per hectare of land and is estimated by the instruments of cost of chemical and intermediate inputs in equation (8). Crop productivity is expected to be endogenous due to possible correlation with the error term, which is corrected by the instruments found to be related to the crop productivity but unrelated to the error term. Poverty measures, poverty headcount ratio, Poit Poverty gap, P1it and Poverty severity, P2it are regressed on the estimated crop productivity , household size , distance to water source , years of education , days of ill-health , livestock and remittance income , in equation (9-11).
Stage 1:
Stage 2:
Table I: Description of Explanatory Variables
| Variables | Definition | Measurement | Apriori sign |
| P0it | Poverty headcount ratio | Dummy 1=poor 0=non-poor | |
| P1it | Poverty gap | Consumption expenditure | |
| P2it | Poverty severity | Consumption expenditure | |
| x1 | Crop productivity | Output Value/Ha | - |
| x2 | Household size | Household members | -/+ |
| x3 | Years of education | Years of education | - |
| x4 | Distance to water source | Distance Km | -/+ |
| x5 | Days of ill-health | Number of days of inactivity | -/+ |
| x6 | Remittance income | Cedis | + |
| x7 | Livestock income | Cedis | + |
| k1 | Cost of chemical inputs (IV) | Cedis | + |
| k2 | Cost of intermediate inputs (IV) | Cedis | + |
c) The Data
The study employs the Ghana Living Standards Survey in 2005/06 and 2012/13 of Ghana and enumeration areas were selected from the sixteen (16) regions of Ghana in proportion to size of the region, ecology and rural/urban classification. The total numbers of enumeration areas were 550 and 1200 for 2005/06 and 2012/2013 surveys respectively. Fifteen (15) households from each enumeration area were selected either randomly or systematically to obtain the total farm households of 2910 and 8355 in 2005/06 and 2012/13 surveys respectively. Farm households of 2910 and 8355 were used to create pseudo-panel data of 102 cohorts based on age, gender, and agroecological zones in the 2005/06 and 2012/13 surveys respectively. Deaton (1985) suggests creating cohorts, based on some pre-determined characteristics that are time invariant, can substitute for panel data, and have cohort means that generate consistent and efficient estimates (Guillerm 2017).
IV. RESULTS AND DISCUSSION
a) Summary Statistics of model explanatory variables
Crop income per hectare of land increased and consumption expenditure on food and non-food items is lower among poor farmers than non-poor farmers which increased to reduce poverty between 2005 and 2013. Crop productivity (kg/ha) reduced for non-poor farmers and increased for poor farmers between 2005 and 2013. Table II shows that years of education of household head fell by for non-poor farmers and by poor farmers. Years of education is important to use the inputs to obtain optimum output. The study further reveals remittance income increased highly by for non-poor farmers and by for poor farmers to support household income for consumption, which is relevant in contributing towards poverty reduction. Additional income from livestock sales increased by for non-poor farmers but reduced by for poor farmer, which can have a dampening effect on consumption expenditure to increase poverty. Household size is higher among poor farmers than non-poor farmers and increased slightly between 2005 and 2013. Distance to water source has reduced significantly between 2005 and 2013 and does not differ significantly between the poor and non-poor. Days of ill health is high and does not differ between the poor and non-poor.
Table II: Summary statistics of model explanatory variables by poverty status
| Variable Description | Mean | Mean Difference | Mean | Mean Diffe re nce | ||
| Poor | Non-Poor | Poor | Non-Poor | |||
| 2005 | 2005 | 2013 | 2013 | |||
| Consumption per Adult | 727.50 | 2502.36 | 1774.85*** | 832.15 | 3083.84 | 2251.69*** |
| Crop productivity kg/ha | 636.30 | 954.30 | 318.00** | 720.27 | 874.92 | 154.65*** |
| Revenue cedi/ha | 177.93 | 283.76 | 105.82*** | 682.97 | 894.46 | 211.49*** |
| Price cedi/kg | 1.01 | 1.18 | .17 | 1.36 | 1.64 | 0.28** |
| Chemical Cost (GHS) | 20.94 | 54.66 | 33.71*** | 172.00 | 259.59 | 87.59*** |
| Seed & Labour Cost (GHS) | 27.43 | 82.98 | 55.55*** | 73.20 | 164.68 | 91.47*** |
| Intermediate Input Cost | 10.42 | 22.93 | 12.51*** | 77.87 | 127.92 | 50.05** |
| Household Head Age | 47.54 | 47.11 | -.43 | 49.26 | 47.94 | -1.32*** |
| Years of Education | 7.61 | 8.69 | 1.07*** | 6.97 | 8.56 | 1.58*** |
| Remittances Income | 28.68 | 59.69 | 31.00*** | 87.35 | 214.96 | 127.61*** |
| Livestock Income (GHS) | 48.35 | 29.78 | -16.24** | 23.39 | 95.98 | 72.58* |
| Household Size Number | 6.06 | 3.68 | -2.38*** | 6.44 | 4.40 | -2.04*** |
| Distance to water source km | 2.9 | 2.3 | 0.6 | .42 | .36 | -0.069*** |
| Days of ill health | 5.64 | 6.49 | .84* | 6.31 | 6.17 | -.13 |
b) Food and Cash Crop Sub-Sector Productivity
Food crop output increased, farm size reduced slightly and the productivities output/income per hectare of land increased towards poverty reduction between 2005 and 2013 (Table III). Cash crop output increased lower than food crop, farm size reduced slightly, and the productivities output/income per hectare increased higher than food crops to reduce poverty between 2005 and 2013. Cash crop output value increased by more than food crop output value which increased by towards poverty reduction between 2005 and 2013. Cash crop yield growth is supported by the well organised value chains which offer technical assistance on production and readily available markets for outputs and inputs (Diao & Hazell 2004).
Table III: Food and Cash Crop Sub-Sector Productivities
| Agro Ecological Zone | Mean Output(kg) | Farm size (ha) | Output (kg/ha) | Productivity (€/ha) | ||||
| 2005 | 2013 | 2005 | 2013 | 2005 | 2013 | 2005 | 2013 | |
| Food Crop | 1169.5 | 1529.3 | 2.61 | 2.30 | 851.35 | 949.06 | 245.19 | 718.80 |
| Cash crops | 740.96 | 806.38 | 2.60 | 2.36 | 390.27 | 450.64 | 264.51 | 1147.8 |
| All Crops | 1284.0 | 1603.6 | 3.32 | 3.35 | 763.81 | 811.59 | 257.24 | 806.82 |
c) Crop Input Use by Farmers
Crop farmers apply inputs such as fertilizer, seed, labor, equipment, to increase productivity.
Fertilizer and hired labour are moderately used in crop production process. Farmers do not commonly use improved seeds and equipment (Table IV).
Table IV: Crop Farmers Input Use
| Inputs | Yes | Percentage | No | Percentage | Total?? |
| Fertilizer | 3346 | 40.01 | 5016 | 59.99 | 8362 |
| Seed | 1519 | 18.17 | 6843 | 81.83 | 8362 |
| Labour | 4306 | 51.49 | 4056 | 48.51 | 8362 |
| Renting Equipment | 1331 | 15.92 | 7031 | 84.08 | 8362 |
d) Source of Income
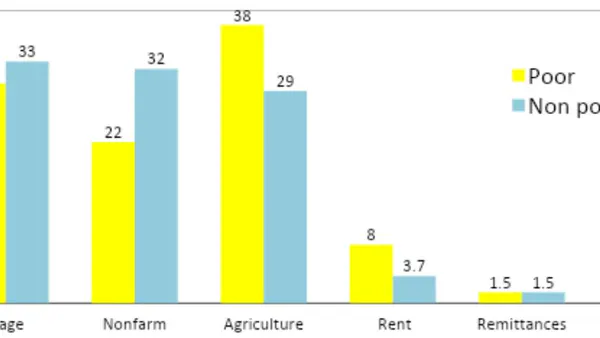
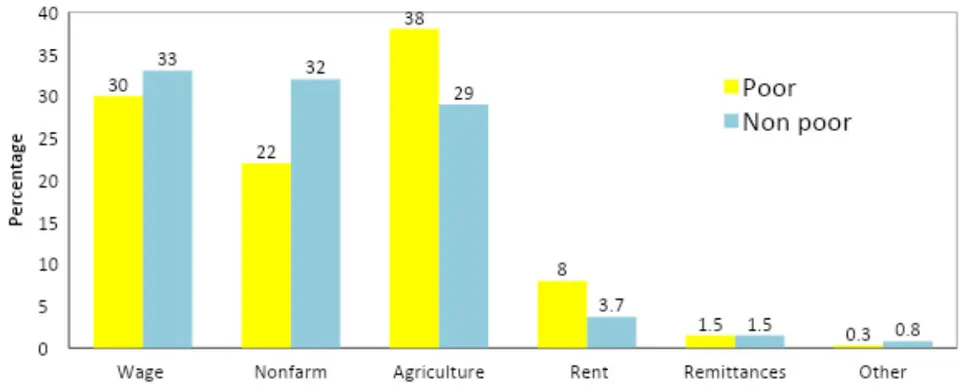
The study shows major source of income for poor farmers is agriculture and major source of income for non-poor farmers is wage and non-farm income sources towards poverty reduction.
e) Food and Non-Food Expenditure
Poor farmers spent more income on food than on non-food items in the consumption bundle. Non-food expenditures include those expenditures on health, education, transportation, clothing, recreation, remittances among others. Total expenditure for poor farmers increased by : food expenditure increased by and non-food expenditure increased by between 2005 and 2013 (Table V). The Ghana Statistical Service requires minimum food and non-food expenditure per year to become non-poor (GSS 2014).
Table V: Food and Non-Food Consumption Expenditure per Adult Equivalent
| Mean | 2005/06 | Mean | 2012/13 | |||
| Expenditure | Poor | Non-Poor | Difference | Poor | Non-poor | Difference |
| Food | 397.78 | 1339.93 | 942.14 *** | 516.96 | 1767.51 | 1250.54*** |
| Non-food | 275.13 | 972.84 | 697.71*** | 314.52 | 1323.80 | 1009.29*** |
| Total | 727.77 | 2497.60 | 1769.81*** | 831.47 | 3091.31 | 2259.83*** |
f) Poverty Levels by Crop Type
Food crop producers of major food crops such as maize, rice, millet, cassava, and plantain poverty rate declined from in 2005 to in 2013. Cash crop producers of major crops such as cocoa, cashew, rubber, and cotton poverty rate declined from , in
Table VI: Poverty Levels (%) by Crop Type
| Crop Categories | P1 | P2 | P3 | Consumption (€) | Population (number) | |||||
| 2005 | 2013 | 2005 | 2013 | 2005 | 2013 | 2005 | 2013 | 2005 | 2013 | |
| Food Crops | 59 | 39 | 27 | 15 | 16 | 7.4 | 1432.14 | 2172.39 | 2,771 | 7,454 |
| Cash Crops | 44 | 24.4 | 16 | 7.4 | 8.5 | 3.2 | 1796.82 | 2638.11 | 736 | 2,331 |
| All Crops | 57 | 37 | 25 | 14 | 14 | 6.8 | 1486.16 | 2244.07 | 2,957 | 8,352 |
g) Effect of Food Crop Productivity on Poverty
The poverty headcount model is estimated by fixed effects model which is consistent; poverty gap and poverty severity are estimated by random effects model which is consistent and efficient as shown in (Table VIII).
A growth in food crop productivity reduces the probability of being poor in terms of the elasticity of poverty headcount ratio, poverty gap, and poverty severity by , , -and which are negative but inelastic. The effects are however lower than that due to cash crop productivity (Table VII). The conduit of food crop productivity towards poverty reduction is mainly by the provision of food and crop income from the productivity growth. Food crop diversity increases by to provide food and income to decrease the probability of a household being in poverty by in Ethiopia (Michler & Josephson 2017; Iheke & Nwaru 2013). In addition to crop productivity, growth in years of education, livestock income and remittances are important for poverty reduction. However, livestock income does not affect poverty gap and severity. Remittance receipts by households contribute to stabilizing consumption in developing countries (Mondal & Khanam 2016). Education develops the numeracy and literacy skills to increase income and manage consumption effectively and efficiently (Coppola & Laurea 2016; Leshoro & Leshoro 2013; Nowak & Kijek 2016). The poverty elasticity estimates for household size are all positive suggesting that larger households are more likely to be poor. The response is also elastic for poverty headcount ratio which increases poverty highly to affect wellbeing of farmers. Household size can erode the benefits of crop productivity growth towards poverty reduction due to the larger effect it exerts on poverty (Teka et al., 2019). Increase in days of ill health reduces probability of being poor by poverty headcount ratio, poverty gap and poverty severity by , and . Days sick can positively influence consumption for speedy recovery towards poverty reduction but higher days sick will reduce consumption to increase poverty. Cho et al. (2016) found household head's physical, and mental disabilities were associated with higher likelihood of being food insecure. An increase of distance to water source elicits an increase in poverty headcount ratio but does not affect poverty gap and poverty severity. Longer distance to fetch water increases poverty incidence because of longer time spent to fetch water to retard household productivity.
Table VII: Effect of Food Crop Productivity on Poverty
| Variables | Poverty Headcount | Poverty Gap | Poverty Severity |
| Output value | -0.192*** | -0.405*** | -0.810*** |
| (0.0211) | (0.0419) | (0.0837) | |
| Household size | 1.333*** | 0.317*** | 0.634*** |
| (0.0464) | (0.0293) | (0.0585) | |
| Education years | -0.378*** | -0.0980*** | -0.196*** |
| (0.0252) | (0.0168) | (0.0336) | |
| Dayssick | -0.0949** | -0.0564** | -0.113** |
| (0.0412) | (0.0263) | (0.0525) | |
| Distance water | 0.0803*** | 0.0146 | 0.0292 |
| (0.0131) | (0.00896) | (0.0179) | |
| Livestock income | -0.159*** | 0.0120 | 0.0240 |
| (0.0104) | (0.00832) | (0.0166) | |
| Remittance income | -0.0333*** | -0.0181*** | -0.0361*** |
| (0.0102) | (0.00667) | (0.0133) | |
| Forest | 0.0889 | 0.178 | |
| (0.0826) | (0.165) | ||
| Savannah | 0.455*** | 0.911*** | |
| (0.0794) | (0.159) | ||
| Constant | 0.121 | 0.242 | |
| (0.238) | (0.476) |
Table VIII: Hausman Specification Test and Food Crop Productivity and Poverty
| Poverty Measure | Statement of Hypothesis | Test Statistic | Decision Rule |
| Headcount Ratio | H0: Random effects model | 12.05 (0.09) | Reject Null |
| Ha: Fixed effects model | |||
| Poverty Gap | H0: Random effects model | 9.02 (0.25) | Do not Reject Null |
| Ha: Fixed effects model | |||
| Poverty Severity | H0: Random effects model | 9.02 (0.25) | Do not Reject Null |
| Ha: Fixed effects model |
h) Effect of Cash Crop Productivity on Poverty
The results of the Hausman specification test in Table (X) indicate poverty headcount ratio is estimated by the fixed effects model which is consistent but not efficient. Poverty gap and severity are estimated by random effects model which is consistent and efficient. The study finds cash crop productivity increases by reduces poverty headcount ratio, poverty gap, poverty severity, by , , respectively. Poverty elasticity in response to productivity growth in cash crop production, is negative for all poverty indicators (Table IX). The elasticity values are higher than those estimated for food crop productivity growth in Table (VII). Cash crops mainly provide income to support household consumption bundles. Cocoa productivity growth increased income to support household consumption expenditure growth towards poverty reduction in Ghana (Danso-Abbeam, & Baiyegunhi, 2018). Cash crops revenue increase per capita expenditure towards poverty reduction in Vietnam (Cuong, 2009). The effect of an increase in household size on poverty is positive and significant for all poverty indicators. Balagtasa et al. (2014) found an additional family member in rural Bangladesh slightly increased the probability of falling into poverty. A related study revealed an increase in variance of household dependence ratio decreases variance in consumption expenditure by 0.14 standard deviation which negatively affects consumption to increase poverty (Dzanku, 2015b). Table IX shows a reduction in all poverty indicators with respect to an increase in years of education. Additional years of education promote household management of resources to positively influence consumption. Thistle & Piesse (2007), found education increases productivity in farm and non-farm sector. Educated farmers search for new information and use new technologies efficiently to increase productivity towards poverty reduction.
The study further reveals positive poverty elasticity with respect to increase in distance to water sources because of the constraints introduced on consumption due to longer time and effort to access water, and loss of productive hours. Access to livestock income growth by reduces probability of poverty headcount ratio by due to use of additional income to increase consumption. Katagame et al. (2017) found that pigs contribute toward household income to reduce poverty among farmers' in Mimika. Remittance income is associated with poverty reduction through its effect on food consumption expenditure. A increase in remittance income negatively reduces food insecurity in rural Mali by to provide adequate and nutritious diet for households (Generoso 2015).
Table IX: Cash Crop Productivity and Poverty
| Variables | Poverty Headcount Ratio | Poverty Gap | Poverty Severity |
| Outputvalueha | -0.283*** | -0.440*** | -0.879*** |
| (0.0382) | (0.136) | (0.272) | |
| Household size | 1.473*** | 0.527*** | 1.053*** |
| (0.105) | (0.0834) | (0.167) | |
| Education years | -0.447*** | -0.131*** | -0.263*** |
| (0.0549) | (0.0446) | (0.0892) | |
| Dayssick | -0.0233 | -0.0767 | -0.153 |
| (0.0842) | (0.0715) | (0.143) | |
| Diswater source | 0.120*** | 0.0307 | 0.0615 |
| (0.0317) | (0.0277) | (0.0554) | |
| Livestockincome | -0.119*** | 0.00321 | 0.00642 |
| (0.0241) | (0.0190) | (0.0381) | |
| Remittance | -0.0792*** | -0.0678*** | -0.136*** |
| (0.0220) | (0.0186) | (0.0371) | |
| Forest | 0.250 | 0.501 | |
| (0.247) | (0.495) | ||
| Savannah | 0.104 | 0.208 | |
| (0.226) | (0.451) | ||
| Constant | -0.146 | -0.292 | |
| (0.722) | (1.444) |
Table X: Hausman Specification Test and Cash Crop Productivity and Poverty
| Poverty Measure | Statement of Hypothesis | Test Statistic | Decision Rule |
| Headcount Ratio | H0: Random effects model | 18.56 (0.01) | Reject Null |
| Ha: Fixed effects model | |||
| Poverty Gap | H0: Random effects model | 2.49 (0.92) | Do not Reject Null |
| Ha: Fixed effects model | |||
| Poverty Severity | H0: Random effects model | 2.49 (0.92) | Do not Reject Null |
| Ha: Fixed effects model |
V. CONCLUSIONS
Food and cash crop productivities increase to provide food and income to reduce poverty. Crop farmers poverty rate is disaggregated into food and cash crops which have different growth paths and unequal pathways toward poverty reduction and their role on poverty reduction is assessed differently in this study. Food crops such as maize, rice, millet, cassava, etc mainly supply household food staples and cash crops such as cocoa, rubber, oil palm, cotton, etc. provide income towards poverty reduction. The study finds poor farmers mainly depend on agriculture and food and cash crops productivities grow to provide food and income to increase consumption expenditures mainly on food among poor farmers to reduce poverty. Non-poor farmers spend higher on food and non-food items which include health, education, transportation, clothing, and remittances, etc to reduce poverty. Food crop farmers have higher poverty rates than cash crop farmers and food and cash crops have considerable importance towards poverty reduction between 2005 and 2013. Food and cash crop productivities growth reduce poverty moderately which is inelastic and efforts made to support farmers with resources and skills to increase productivity of food and cash crops will count towards poverty reduction. The farmers should benefit from improved crop varieties, production methods, due to low use of recommended agronomic practices, capacity building, and market access towards productivity growth to provide food and income to reduce poverty.