
I. INTRODUCTION
Skeleton has always helped in genetic, anthropological, odontological and forensic investigation of living and dead individuals. Skull bones and pelvis are the most commonly used bones in gender and age determination. The mandible is the most dimorphic and strongest bone of the skull and therefore, it is useful for gender and race determination
Author : Professor, Dept of Oral Medicine and Radiology Bapuji Dental College and Hospital Davangere, Karnataka.
Author : Professor and HOD Dept of Oral Medicine and Radiology Bapuji Dental College and Hospital Davangere, Karnataka.
in forensic and archaeological cases where intact skull is not found. Sexual dimorphism in the mandible is noticed in its shape and size. Previous studies have shown that the difference between sexes are generally more significant in the mandibular ramus than the body because the relative development (size, strength, and angulation) of the muscles of mastication affects the gender expression of mandible as the masticatory forces exerted are different for men and women
Panoramic radiography has been used as an important tool in forensic anthropology and studies have been conducted to make a biometric system for human identification. It is commonly used for obtaining a comprehensive overview of the maxillofacial complex and the image quality of the panoramic radiograph is increased by the digital panoramic radiography. The advantages of digital images are their broad anatomical coverage, low patient exposure, and less time required for image acquisition and the disadvantages are magnification, geometric distortion and positioning errors.[4,5]
Normally morphological and metric methods are used to estimate the gender of a mandible. The mandibles of males and females are differentiated by their size, chin shape, muscular markings, and gonial angle or flare. Determining sex using metric parameters like condylar breadth, coronoid breadth, gonial breadth, ramus breadth and height, height of the body of mandible, etc. are easy and more reliable compare to traditional non-metric methods. Therefore, by combining the reliable metric parameters and digital radiography we can get a more accurate gender estimation.
II. AIMS & OBJECTIVES
To compare the measurements on the mandibular ramus & body of the mandible and use them in gender determination among various age groups.
To measure the width & height of mandibular ramus and height of the body of mandible on digital orthopantomograms among various age groups.
III. MATERIALS AND METHODS
A retrospective study was conducted on 120 digital orthopantomograms of the Indian individuals, which were later divided into three age groups of age between 21-30 years, 31-40 years and 41-50 years respectively. 40 digital orthopantomograms were taken under each age group consisting of 20 males and 20 females. Ideal Orthopantomograms of the patients with full set of permanent teeth, minimal alveolar bone loss and without any artefacts were included in the study whereas radiographs with developmental disturbances of the skull, mandibular deformities, pathologies, fractures and distorted digital images were excluded from the study.
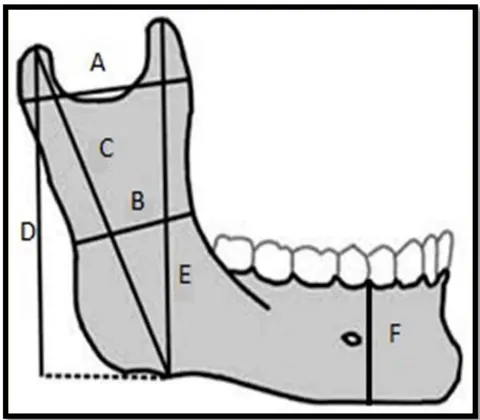
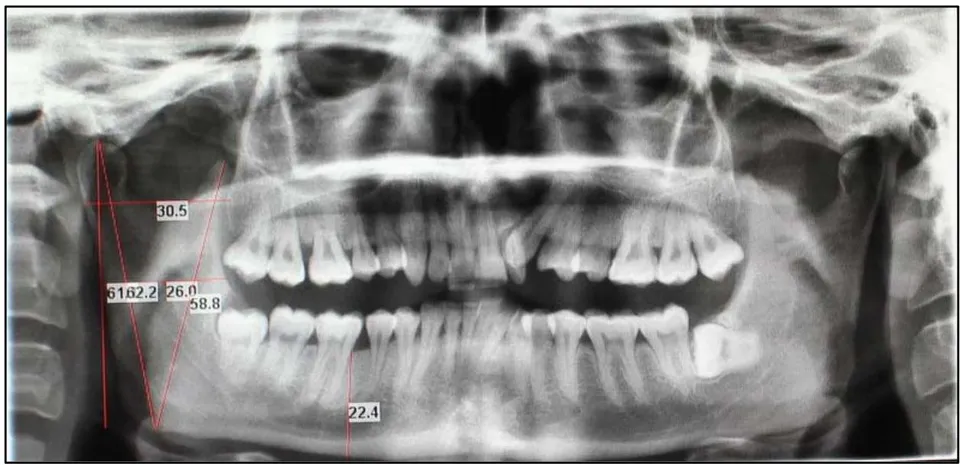
The Digital OPG images that was obtained using PLANMECA PROLINE XC machine were measured using PLANMECA ROMEXIS 2.3.1.R software. The following measurements were taken on the right side of OPG's digitally (Fig.1 & Fig.2):
Maximum ramus breadth: The distance between the most anterior point on the mandibular ramus and a line connecting the most posterior point on the condyle and the angle of jaw.
Minimum ramus breadth: Smallest anterior-posterior diameter of the ramus.
Condylar height/maximum ramus height: Height of the ramus of the mandible from the most superior point on the mandibular condyle to the tubercle, or most protruding portion of the inferior border of the ramus.
Projective height of ramus: Projective height of ramus between the highest point of the mandibular condyle and lower margin of the bone.
Coronoid height: Projective distance between coronion and lower wall of the bone.
Height of the body of mandible: The distance from the inferior surface of the mandibular body to the height of the alveolar crest.
To eliminate the inter-observer variations and determination of reliability and reproducibility of the measurements, the images were evaluated by two qualified Oral Radiologist under standard conditions in a semi-dark room with ambient light & using magnifying lens icon.
IV. STATISTICAL ANALYSIS
Mean comparison between the age groups were done using Independent Student t-test. ANOVA test was used to compare the difference in the means of three groups for individual parameter for both the observers. ROC (Receiver operating characteristic) curve analysis was used to estimate the cut-off value for males and females, sensitivity and specificity for individual parameters among various age groups. This analysis has not been done in the literature before for similar kind of studies. Bland Altman analysis was used estimating agreement between observer 1 and observer 2.
V. RESULTS
Statistical analysis showed that each variable was a significant predictor in classifying a given sample . The mean values for all the measurements were higher for the males as compared to the females. (Table 1)
| Parameters | Sex | Sample Size | Ob 1 | Ob 2 | ||||
| Mean (mm) | Std. Deviation (mm) | P-Value | Mean (mm) | Std. Deviation (mm) | P-Value | |||
| Maximum Ramus Breadth | M | 60 | 37.2 | 2.79 | 0.027 | 37.9 | 2.68 | 0.131 |
| F | 60 | 34.3 | 2.80 | 0.075 | 34.6 | 2.86 | 0.310 | |
| Minimum Ramus Breadth | M | 60 | 29.0 | 2.14 | 0.810 | 28.0 | 2.12 | 0.883 |
| F | 60 | 27.3 | 2.58 | 0.342 | 26.3 | 2.48 | 0.383 | |
| Condylar Height | M | 60 | 62.9 | 4.11 | 0.293 | 62.8 | 4.10 | 0.343 |
| F | 60 | 55.9 | 3.14 | 0.109 | 56.0 | 3.02 | 0.165 | |
| Projective Height of Ramus | M | 60 | 60.7 | 4.17 | 0.171 | 60.8 | 4.10 | 0.310 |
| F | 60 | 54.0 | 3.55 | 0.168 | 53.9 | 3.47 | 0.321 | |
| Coronoid Height | M | 60 | 56.7 | 4.45 | 0.963 | 56.2 | 4.35 | 0.911 |
| F | 60 | 50.2 | 2.88 | 0.756 | 49.8 | 2.87 | 0.546 | |
| Height of the Body of Mandible | M | 60 | 28.9 | 2.40 | 0.635 | 28.8 | 2.50 | 0.776 |
| F | 60 | 26.0 | 2.09 | 0.821 | 25.9 | 2.18 | 0.884 | |
The Bland & Altman analysis for inter-observer agreement showed statistically significant evidence of agreement between both the observers.
According to ROC curve analysis the decreasing order of various parameters for the sensitivity for cut-off values in males and females was:
Projective Height of Ramus > Condylar Height > Minimum Ramus Breadth = Coronoid Height > Maximum Ramus Breadth > Height of the Body of Mandible.
The decreasing order of various parameters for the specificity for cut-off values in males and females was: Height of the Body of Mandible Coronoid Height Condylar Height Projective Height of Ramus Maximum Ramus Breadth Minimum Ramus Breadth.
The decreasing order of various parameters on mandibular ramus and body according to prediction accuracy was: Condylar Height > Coronoid Height = Projective Height of Ramus > Height of the Body of Mandible > Maximum Ramus Breadth > Minimum Ramus Breadth.
The overall prediction accuracy for mandibular ramus parameters came out to be whereas the overall prediction accuracy for mandibular body parameter came out to be .
VI. DISCUSSION
In the present study a total of six parameters were measured namely; maximum ramus breadth, minimum ramus breadth, condylar height, projective height of ramus, coronoid height and height of the body of mandible which were similar to the study carried out by Saini V et al. (2011), Indira AP et al. (2012), Samantha K et al. (2016), Sairam V et al. (2016), Jambunath U et al. (2016), Kartheeki B et al. (2017).
1. Maximum ramus breadth
In the present study, the average cut-off point for Maximum Ramus Breadth in males and females of all the groups came out to be 34.9mm which was similar to that in the study conducted by Sikka A et al. (2016) in which it was 35mm and lesser than the cut-off point taken in the study conducted by Vinay G et al. (2013) in which it was 39.5mm.
In the present study, the accuracy of Maximum Ramus Breadth for males was and for females was which was greater than in the study conducted by Vinay G et al. (2013) in which it was for males and for females. It was also greater than the male accuracy and lesser that the female accuracy in the study conducted by Dong H et al. (2015) in which it was and . The combined accuracy for Maximum Ramus Breath was which was greater than in the study done by Saini V (2013) in which it was and Dong H et al. (2015) in which it was .
2. Minimum ramus breadth
In the present study, the average cut-off point for Minimum Ramus Breadth in males and females of all the groups came out to be 27.1mm which was lesser than the cut-off point taken in the study conducted by Saini V et al. (2011) and Vinay G et al. (2013) in which it was 30.5mm.
In the present study, the accuracy of Minimum Ramus Breadth for males was and for females was which was greater than the male accuracy and lesser than the female accuracy noted in the study conducted by Vinay G et al. (2013) in which it was for males and for females. The combined accuracy for Minimum Ramus Breath was which was greater than in the study done by Saini V (2013) in which it was .
3. Condylar height
In the present study, the average cut-off point for Condylar Height in males and females of all the groups came out to be which was lesser than the cut-off point taken in the study conducted by Datta A et al. (2015) in which it was and greater than the cut-off point taken in the study conducted by Franklin D et al. (2008) in which it was . But it was similar to the cut-off value given by Saini V et al. (2011) in which it was .
In the present study, the accuracy of Condylar Height for males was and for females was which was nearly similar to the accuracy noted in the study conducted by Datta A et al. (2015) in which it was for males and for females. But our accuracy was greater than the accuracy noted in the study conducted by Saini Vet al. (2011) in which it was of males and for females, Dong H et al. (2015) in which it was for males and for females. The combined accuracy for Condylar Height was which was greater than in the study done by Franklin D et al. (2008) in which it was , Saini V et al. (2011) in which it was and Dong H et al. (2015) in which it was .
4. Projective height of ramus
In the present study, the average cut-off point for Projective Height of Ramus in males and females of all the groups came out to be 55.6mm which was greater than the cut-off point taken in the study conducted by Saini V et al. (2011) in which it was 50.7mmand also greater than the cut-off point taken in the study conducted by Datta A et al. (2015) in which it was 50.1mm.
In the present study, the accuracy of Projective Height of Ramus for males was and for females was which was greater than the accuracy noted in the study conducted by Saini V et al. (2011) in which it was for males & for females and also greater than the male accuracy in the study conducted by Wankhede KP et al. (2015) in which it was but lesser than the female accuracy which was . The combined accuracy for Projective Height of Ramus was which was greater than in the study done by Saini V et al. (2011) in which it was and Wankhede KP et al. (2015) in which it was .
5. Coronoid height
In the present study, the average cut-off point for Coronoid Height in males and females of all the groups came out to be which was lesser than the cut-off point taken in the study conducted by Saini V et al. (2011) in which it was 58.3mmand also lesser than the cut-off point taken in the study conducted by Datta A et al. (2015) in which it was 56.7mm. But our value is somewhat near to the value given in the study conducted by Franklin D et al. (2008) in which it was 55.5mm In the present study, the accuracy of Coronoid Height for males was and for females was which was greater than the accuracy noted in the study conducted by Saini Vet al. (2011) in which it was for males & for females. But it was lesser than the male accuracy and greater than the female accuracy in the study conducted by Datta A et al. (2015) in which it was for both males and females. The combined accuracy for Coronoid Height was which was greater than in the study done by Franklin D et al. (2008) in which it was and Saini V et al. (2011) in which it was .
6. Height of the body of mandible
In the present study, the average cut-off point for the Height of the Body of Mandible in males and females of all the groups came out to be 28.3mm which was greater than the cut-off point taken in the study conducted by Sikka A et al. (2016) in which it was 23.0mmand almost close to the cut-off point taken in the study conducted by Datta A et al. (2015) and Wankhede KP et al. (2015) in which it was 25.7mm.
In the present study, the accuracy of the Height of the Body of Mandible for males was and for females was . It was lesser than the male accuracy and greater than the female accuracy noted in the study conducted by Wankhede KP et al. (2015) & Datta A et al. (2015) in which it was & for males & & for females. The combined accuracy for the Height of the Body of Mandible was which was greater than in the study done by Saini V (2013), Wankhede KP et al. (2015) and Sikka A et al. (2016) in which it was , and .
In the present study, the highest sexual dimorphism was seen with Condylar Height followed by Projective Height of Ramus and Coronoid Height which was similar to the study conducted by Indira AP et al. (2012) & Kartheeki B et al. (2017) in which all variables showed strong sexual dimorphism with the mandibular ramus in terms of condylar height, coronoid height followed by projective height of ramus. In the present study least sexual dimorphism was noticed with the Minimum Ramus Breadth similar to the study conducted by Saini V et al. (2011) and Samantha K et al. (2016).
In the present study, the overall prediction accuracy for Mandibular Ramus parameters in males was and in females was with a combined accuracy of which was almost similar to the study conducted by Saini V et al. (2011) the overall prediction rate using five variables was and also similar to the study conducted by Kartheeki B et al. (2017) where overall prediction rate using all the five variables was .
The overall prediction accuracy for the Height of the Body of Mandible in males was and in females was with a combined accuracy of . This proved that the Mandibular Ramus parameters are more significant than the Height of the Body of Mandible measurement parameter in determining gender on the digital orthopantomograms.
Limitations of the present study are the inability to reliably estimate gender in the sub-adult range, edentulous patients, and severely deformed mandibular ramus.
VII. CONCLUSION
In conclusion, the ramus of the mandible has a better potential than the body of the mandible in determination of sex. However, larger sample size and more diverse population would enhance the reliability of this parameter.
| Age Groups (years) | Ob 1 | Ob 2 | ||||
| Cut off value (mm) | Sensitivity | Specificity | Cut off value (mm) | Sensitivity | Specificity | |
| Group I (21-30) | >56.4 | 95% | 80% | >59.2 | 85% | 95% |
| Group II (31-40) | >60.1 | 85% | 90% | >60 | 80% | 95% |
| Group III (41-50) | >56.6 | 100% | 75% | >56.7 | 95% | 80% |
| Age Groups (years) | Ob 1 | Ob 2 | ||||
| Cut off value (mm) | Sensitivity | Specificity | Cut off value (mm) | Sensitivity | Specificity | |
| Group I (21-30) | >55.6 | 95% | 80% | >55.6 | 95% | 80% |
| Group II (31-40) | >57.3 | 90% | 80% | >58.8 | 75% | 90% |
| Group III (41-50) | >53.8 | 100% | 65% | >53.7 | 100% | 70% |
| Age Groups (years) | Ob 1 | Ob 2 | ||||
| Cut off value (mm) | Sensitivity | Specificity | Cut off value (mm) | Sensitivity | Specificity | |
| Group I (21-30) | >51 | 100% | 75% | >51.5 | 100% | 75% |
| Group II (31-40) | >53 | 80% | 85% | >53 | 85% | 85% |
| Group III (41-50) | >54.3 | 70% | 100% | >52.5 | 80% | 90% |
| Age Groups (years) | Ob 1 | Ob 2 | ||||
| Cut off value (mm) | Sensitivity | Specificity | Cut off value (mm) | Sensitivity | Specificity | |
| Group I (21-30) | >28.7 | 50% | 100% | >25.8 | 90% | 55% |
| Group II (31-40) | >28.2 | 65% | 90% | >25.9 | 90% | 55% |
| Group III (41-50) | >27.9 | 75% | 80% | >28.3 | 65% | 90% |
| Age Groups (years) | Sample Size | Arithmetic Mean (mm) | 95% Confidence Interval (mm) | Lower limit (mm) | 95% Confidence Interval (mm) | Upper Limit (mm) | 95% Confidence Inetval (mm) | p-value |
| Group I (21-30) | 40 | -1.03 | -1.37 to -0.69 | -3.11 | -3.70 to -2.53 | 1.05 | 0.47 to 1.64 | < 0.0001 |
| Group II (31-40) | 40 | -0.32 | -0.72 to 0.09 | -2.79 | -3.48 to -2.09 | 2.16 | 1.46 to 2.85 | 0.122 |
| Group III (41-50) | 40 | -0.07 | -0.49 to 0.35 | -2.63 | -3.35 to -1.91 | 2.49 | 1.77 to 3.20 | 0.727 |
| Age Groups (years) | Sample Size | Arithmetic Mean (mm) | 95% Confidence Interval (mm) | Lower limit (mm) | 95% Confidence Interval (mm) | Upper Limit (mm) | 95% Confidence Interval (mm) | p-value |
| Group I (21-30) | 40 | 0.94 | 0.73 to 1.14 | -0.32 | -0.67 to 0.04 | 2.19 | 1.83 to 2.54 | < 0.0001 |
| Group II (31-40) | 40 | 0.91 | 0.76 to 1.07 | -0.04 | -0.31 to 0.23 | 1.87 | 1.60 to 2.14 | < 0.0001 |
| Group III (41-50) | 40 | 1.06 | 0.87 to 1.25 | -0.12 | -0.45 to 0.21 | 2.24 | 1.91 to 2.57 | < 0.0001 |
| Age Groups (years) | Sample Size | Arithmetic Mean (mm) | 95% Confidence Interval (mm) | Lower limit (mm) | 95% Confidence Interval (mm) | Upper Limit (mm) | 95% Confidence Interval (mm) | p-value |
| Group I (21-30) | 40 | -0.22 | -0.66 to 0.22 | -2.93 | -3.69 to -2.16 | 2.49 | 1.73 to 3.25 | 0.326 |
| Group II (31-40) | 40 | 0.15 | -0.20 to 0.49 | -1.98 | -2.58 to -1.38 | 2.28 | 1.68 to 2.87 | 0.396 |
| Group III (41-50) | 40 | 0.06 | -0.36 to 0.47 | -2.49 | -3.20 to -1.77 | 2.61 | 1.89 to 3.32 | 0.781 |
| Age Groups (years) | Sample Size | Arithmetic Mean (Mm) | 95% Confidence Interval (Mm) | Lower Limit (Mm) | 95% Confidence Interval (Mm) | Upper Limit (Mm) | 95% Confidence Interval (Mm) | p-Value |
| Group I (21-30) | 40 | -0.23 | -0.56 To 0.10 | -2.24 | -2.80 To -1.67 | 1.78 | 1.22 To 2.35 | 0.168 |
| Group II (31-40) | 40 | 0.30 | 0.10 To 0.49 | -0.89 | -1.23 To -0.56 | 1.48 | 1.15 To 1.82 | 0.004 |
| Group III (41-50) | 40 | -0.12 | -0.54 To 0.31 | -2.72 | -3.45 To -1.99 | 2.49 | 1.76 To 3.22 | 0.587 |
| Age Groups (years) | Sample Size | Arithmetic Mean (mm) | 95% Confidence Interval (mm) | Lower limit (mm) | 95% Confidence Interval (mm) | Upper Limit (mm) | 95% Confidence Interval (mm) | p-value |
| Group I (21-30) | 40 | -0.01 | -0.28 to 0.27 | -1.72 | -2.20 to -1.24 | 1.71 | 1.23 to 2.19 | 0.971 |
| Group II (31-40) | 40 | 0.61 | 0.33 to 0.90 | -1.14 | -1.63 to -0.65 | 2.36 | 1.87 to 2.85 | 0.0001 |
| Group III (41-50) | 40 | 0.65 | 0.37 to 0.92 | -1.03 | -1.50 to -0.56 | 2.32 | 1.85 to 2.79 | < 0.0001 |
| Age Groups (years) | Sample Size | Arithmetic Mean (mm) | 95% Confidence Interval (mm) | Lower limit (mm) | 95% Confidence Interval (mm) | Upper Limit (mm) | 95% Confidence Interval (mm) | p-value |
| Group I (21-30) | 40 | -0.01 | -0.12 to 0.09 | -0.66 | -0.84 to -0.48 | 0.63 | 0.45 to 0.82 | 0.812 |
| Group II (31-40) | 40 | 0.18 | -0.02 to 0.38 | -1.02 | -1.36 to -0.68 | 1.38 | 1.04 to 1.72 | 0.071 |
| Group III (41-50) | 40 | 0.13 | -0.00 to 0.27 | -0.68 | -0.91 to -0.45 | 0.95 | 0.72 to 1.18 | 0.051 |
| S.No. | PARAMETERS | Ob 1 | Ob 2 | ||||
| Males | Females | Total | Males | Females | Total | ||
| 1. | Maximum Ramus Breadth | 83.3% | 66.7% | 75% | 73.3% | 83.3% | 78.3% |
| 2. | Minimum Ramus Breadth | 85% | 55% | 70% | 68.3% | 75% | 71.7% |
| 3. | Condylar Height | 93.3% | 81.7% | 87.5% | 90% | 90% | 90% |
| 4. | Projective Height of Ramus | 95% | 75% | 85% | 90% | 81.7% | 85.8% |
| 5. | Coronoid Height | 83.3% | 86.7% | 85% | 88.3% | 83.3% | 85.8% |
| 6. | Height of the Body of Mandible | 63.3% | 90% | 76.7% | 81.7% | 68.3% | 75% |
| S.No. | PARAMETERS | Ob 1 | Ob 2 | ||||
| Males | Females | Total | Males | Females | Total | ||
| 1. | Mandibular Ramus | 88% | 73% | 80.5% | 82% | 82.7% | 82.3% |
| 2. | Body of the Mandible | 63.3% | 90% | 76.7% | 81.7% | 68.3% | 75% |