## I. INTRODUCTION
Following non-melanoma skin cancer, breast cancer is the most common type of cancer among women and the second worldwide, corresponding to $25.2\%$ of all cancers in world statistics and $29.5\%$ in Brazil. Breast cancer is rare in men, representing less than $1\%$ of cases (American cancer society (2019), Instituto Nacional de Cancer, Brazil, 2017).
To successfully treat and control breast cancer in the female population, it is essential to identify risk factors for the disease. Moreover, early diagnosis and immediate access to treatment are decisive conditions for the disease prognosis (American Cancer Society (2019), Instituto Nacional de Cancer, Brazil, 2017).
The histological grade of malignancy proposed by Scarff, Bloom, and Richardson and further modified by Elston and Ellis, known as the Nottingham Classification System, is considered one of the main factors for determining the prognosis of breast cancer (Beck et al., 2011, Chen et al., 2017, Xu et al., 2016, Romo-Bucheli et al., 2017, Lu et al., 2018).
Intending to offer agility and safety throughout the diagnosis of diseases, Artificial Intelligence has been increasingly used as a support tool in recent years (Wernick et al., 2010, Mulrane et al., 2008, Jones et al., 2009, Hitchkock et al., 2011, Sommer et al., 2013, Singh et al., 2014., Buzin et al., 2015, Vu et al., 2016, Dordea et al., 2016, Yu et al., 2016, Hennig et al., 2017, Eulenberg et al., 2017, Pesapane et al., 2018, Loukas et al., 2013, Ching et al., 2018).
Machine learning is advantageous due to its potential to gather a large volume of information, once the appropriate accuracy and precision are achieved, on a specific disease in a single digital tool; suppressing the subjectivity of human evaluation with agility in the analysis of the material to be studied, aiming at safe and quick diagnoses, which could even be used as a "second specialized opinion" in cases of greater complexity (Wernick et al., 2010, Mulrane et al., 2008, Jones et al., 2009, Misselwitz et al., 2010).
The present study aimed to perform an automated and reproducible classification of the parameters used by pathologists to diagnose breast cancer: nuclear score, tubular score, and mitotic index. The software used for image analysis and classification (CellProfiler and Tanagra) used for the present study are free. The results obtained by the automated analysis were compared with a pathologist diagnosis (Jones et al., 2009, Carpenter et al., 2006, Lamprecht et al., 2007, Lenz et al., 2017).[^920]
## II. MATERIALS METHODS
# a) The
The study targeted women with breast cancer and presenting the most frequent histological types: infiltrating ductal carcinoma, invasive lobular carcinoma, and the mixed infiltrating lobular ductal form; who underwent surgical treatment for this disease in 2015 and that, until the time of surgery, had not undergone adjuvant chemotherapy or radiotherapy treatments. Complete epidemiological diagnosis and treatment data could be obtained, and histological slides were stained by the Hematoxylin & Eosin method with preserved staining, which enabled digital photographs of adequate quality.
The Santa Rita de Cássia Hospital, located in the city of Vitoria, is considered the main reference hospital for cancer treatment in the Espírito Santo state, providing medical care for 625 women with breast cancer in 2015.
Out of 276 cases selected for meeting the inclusion and exclusion criteria, 52 patients were also excluded by the pathologist at the Hospital Santa Rita de Cassia due to "in situ" suffering from breast cancers. Since these issues could compromise machine learning and, consequently, the automated analysis of these images, this study included 224 cases at the end.
The year 2015 was selected because the Tumor Record Sheets for that year represents, at the beginning of the study, the most recent and complete data released by the Health Information System - Hospital Cancer Registry of the Ministry of Health of the Federal Government of Brazil.
### b) Digitization of histological slides
All histological slides from the 224 selected cases were randomly reviewed by a pathologist without access to patient data at the Hospital Santa Rita de Cassia, aiming to select the samples with the best-preserved color aspect. Twenty images of breast tissue of each selected patient were obtained using a digital camera (Moticam 1000 1.3 MPixel MTC 1000) attached to a light microscope.
### c) Loading images to CellProfiler
Out of 4,480 digitalized photographs in the 40-fold magnification, after their upload to the CellProfiler program, only the artifact-free images were maintained and recognized as adequate by this image analysis program. Therefore, 1937 images were transferred to the CellProfiler software and submitted to its algorithm, generated for each digitized image with 47 quantitative parameters, called attributes.
These attributes are aspects and characteristics, identified by the CellProfiler software that express the averages of the quantitative parameters of the study's objects (the images) and enabled the automated identification and classification of each object.
### d) CellProfiler algorithm
Following an algorithm developed for treating digitized images for the CellProfiler computational environment, all 1997 images were treated in the following sequence of the 9-step algorithm, as shown in Chart 1.
Chart 1: CellProfiler algorithm.
<table><tr><td>Phase</td><td>Cellprofiler pipeline</td></tr><tr><td>1</td><td>Loadimages</td></tr><tr><td>2</td><td>ColorToGray</td></tr><tr><td>3</td><td>ImageMath</td></tr><tr><td>4</td><td>ApplyThreshold</td></tr><tr><td>5</td><td>IdentifyPrimaryObjects</td></tr><tr><td>6</td><td>MeasureObjectSizeShape</td></tr><tr><td>7</td><td>FilterObjects</td></tr><tr><td>8</td><td>MeasureObjectSizeShape</td></tr><tr><td>9</td><td>ExportToDatabase</td></tr></table>
The 1937 digitized photographs treated according to this algorithm resulted in a data set exported to Tanagra cellular image data analysis software. Then, this dataset was distributed in an Excel spreadsheet (Microsoft®), and the automated classifications of the tubular, nuclear and mitotic indexes, as well as the histological degree of malignancy, were acquired.
### e) CellProfiler Algorithm
## i. Phase 1 - Load Images
All the digitized images observed from histological slides at 40-fold magnification were transferred to the CellProfiler software (Figure 1a).
## ii. Phase 2 - Color to Gray
The original scanned images were converted to the white/gray/black spectrum (Figure 1b).
## iii. Phase 3 - ImageMath
Since the CellProfiler software analyzes the study's objects according to the light intensity and the cell nuclei, it was necessary to reverse the nuclei coloration initially stained in black to white and invert the other elements coloring to black (Figure 1c).
## iv. Phase 4 - Apply Threshold
In this stage, a binary image (i.e., an image with only two-pixel intensities, 0 and 1), was created.
## v. Phase 5 – Identify Primary Objects
Cell nuclei were defined and identified as primary objects of the study in this step of the algorithm (Figure 1d).
## vi. Phase 6 – Measure Objects Size and Shape
Primary objects were measured in this step, and the parameters (attributes), identified by the CellProfiler software for each study object, were acquired by the average of these measurements.
## vii. Phase 7 - Filter Objects
An image filtering was used to suppress changes that could interfere in the primary object analysis, eliminating the artifacts and preserving only the cell nuclei (Figure 1e).

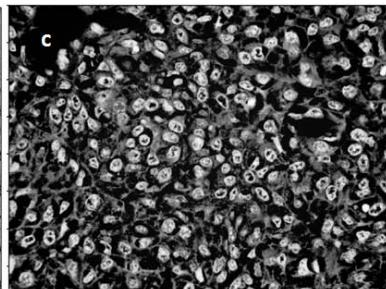
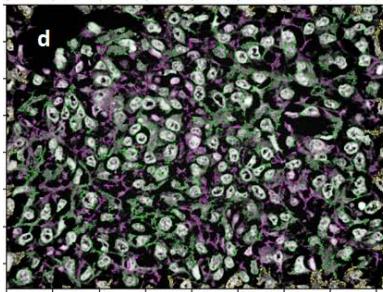
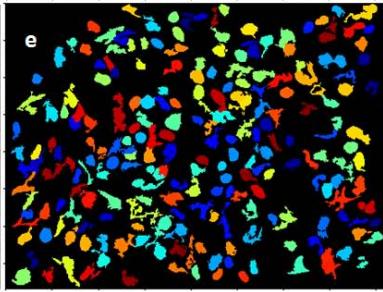
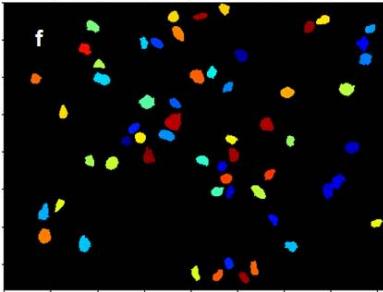 Figure 1a: Original image of breast cancer tissue Figure 1b: Figure 1a converted to greyscale Figure 1c: Figure 1b with inverted intensities Figure 1d & e: Initial identification of nuclei Figure 1f: Remaining objects after filtering for subsequent analysis
## viii. Phase 8 - Measure Object Size and Shape
After applying the image filter and eliminating artifactual changes, a new measurement of the primary objects (cell nuclei) attributes was performed.
## ix. Phase 9 - Export to Database
After the CellProfiler algorithm steps, 47 quantitative data (attributes) for each primary object studied were identified using qualitative data from the digitized images and defined as parameters, enabling both individual identification and analysis of each primary object.
This list of attributes constituted the database exported to the Tanagra image data analysis software.
### f) Classification after machine learning
Tanagra is open-source software for database analysis and statistical analysis developed under the design of machine learning.
In the present study, Tanagra software was used to perform the automated classification of the malignancy degree of breast cancers for the tubular, nuclear and mitotic index scores, as well as for the histological grade. Moreover, 3 parameters used in the definition of the histological grade in breast cancer were analyzed: the tubular aspect, the nuclear morphology, and the cell count in mitosis; from the analysis of the database containing 47 quantitative parameters for each analyzed object of the study.
## III. STATISTICAL ANALYSIS
The tubular, nuclear, and mitotic index scores, which together define the histological degree of malignancy in breast cancer, were determined. The statistical parameters of Predictive Values, Accuracy, Error, and the Kappa Index of agreement between the pathologist and the medical program analyzer, were also used in this phase. The programs Tanagra and Med Calc were used for statistical processing. The statistical parameters gathered were used to determine the histological degree of malignancy.
## IV. RESULTS
The present study aimed to perform an automated and reproducible classification of the pathological parameters used to diagnose breast cancer: nuclear score, tubular score, and mitotic index.
The automated classification results are depicted in Table 1, while the outcomes comparing the pathological and the automated diagnoses are shown in Table 2. A scatter plot of the automated classification resulted from machine learning is exhibited in Figure 2.
Table 1: Results of the malignancy classification based on image analysis and subsequent classification based on machine learning
<table><tr><td colspan="2">Tubular score</td><td>n</td><td>%</td></tr><tr><td colspan="2">1 (a)</td><td>1</td><td>0.5</td></tr><tr><td>2 (b)</td><td></td><td>45</td><td>22.5</td></tr><tr><td colspan="2">3 (c)</td><td>154</td><td>77</td></tr><tr><td></td><td></td><td></td><td></td></tr><tr><td colspan="2">Total</td><td>200</td><td>100</td></tr><tr><td></td><td></td><td></td><td></td></tr><tr><td colspan="2">Nuclear score</td><td>n</td><td>%</td></tr><tr><td></td><td></td><td></td><td></td></tr><tr><td>1 (a)</td><td></td><td>3</td><td>1.5</td></tr><tr><td>2 (b)</td><td></td><td>108</td><td>54</td></tr><tr><td colspan="2">3 (c)</td><td>89</td><td>44.5</td></tr><tr><td></td><td></td><td></td><td></td></tr><tr><td colspan="2">Total</td><td>190</td><td>100</td></tr><tr><td></td><td></td><td></td><td></td></tr><tr><td colspan="2">Mitotic index score</td><td>n</td><td>%</td></tr><tr><td></td><td></td><td></td><td></td></tr><tr><td>1 (a)</td><td></td><td>71</td><td>35.5</td></tr><tr><td>2 (b)</td><td></td><td>101</td><td>50.5</td></tr><tr><td colspan="2">3 (c)</td><td>28</td><td>14</td></tr><tr><td></td><td></td><td></td><td></td></tr><tr><td colspan="2">Total</td><td>200</td><td>100</td></tr></table>
Table 2: Results of the comparison between pathological and automated analysis
<table><tr><td>Statistical indicators</td><td>tubular score</td><td>nuclear score</td><td>mitotic index</td><td>histological grade</td></tr><tr><td>Positive Predictive Value c</td><td>0.99</td><td>0.91</td><td>0.95</td><td>0.97</td></tr><tr><td>Positive Predictive Value b</td><td>0.88</td><td>0.62</td><td>0.23</td><td>0.53</td></tr><tr><td>Accuracy</td><td>0.97</td><td>0.78</td><td>0.72</td><td>0.81</td></tr><tr><td>Incorrect classification (error)</td><td>0.03</td><td>0.21</td><td>0.28</td><td>0.19</td></tr><tr><td>Kappa index of agreement (K)</td><td>0.91</td><td>0.55</td><td>0.49</td><td>0.55</td></tr></table>
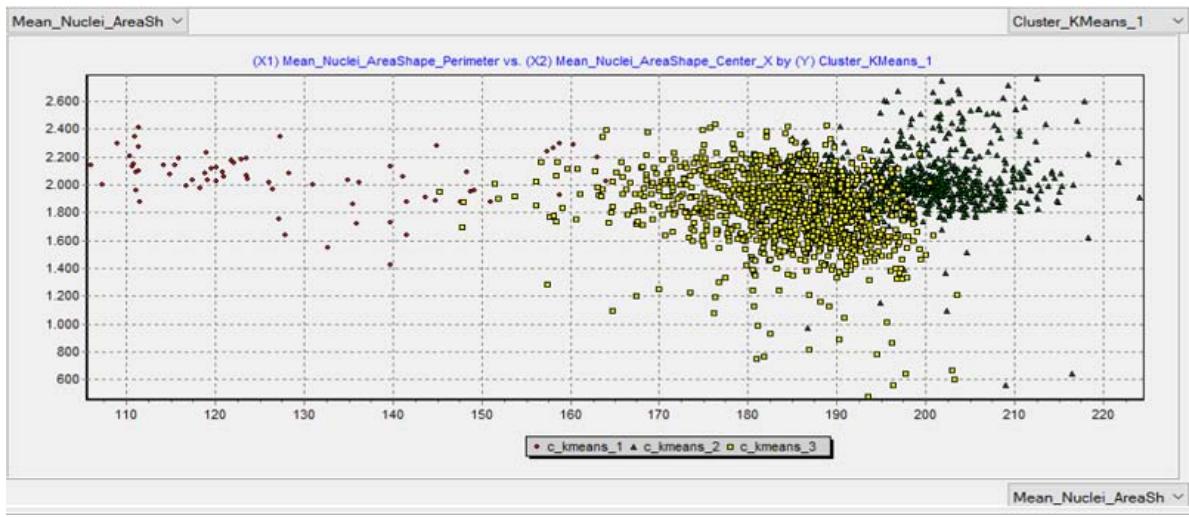
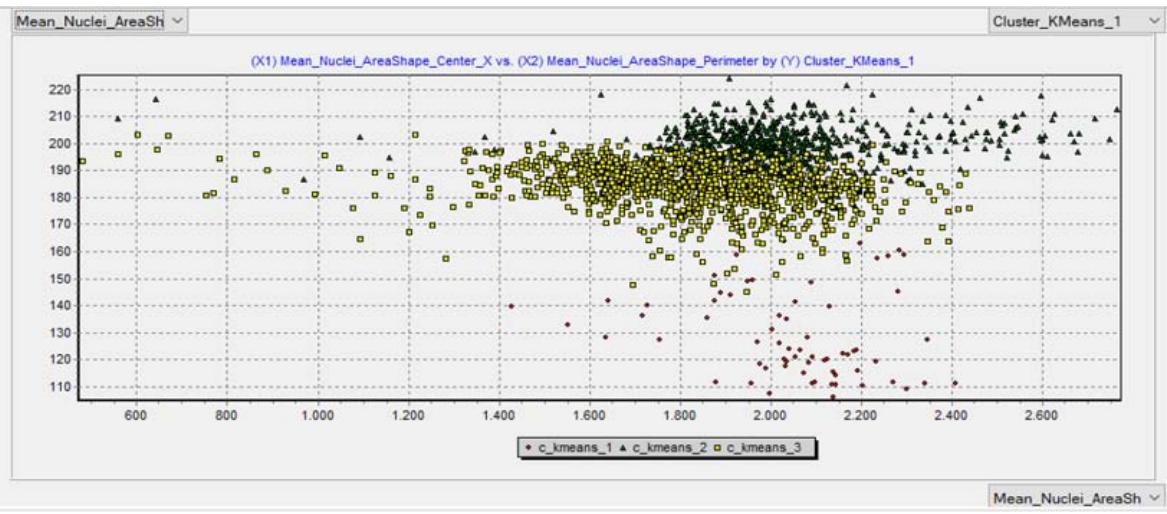 Figure 2a: Classification of malignancy using the tubular score Figure 2b: Classification of malignancy using the nuclear score
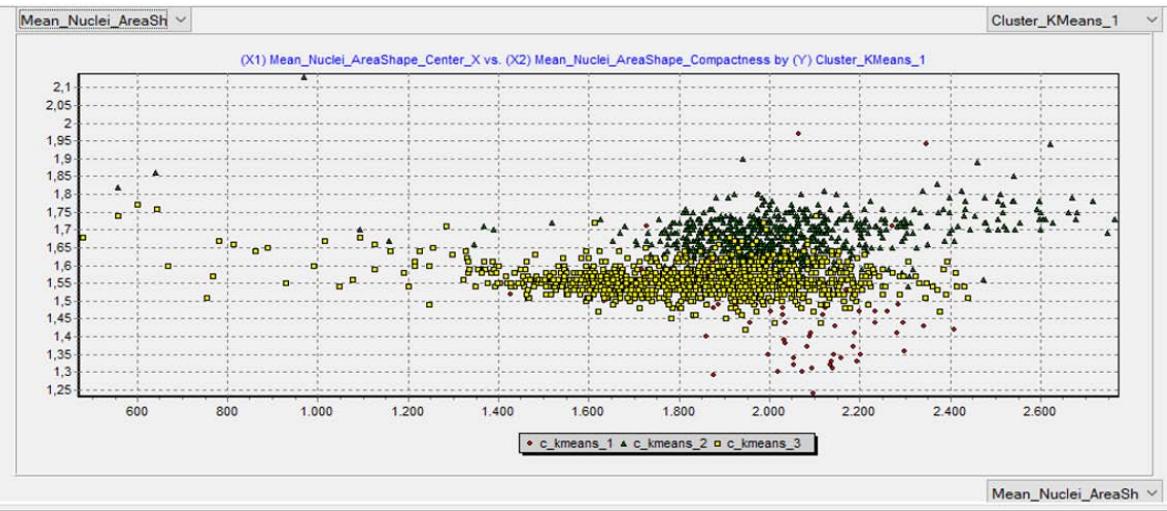 Figure 2c: Classification of malignancy using the mitotic index
Regarding the nuclear score automated classification, the Kappa value represents a sufficient result, while the other analyzed parameters (nuclear score, mitotic index, and histological grade) are considered weak. However, the present study is a pilot study, and further studies are needed to bring more precise results to light.
## V. DISCUSSION
Artificial Intelligence, particularly linked to machine learning, has been increasingly used as a safe and effective tool in disease diagnosis and prognosis, especially on studies assessing breast cancer, a disease of high impact on several women's lives.
This study stands out as a pioneering publication using free access software to diagnose the histological degree of malignancy in breast cancer. Thus, the automated analysis to obtain safe diagnoses of histopathological parameters is a feasible tool since a dataset with sufficient information for adequate machine learning can provide an efficient analysis that ensures remarkable accuracy.
In conclusion, digitalized images of breast cancer histological slides enabled the automated analysis of histopathological parameters, converting them into quantitative parameters for the diagnosis, and defining the histological degree of malignancy. A database expansion is necessary to optimize the analysis and provide the machine sufficient information and data, postulating solid concepts and knowledge to support all requested aspects of the analysis.
In this sense, further multidisciplinary studies covering machine learning and breast cancer in women may lead to significant novel contributions.
Conflicts of interest: None declared.
Author contributions: PCRB: Taking images, writing, cooperation with the pathology. RDJ: pathological diagnosis. CSMN: Image analysis, writing. IPPQ: Image analysis, writing. SSS: Image analysis, writing. DL: Supervision, statistical processing, machine learning.
Generating HTML Viewer...
References
29 Cites in Article
(2019). Breast Cancer Facts & Figures 2019-2020.
Teresa Araújo,Guilherme Aresta,Eduardo Castro,José Rouco,Paulo Aguiar,Catarina Eloy,António Polónia,Aurélio Campilho (2017). Classification of breast cancer histology images using Convolutional Neural Networks.
Andrew Beck,Ankur Sangoi,Samuel Leung,Robert Marinelli,Torsten Nielsen,Marc Van De Vijver,Robert West,Matt Van De Rijn,Daphne Koller (2011). Systematic Analysis of Breast Cancer Morphology Uncovers Stromal Features Associated with Survival.
Aline Buzin,Fernanda Pinto,Kathleen Nieschke,Anja Mittag,Tadeu De Andrade,Denise Endringer,Attila Tarnok,Dominik Lenz (2015). Replacement of specific markers for apoptosis and necrosis by nuclear morphology for affordable cytometry.
Anne Carpenter,Thouis Jones,Michael Lamprecht,Colin Clarke,In Kang,Ola Friman,David Guertin,Joo Chang,Robert Lindquist,Jason Moffat,Polina Golland,David Sabatini (2006). CellProfiler: image analysis software for identifying and quantifying cell phenotypes.
J Chen,Y Li,J Xu,L Gong,L Wang,W Liu,J Liu (2017). Computer-aided prognosis on breast cancer with hematoxylin and eosin histopathology images: A review.
Travers Ching,Daniel Himmelstein,Brett Beaulieu-Jones,Alexandr Kalinin,Brian Do,Gregory Way,Enrico Ferrero,Paul-Michael Agapow,Michael Zietz,Michael Hoffman,Wei Xie,Gail Rosen,Benjamin Lengerich,Johnny Israeli,Jack Lanchantin,Stephen Woloszynek,Anne Carpenter,Avanti Shrikumar,Jinbo Xu,Evan Cofer,Christopher Lavender,Srinivas Turaga,Amr Alexandari,Zhiyong Lu,David Harris,Dave Decaprio,Yanjun Qi,Anshul Kundaje,Yifan Peng,Laura Wiley,Marwin Segler,Simina Boca,S Swamidass,Austin Huang,Anthony Gitter,Casey Greene (2017). Opportunities and obstacles for deep learning in biology and medicine.
Ana Dordea,Mark-Anthony Bray,Kaitlin Allen,David Logan,Fei Fei,Rajeev Malhotra,Meredith Gregory,Anne Carpenter,Emmanuel Buys (2016). An open-source computational tool to automatically quantify immunolabeled retinal ganglion cells.
Philipp Eulenberg,Niklas Köhler,Thomas Blasi,Andrew Filby,Anne Carpenter,Paul Rees,Fabian Theis,F Wolf (2017). Reconstructing cell cycle and disease progression using deep learning.
Z Han,B Wei,Y Zheng,Y Yin,K Li,S Li (2017). Breast Cancer Multi-classification from Histopathological Images with Structured Deep Learning Model.
Holger Hennig,Paul Rees,Thomas Blasi,Lee Kamentsky,Jane Hung,David Dao,Anne Carpenter,Andrew Filby (2017). An open-source solution for advanced imaging flow cytometry data analysis using machine learning.
C Hitchcock (2011). The future of telepathology for the developing world.
(2017). Estimativa 2018. Incidência do Câncer no Brasil.
Thouis Jones,Anne Carpenter,Michael Lamprecht,Jason Moffat,Serena Silver,Jennifer Grenier,Adam Castoreno,Ulrike Eggert,David Root,Polina Golland,David Sabatini (2009). Scoring diverse cellular morphologies in image-based screens with iterative feedback and machine learning.
(2009). 2. Ueber den Zusammenhang der Schrift mit der Sprache.
Michael Lamprecht,David Sabatini,Anne Carpenter (2007). CellProfiler™: Free, Versatile Software for Automated Biological Image Analysis.
D Lenz,L Gasparini,N Macedo,E Pimentel,M Fronza,V Junior,W Borges,E Cole,T Andrade,Endringerdc (2017). In vitro cell viability by CellProfiler ® software as equivalent to MTT assay.
C Loukas,S Kostopoulos,A Tanoglidi,D Glotsos,C Sfikas,D Cavouras (2013). Breast Cancer Characterization Based on Image Classification of Tissue Sections Visualized under Low Magnification.
C Lu,Romo-Buchelid,X Wang,A Janowczyk,S Ganesan,Gilmoreh,D Rimm,A Madabhushi (2018). Nuclear shape and orientation features from H&E images predict survival in early-stage estrogen receptor-positive breast cancers.
Benjamin Misselwitz,Gerhard Strittmatter,Balamurugan Periaswamy,Markus Schlumberger,Samuel Rout,Peter Horvath,Karol Kozak,Wolf-Dietrich Hardt (2010). Enhanced CellClassifier: a multi-class classification tool for microscopy images.
Laoighse Mulrane,Elton Rexhepaj,Steve Penney,John Callanan,William Gallagher (2008). Automated image analysis in histopathology: a valuable tool in medical diagnostics.
Filippo Pesapane,Marina Codari,Francesco Sardanelli (2018). Artificial intelligence in medical imaging: threat or opportunity? Radiologists again at the forefront of innovation in medicine.
David Romo‐bucheli,Andrew Janowczyk,Hannah Gilmore,Eduardo Romero,Anant Madabhushi (2017). A deep learning based strategy for identifying and associating mitotic activity with gene expression derived risk categories in estrogen receptor positive breast cancers.
S Singh,A Carpenter,A Genovesio (2014). Increasing the Content of High-Content Screening An Overview.
Christoph Sommer,Daniel Gerlich (2013). Machine learning in cell biology – teaching computers to recognize phenotypes.
Miles Wernick,Yongyi Yang,Jovan Brankov,Grigori Yourganov,Stephen Strother (2010). Machine Learning in Medical Imaging.
Jon Whitney,German Corredor,Andrew Janowczyk,Shridar Ganesan,Scott Doyle,John Tomaszewski,Michael Feldman,Hannah Gilmore,Anant Madabhushi (2018). Quantitative nuclear histomorphometry predicts oncotype DX risk categories for early stage ER+ breast cancer.
Jun Xu,Lei Xiang,Qingshan Liu,Hannah Gilmore,Jianzhong Wu,Jinghai Tang,Anant Madabhushi (2016). Stacked Sparse Autoencoder (SSAE) for Nuclei Detection on Breast Cancer Histopathology Images.
K Yu,C Zhang,G Berry,R Altman,C Ré,D Rubin,M Snyder (2016). Predicting non-small cell lung cancer prognosis by fully automated microscopic pathologyimage features.
No ethics committee approval was required for this article type.
Data Availability
Not applicable for this article.
How to Cite This Article
Dominik Lenz. 2026. \u201cHistological Grading of Breast Cancer Malignancy Using Automated Image Analysis and Subsequent Machine Learning\u201d. Global Journal of Medical Research - C: Microbiology & Pathology GJMR-C Volume 23 (GJMR Volume 23 Issue C3): .
Explore published articles in an immersive Augmented Reality environment. Our platform converts research papers into interactive 3D books, allowing readers to view and interact with content using AR and VR compatible devices.
Your published article is automatically converted into a realistic 3D book. Flip through pages and read research papers in a more engaging and interactive format.
Our website is actively being updated, and changes may occur frequently. Please clear your browser cache if needed. For feedback or error reporting, please email [email protected]
Thank you for connecting with us. We will respond to you shortly.