The study area comprises three communities of Ala, Daura in Borno State and Kyalari in Yobe State, North-eastern Nigeria which forms part of the Chad Basin. Twenty five (25) water samples were collected from major sources which comprises of nine (9) hand dug wells, ten (10) surface water and six (6) boreholes. The physical parameters analyzed revealed pH values ranging from 6.5 -8.1 and electrical conductivity varies between 67 -1050mµ/cm. The results of the chemical parameters shows that Ca2+ ranges between 3.5 to 66.5mg/l, while Mg2+ varies from 4.8 to 28.2mg/l, Na+ and K+ varies between 0.7 to 1241.0mg/l and2.0 to 112.0mg/l respectively. HCO3-ranges from 77.5mg/l to 337.0mg/l while Cl-varies from 4.0 to 160.0mg/l. The concentration of SO4-varies between 0.7mg/l to 283.0mg/l. This study confirms that they are normal for domestic, agricultural and small scale irrigation purposes. The study shows that some cation and anion are within WHO limits of 2020 permissible limit of drinking water standard except for WARODI wells which show abnormally higher values above the WHO standard.
## I. INTRODUCTION
Three communities of Ala in Marte local government and Daura in Damasack local government of Borno State and Kyalari in Yunusari local government of Yobe State located within the Nigerian sector of the Lake Chad Basin within latitudes $11^{\circ}25^{\prime}$ to $13^{\circ}30^{\prime}\mathrm{N}$ and longitudes $11^{\circ}35^{\prime}$ to $14^{\circ}00^{\prime}\mathrm{E}$ (Figure 1).
 Figure 1: Location of the Study Area (After Genik, 1993)
The study area is wholly underlain by the sedimentary rocks dominated by late Plio-pleistocene Chad Formation, consisting of interbedded clays, silts and subordinates sands of continental origin probably up to 1000 m thick (Schoeneich, 2001). Today, there is a global concern about pollution as the major causes of ill health where the state of the water is control by its migration characteristic and temperature gradients. The simplest classification of water is based on the total concentration of dissolved solids measured in milligram per liter (mg/l). Water is considered to be polluted when it is not suitable for specified purpose. Thus, the quality of water varies with use to which it is put. Domestic waste and industrial activities are the major sources of water pollution, though pollutants may also enter water through air and oil migration. Generally therefore, the nature of polluted water will depend very much on the area in which it is located (Eduvie, 1991). The effects of pollution in water include color change, alteration of pH, alteration of amount of free solids, the level of biochemical and chemical oxygen demands. The above changes have critical effects on life processes (Sani, 2016).
According to (WHO, 2020) water once polluted, becomes poisonous to aquatic plants and animals and the successive ecosystem either directly or as a results of the food chainthe ingest the pollutants and gradually accumulate same in their bodies to the point of being toxic and in extreme cases may causes death. Extensive research conducted in various parts of the world such as Hem (1985), Okagbue (1988) and Todd (1980) have documented a large body of inorganic elements which so far are considered essential in human nutrition and play vital roles as structural and functional components of metalloproteinase and enzymes in cellular processes. This paper attempts to look into the major elemental concentration of the various water sources in three communities located within the Nigerian sector of Chad Basin with the aim of assessing their chemistry and suitability for domestic, animal and small scale irrigation purposes.
## II. TOPOGRAPHY AND DRAINAGE
The study area is generally featureless characterized by flat alluvial Holocene landmass, with scanty outcrops of Pleistocene Chad Formation, which gently dips northeast towards Lake Chad. The only features which break the flat terrain are sand dunes in the north west part of the study area as well as the 260 km long and 5 - 6 metre high prominent sand ridge named "Bama Ridge," considered to be formed at the shore of Mega – Chad Lake in the early Holocene, some 10,000 years ago (Zarma et al, 2015). In essence, the Bama Ridge separates flat depositional land in the north east from slightly undulating erosional surface in the south west. As observed from this study, Bama Ridge may have tectonic predisposition. The sand dunes occupy mostly Gudumbali, Kukawa, Ngazai, and Damasck. Hummocky type of sand dunes with high topographic elevation is also found close to Geidam as observed during the field work.
The inter-dunal valleys were covered by clay beds with the sand ridge traceable to about $40~\mathrm{km}$ in west and southwest of the study area. The ridges are clearly seen around Gubio, Magumeri, Maiduguri and towards Bama it extend to Banki area within the study area. The ridge is probably an ancient Holocene shoreline of the Lake Chad which dip at an angle of $5^{\circ}$ (Zarma et al, 2015).
Flooding of these tracks by the overflow from the river creates permanent marshy lands. Although near Lake Chad, the flood plain fans out in several tributaries with scattered marshy areas and Cut-off River meanders. The Komadugu-Yobe River begins to flow in June or July and reaches its peak discharge in August and October. After the wet season, discharge from Komadugu, Yedzaram and Ngadda decreases rapidly with patch of pools of water remaining in the main stream channels. The Komadugu Goma River joins the River Goa as a tributary to River Forunduma which joined River Forunduma Gana as tributaries and finally empties its water into the Lake Chad. River Kaha and River Dorma are also part of tributaries to River Forunduma which empties its water into Lake Chad (Figure 2).
The Ngadda River cuts through the Bama Ridge at Maiduguri in a well-developed channels and flows through a system of braided channels. Further north, the river gradually loses its identity as it fingers out on a marshy plain to form deltas bars which joint the Jere bowl. Upstream from Maiduguri, the Ngadda River passes through Lake Alou, a seasonal lake. The surface area of the Lake Alou is about 4 square kilometres. The Lake receives its water during wet season from delta fans spread from far southern part of the study area without a clear river or channels (Figure 2). While Amanna River, initially flowing to Lake Chad and later, after formation of Bama ridge it diverted its channel into Gongola River.
According to Schoeneich (2004), Water present in the study area consists of both atmospheric, surface and groundwater. The atmospheric water is mainly derived from rainfall which progressively falls from 800 mm/a in the southern part of the study to about 400 mm/a to the northern part of the study area. (Schoeneich, 2004) is of the view that, there is no recharge taking place if depth of annual precipitation is less than 700 mm/a (Fig. 3).
 Figure 3: Map of Annual Depth of Rainfall in Nigeria (After Schoeneich, 2004)
The groundwater in the research area is contained mainly in the Chad Formation with the greater part of the groundwater (7817km3) is salty water with only the upper most part consisting of 1713km3 being fresh water according to (Schoeneich, 2001). This fresh water occurs mainly in the Chad Formation within three geologic formations namely the Upper, Middle and Lower Aquifers (Fig. 4)
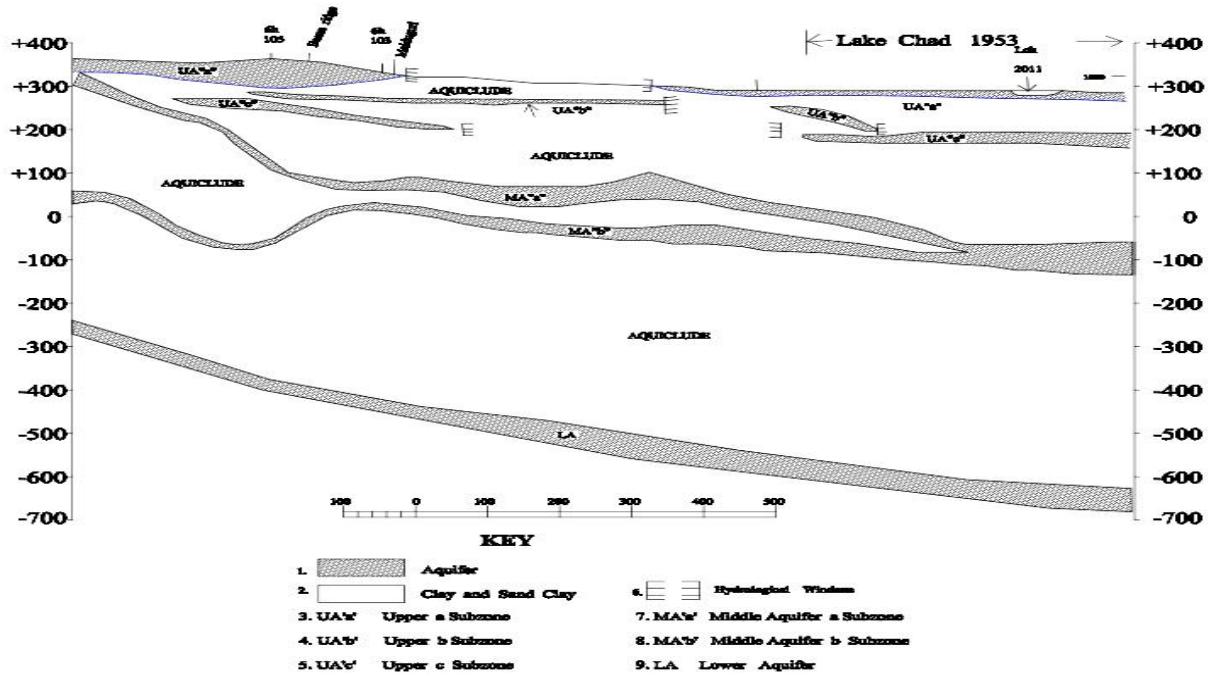 Figure 4: Map of Hydrogeological Cross-Section A-B of Chad Formation Showing the Three Aquifer, (Upper, Middle and Lower Aquifer) the Middle Aquifer is Separated into A and B Subzone (After Sani, 2016)
## III. GEOLOGICAL SETTING
According to Kogbe (1976) and Avbovbo (1986) the geological history of the area started in the Upper Albian with the deposition of mainly marine sometimes deltaic and fluviatile interbedded clays, silts and sands (Fig: 5). It is possible that after Maastrichtian, this sedimentation continued up to Paleocene leaving the continental series of sandstones interbedded with claystones and siltstones called Kerri-Kerri Formation.
There was no evidence of deposition after that until almost late Pliocene when sedimentation resumed and lasted without interruption to date. The product of this deposition is what is referred to as Chad Formation which consists of interbedded clays, silts and subordinate sands of continental origin measuring up to 1000 m in thickness (Carter et al, 1963, Kogbe, 1992 and MacDonald et al, 2005).
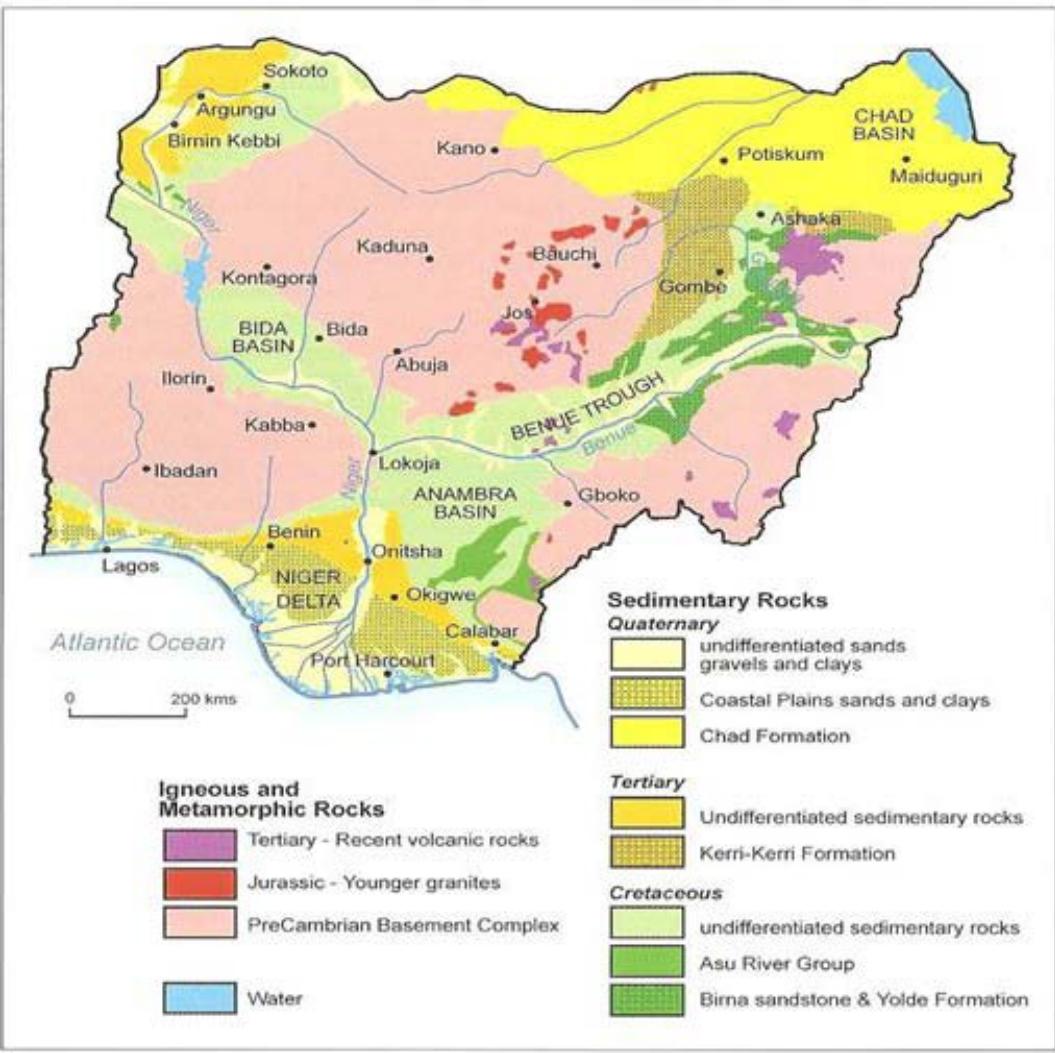 Figure 5: Generalized Geological Map of Nigeria (After MacDonald et al., 2005)
## IV. MATERIAL AND METHODS
Twenty five (25) water samples were collected which comprises of nine (9) hand dug wells, ten (10) surface water and six (6) from boreholes. These constitute the major source of water supply in the research area. The top film of the surface water and groundwater were removed, twolitres of water samples was then collected in clean dry plastic bottles filled completely and cap tight to avoid excessive agitation or exposure to sunlight. Each sample was then labelled and preserved in the refrigerator until when they are ready for chemical analysis. The position of each sample location was taken using Global Positioning System (GPS) Garmin type. Physical parameters of the samples such as electrical conductivity, temperature, total dissolve solid and hydrogen exponent were measured directly on the field at spot. The analytical method employed includes Atomic Absorption and Spectrometer which was adopted for the analysis of $\mathrm{Mg}^{2+}$ and $\mathrm{K}^{2+}$. While digital titration method were used in the determination of $\mathrm{SO}_4^-$, $\mathrm{HCO}_3^-$ and $\mathrm{Cl^-}$. The flame photometer was used in determining $\mathrm{Ca}^{2+}$ and $\mathrm{Na}^+$ respectively (Figure 6).
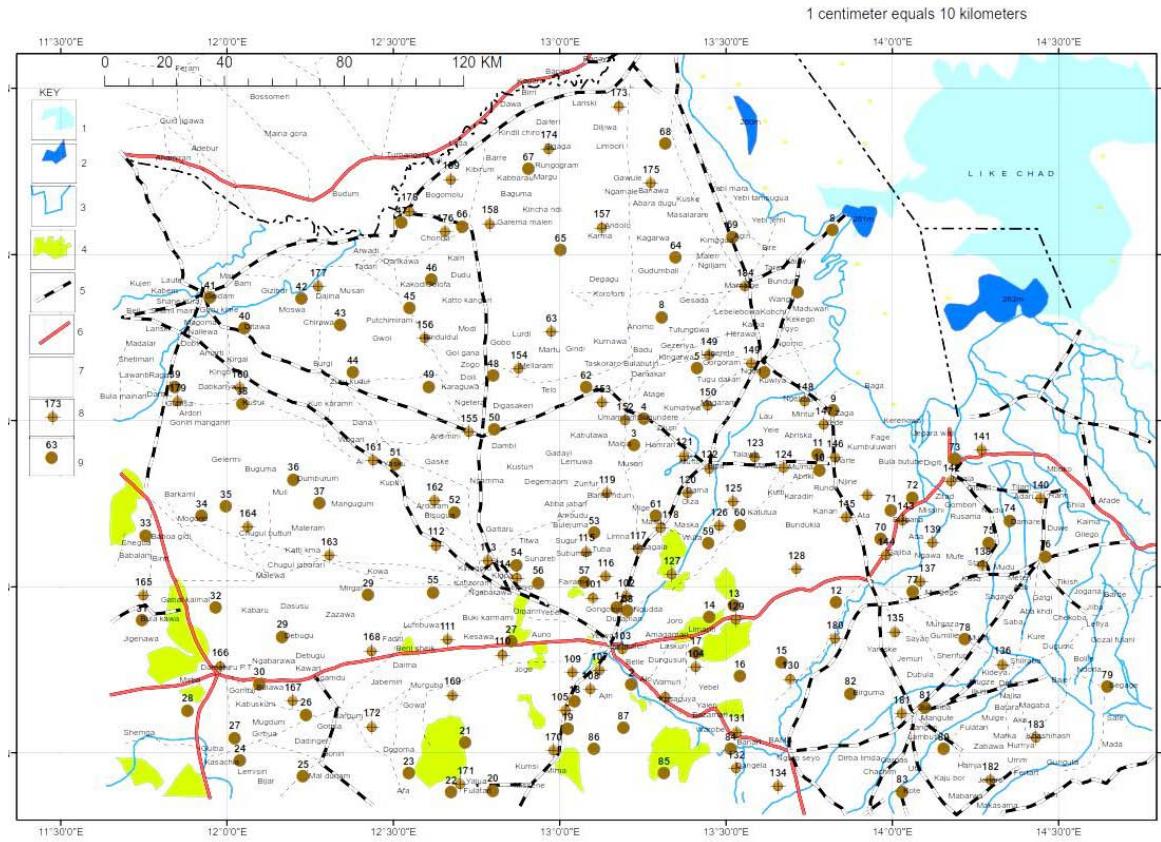 Figure 6: Distribution of the Sample Locations in the Study Area
## V. DISCUSSION
The results of the water analyzed is presented in table one and two (1 and 2) below. From the result of physical parameters measured, it can be read as follows pH ranges from 6.5 to 8.1 while electrical conductivity (EC) varies from 67 to $1050\mathrm{m}\mu/\mathrm{cm}$ respectively. The results of temperature also varies from 28 to $39^{\circ\mathrm{C}}$ with 33. $4^{\circ\mathrm{C}}$ as overall means of the temperature both in surface and groundwater but the temperature in groundwater are higher due to increase in depth (Table 1). The results of chemical parameters measured in milligram per liter shows that, $\mathrm{Ca^{2+}}$ ranges from 3.5 to 66.5 mg/l while that of $\mathrm{Mg^{2+}}$ varies between 4.8 to 28.2 mg/l. The $\mathrm{Na^{+}}$ and $\mathrm{K^{+}}$ values ranges from 0.7 to 1241.0 mg/l for $\mathrm{Na^{+}}$ and 2.0 to 112.0 mg/l for $\mathrm{K^{+}}$ respectively. The concentration of $\mathrm{HCO_3^-}$ in the water varies between 77.5 to 237.0 mg/l while that of $\mathrm{Cl^-}$ ranges from 4.0 to 160.0 mg/l. The value of $\mathrm{SO_4^-}$ in the water varies from 0.7 to 283.0 mg/l. The mean concentration of the cations show that $\mathrm{Na^{2+} > Ca^{2+} > K^+ > Mg^{2+}}$ respectively.
From the results, studies reveal that, sodium has the highest concentration in the water as observed from Warodi well 24 and well 25 with the concentration of 814.0 and $1241.0\mathrm{mg / l}$ this high concentration may reflect the geochemical interaction of transported materials with those occurring in the area while calcium concentration may be attributed to its abundance in the earth crust or are released as weathered products of feldspers, amphiboles and pyroxenes. Magnesium may have been sourced from amphiboles, pyroxenes, or olivines from the basement rocks or from clay minerals derived from such rocks (Elueze et al, 2001).
The source of HCO3- which has a mean concentration of $129.7\mathrm{mg / l}$ (Table 1 and 2) can be attributed to CO2 charge waters (Tijjani, 1994) while the warm temperature of groundwater observed in boreholes and hand pumps up to $39^{\circ}C$ is attributed to the fact that the groundwater in such areas occurs within the middle confined aquifers of the Chad Basin and temperature increases with depth (Barber and Jones, 1965). The chloride concentration in the water with average of $54.2\mathrm{mg / l}$ suggests that the chemical characteristics of the water are influenced by recharge from meteoric water as observed from hand pumps due to its shallow depth and mostly phreatic aquifer or the weathering and release of ions from the underlying basement rocks (Olayinka et al, 1999 and Sani, 2006). The high values of physical parameters such as EC, pH and temperature in the groundwater as compared to surface water may be due to incorporation of dissolved components of overburden and anthropogenic influences arising from contamination.
Table1: Physico-Chemical Mean Data of Surface and Groundwater Compared with WHO, 2020 Standard
<table><tr><td>Measured parameters</td><td>Ranges</td><td>Groundwater</td><td>Surface water</td><td>Overall mean</td><td>Acceptable level</td><td>Excessive level</td></tr><tr><td>Temperature</td><td>28 -39</td><td>34.2</td><td>32.2</td><td>33.4</td><td>-</td><td>-</td></tr><tr><td>pH</td><td>6.5 – 8.1</td><td>7.18</td><td>7.89</td><td>7.46</td><td>6.5</td><td>6.5 – 8.5</td></tr><tr><td>EC</td><td>74 - 1050</td><td>548.53</td><td>235.1</td><td>423.16</td><td>-</td><td>-</td></tr><tr><td>Ca2+</td><td>3.5 – 66.5</td><td>37.57</td><td>11.84</td><td>27.28</td><td>75</td><td>200</td></tr><tr><td>Mg2+</td><td>4.8 – 28.2</td><td>13.6</td><td>9.21</td><td>11.84</td><td>125</td><td>150</td></tr><tr><td>Na+</td><td>0.7-1241.0</td><td>178.51</td><td>13.50</td><td>112.50</td><td>120</td><td>-</td></tr><tr><td>K+</td><td>2.0 -112.0</td><td>31.01</td><td>10.11</td><td>22.65</td><td>200</td><td>-</td></tr><tr><td>HCO3-</td><td>77.5-237.0</td><td>136.77</td><td>119.20</td><td>129.74</td><td>200</td><td>-</td></tr><tr><td>Cl-</td><td>4.0-160.0</td><td>67.73</td><td>33.80</td><td>54.16</td><td>250</td><td>600</td></tr><tr><td>SO4-</td><td>0.7-283.0</td><td>90.09</td><td>25.01</td><td>64.06</td><td>200</td><td>400</td></tr></table>
Table 2: Physical and Chemical Characteristic of Surface and Groundwater in Parts of Chad Basin Nigeria
<table><tr><td>Sample No</td><td>Source of water</td><td>pH</td><td>Temperature (o°)</td><td>Electrical conductivity (mμ/cm)</td><td>Ca2+</td><td>Mg2+</td><td>Na+</td><td>K+</td><td>HCO3-</td><td>Cl-</td><td>SO42-</td></tr><tr><td>DAURA 1*</td><td>Groundwater</td><td>8.0</td><td>33</td><td>381</td><td>22.4</td><td>10.6</td><td>13.6</td><td>6.0</td><td>105.0</td><td>6.0</td><td>46.8</td></tr><tr><td>MELERI 4*</td><td>,,</td><td>7.3</td><td>33</td><td>252</td><td>53.0</td><td>9.6</td><td>66.0</td><td>9.0</td><td>187.0</td><td>34.0</td><td>85.6</td></tr><tr><td>KANARAM 5*</td><td>,,</td><td>7.4</td><td>32</td><td>306</td><td>25.6</td><td>14.0</td><td>25.6</td><td>4.0</td><td>144.5</td><td>16.0</td><td>56.9</td></tr><tr><td>BULABULIN7*</td><td>,,</td><td>7.5</td><td>33</td><td>241</td><td>9.2</td><td>17.0</td><td>9.5</td><td>4.6</td><td>90.5</td><td>28.0</td><td>9.0</td></tr><tr><td>NJOLLOM 8*</td><td>,,</td><td>7.4</td><td>32</td><td>400</td><td>26.2</td><td>7.3</td><td>68.5</td><td>10.5</td><td>143.5</td><td>24.0</td><td>15.7</td></tr><tr><td>BAGADA 9*</td><td>,,</td><td>7.5</td><td>33</td><td>254</td><td>11.4</td><td>12.5</td><td>6.0</td><td>8.5</td><td>95.0</td><td>18.0</td><td>2.6</td></tr><tr><td>ALI BANYE 10**</td><td>,,</td><td>6.5</td><td>39</td><td>1050</td><td>49.0</td><td>6.0</td><td>75.0</td><td>13.6</td><td>98.0</td><td>160.0</td><td>96.0</td></tr><tr><td>MARTE 12**</td><td>,,</td><td>6.5</td><td>39</td><td>984</td><td>57.0</td><td>17.0</td><td>71.4</td><td>10.0</td><td>179.0</td><td>130.0</td><td>76.0</td></tr><tr><td>ALI MARTE 14**</td><td>,,</td><td>6.8</td><td>35</td><td>1012</td><td>63.0</td><td>13.5</td><td>102.4</td><td>12.7</td><td>191.0</td><td>120.0</td><td>100</td></tr><tr><td>KANZOMO 15**</td><td>,,</td><td>6.7</td><td>36</td><td>1002</td><td>33.6</td><td>12.3</td><td>75.4</td><td>13.6</td><td>133.5</td><td>94.0</td><td>68.3</td></tr><tr><td>MUSSENE 16**</td><td>,,</td><td>6.7</td><td>37</td><td>906</td><td>66.5</td><td>11.0</td><td>74.3</td><td>12.0</td><td>237.0</td><td>80.0</td><td>97.5</td></tr><tr><td>KALARI 21***</td><td>,,</td><td>7.7</td><td>34</td><td>138</td><td>8.4</td><td>16.7</td><td>8.0</td><td>2.0</td><td>122.5</td><td>12.0</td><td>0.7</td></tr><tr><td>KALARI FULANI 22*</td><td>,,</td><td>7.3</td><td>33</td><td>502</td><td>33.4</td><td>4.8</td><td>27.0</td><td>30.4</td><td>78.0</td><td>30.0</td><td>188.2</td></tr><tr><td>WARODI 24*</td><td>,,</td><td>7.3</td><td>31</td><td>400</td><td>48.2</td><td>9.4</td><td>814.0</td><td>102.2</td><td>138.5</td><td>120.0</td><td>224.8</td></tr><tr><td>WARODI 25*</td><td>,,</td><td>7.1</td><td>31</td><td>400</td><td>56.7</td><td>27.5</td><td>1241.0</td><td>112.0</td><td>108.5</td><td>144.0</td><td>283.0</td></tr><tr><td>DAURA 2 ****</td><td>Surface water</td><td>8.3</td><td>36</td><td>562</td><td>26.0</td><td>25.4</td><td>25.0</td><td>37.5</td><td>220.0</td><td>96.0</td><td>134.7</td></tr><tr><td>DAURA 3 ****</td><td>,,</td><td>7.3</td><td>32</td><td>74</td><td>3.5</td><td>28.2</td><td>3.6</td><td>3.8</td><td>87.0</td><td>56.0</td><td>6.0</td></tr><tr><td>KANARAM 6 ****</td><td>,,</td><td>8.3</td><td>36</td><td>127</td><td>27.0</td><td>8.4</td><td>72.2</td><td>11.0</td><td>216.0</td><td>44.0</td><td>12.6</td></tr><tr><td>MARTE 11 ****</td><td>,,</td><td>8.1</td><td>28</td><td>215</td><td>4.5</td><td>11.0</td><td>18.1</td><td>13.0</td><td>98.0</td><td>44.0</td><td>8.5</td></tr><tr><td>NEW MARTE 13 ****</td><td>,,</td><td>7.9</td><td>29</td><td>795</td><td>11.8</td><td>5.7</td><td>12.4</td><td>2.7</td><td>87.0</td><td>18.0</td><td>9.4</td></tr><tr><td>NEW MARTE 17 ****</td><td>,,</td><td>8.0</td><td>33</td><td>268</td><td>23.7</td><td>10.0</td><td>12.4</td><td>14.0</td><td>111.0</td><td>56.0</td><td>34.6</td></tr><tr><td>KALARI 18 ****</td><td>,,</td><td>8.1</td><td>32</td><td>67</td><td>4.5</td><td>7.5</td><td>2.5</td><td>2.7</td><td>77.5</td><td>4.0</td><td>17.2</td></tr><tr><td>KALARI 19 ****</td><td>,,</td><td>7.6</td><td>31</td><td>81</td><td>5.6</td><td>5.0</td><td>6.8</td><td>4.6</td><td>112.5</td><td>4.0</td><td>7.0</td></tr><tr><td>KALARI 20 ****</td><td>,,</td><td>7.7</td><td>32</td><td>81</td><td>5.8</td><td>5.5</td><td>5.0</td><td>6.8</td><td>87.0</td><td>4.0</td><td>11.0</td></tr><tr><td>KALARI 21 ****</td><td>,,</td><td>7.6</td><td>33</td><td>81</td><td>6.0</td><td>5.8</td><td>2.0</td><td>5.0</td><td>96.0</td><td>12.0</td><td>9.1</td></tr></table>
## VI. WATER TYPES
Water can be classified chemically base on the mineralization of ionic contents (Schoeneich, 2001) states that, water can be classified chemically based on mineralization prevailing mega-ions and some trace elements or some dissolved gases. Therefore water can be classified either on Piper trilinear diagram, Wilcox diagram, Schoeller plot or other parameters.
Piper diagram was produced based on the values of the major elements analyzed from the water samples. A plot of cations and anions were done on triangle and was projected in a diamond shape representing both anions and cations, from the plot; water type is classified base on water sampled collected from surface water, impounded surface water pond, flowing River and groundwater tapping Upper aquifer through hand dug wells and boreholes tapping Middle aquifer.
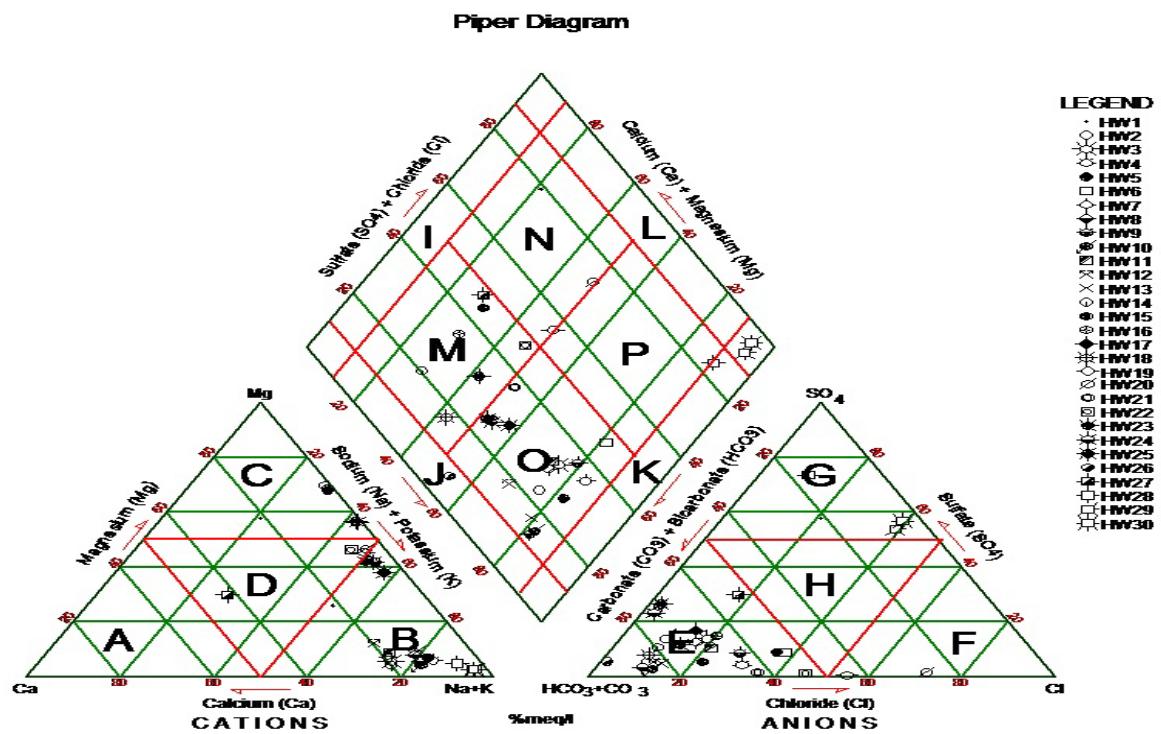 Figure 7a: Piper Trillinear Plot Diagram Representing the Analyses of Water Types from Surface Water and Phreatic Aquifer within the Study Area
### Piper Diagram
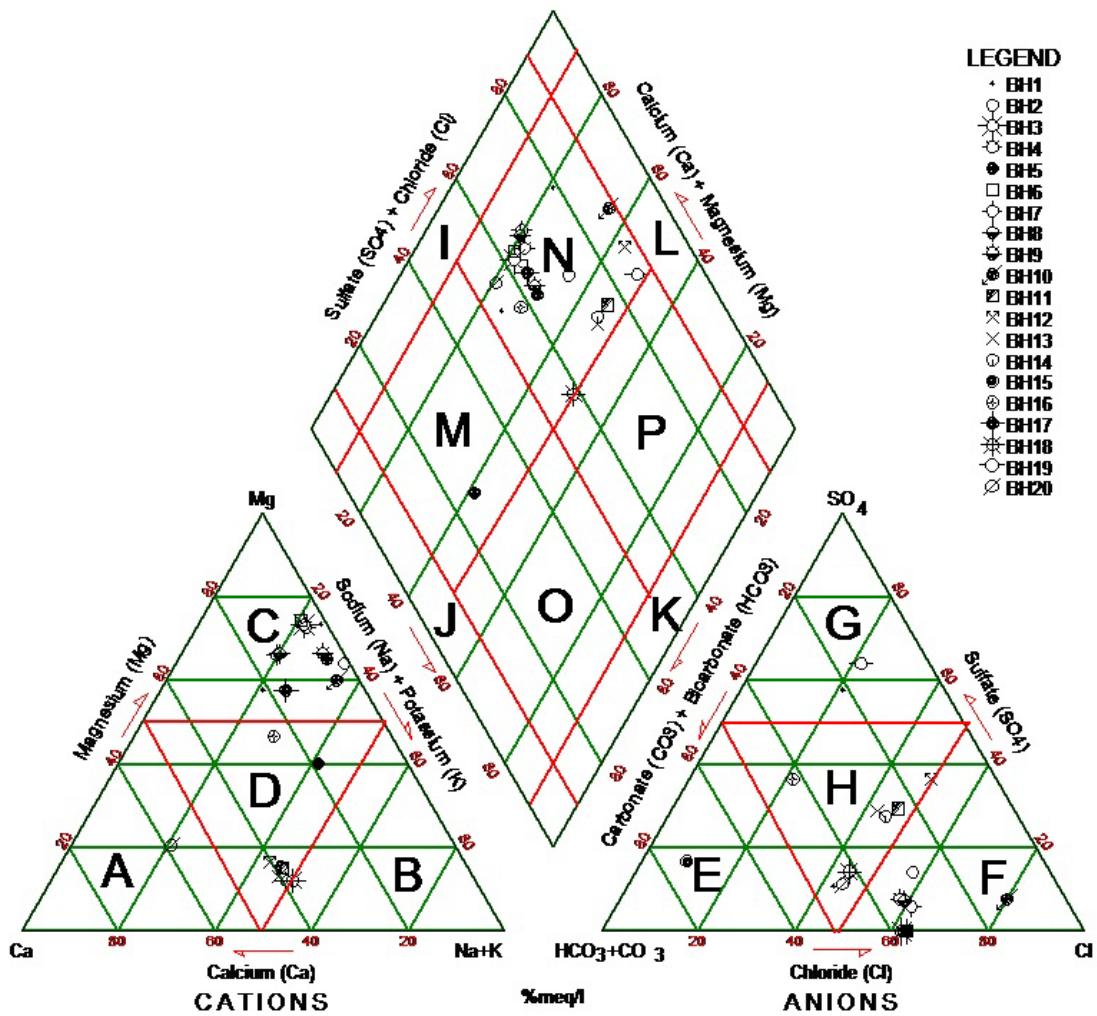 Figure 7b: Piper Trillinear Plot Diagram representing the Analyses of Water Types Tapping Middle Aquifer within the Study Area
From the two results plotted on piper trilinear diagram of the study area (Black and Hanshow, 1965). A = Calcium type; B = Sodium or Potassium type; C = Magnesium type; D = No dominant type; E = Bicarbonate type; F = Chloride type; G = Sulphate type; H = No dominant type; I = Ca+Mg type; J = HCO3 + CO3 type; K = Na + K type; L = Cl = SO4 type; M = Ca(Mg) HCO3 type; N = Ca(Mg) ClSO4 type; O = Na(K) HCO3 type and P = Na(K) Cl(SO4) type. Water around Kalari and Warodi is more of Sodium and potassium rich with Sulphate bicarbonate ions and became the dominant water type of $\mathrm{NaSO_4HCO_3}$ while the southern part of the study area is rich in $\mathrm{NaHCO_3SO_4}$ water type.
Piper plot is useful for showing multiple and trends in major ions. It divides water into types according to their placement near the four corners of the diamond triangle. Water that plots at the top of the diamond is higher in $\mathrm{Ca^{2+}} + \mathrm{Mg^{2+}}$ and $\mathrm{HCO_3^-}$ and is the region of waters with temporary hardness. Water plotted at the lower corner of the diamond is composed primarily of $\mathrm{Na}^{+} + \mathrm{K}^{+}$ and $\mathrm{HCO}_{3}^{-}$. It represents the combination of major and minor constituents of groundwater in the study area. According to the diagram, sodium and potassium is the dominant and calcium is the least in hand dug wells tapping Upper aquifer while in boreholes tapping Middle aquifer, calcium is the dominant element and the potassium is least.
According to Furtak and Langguth (1967) it can be deduce based on percentage with $53\%$ of the water in the area belong to earth alkaline type with higher alkaline proportion while $41\%$ belong to or fall within acidic water type with only $5\%$ being normal for domestic consumption.
This work is further plotted on Schoeller plot, is a semi-logarithmic plot to represent major ion analyses in milliequivalents per liter and to demonstrate different hydrochemical water types on the same plot. Schoeller diagram represents the combination of major and minor constituents of groundwater and surface water in the study area. According to the diagram, sodium is the dominant and calcium is the least in hand dug wells tapping Upper aquifer while in boreholes tapping Middle
and Lower aquifer, magnesium is the dominant element and the chloride is least in the plot as presented below in Figure 8a and 8b.
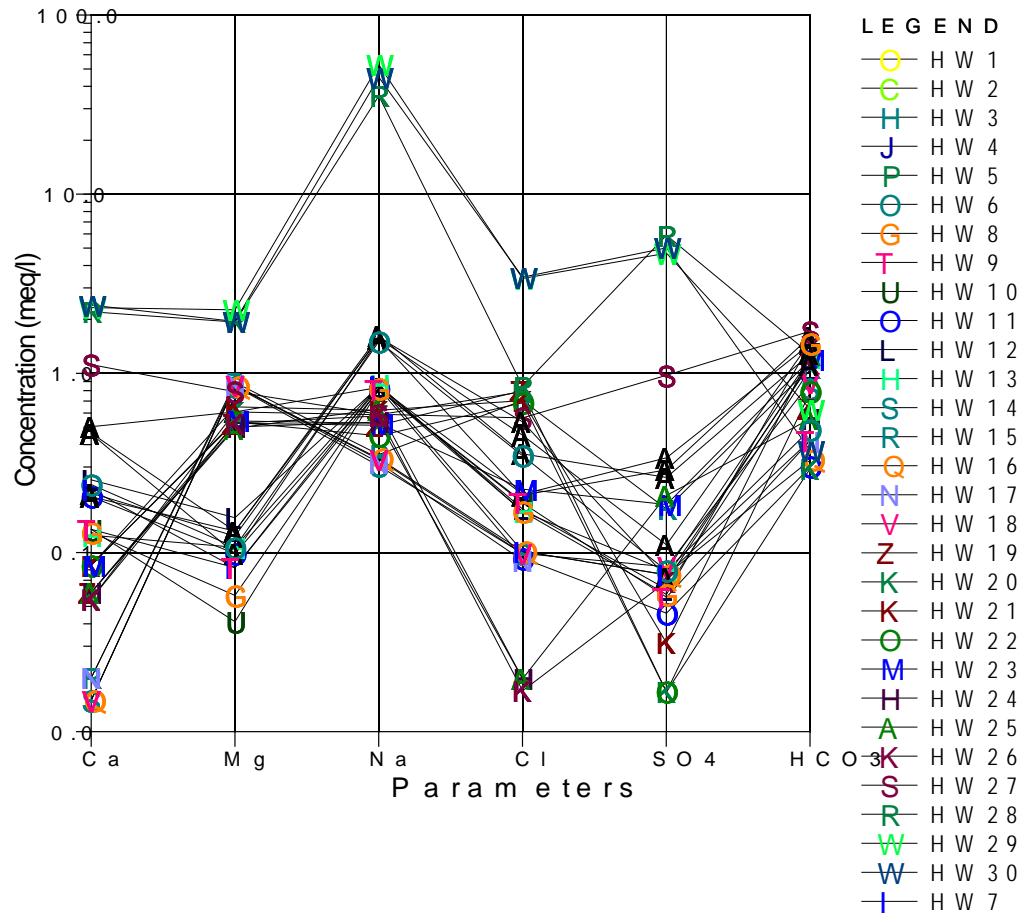 Schoeller Plot Figure 8a: Results of water quality Plotted on Schoeller Diagram Tapping Upper Aquifer in Hand Dug Wells
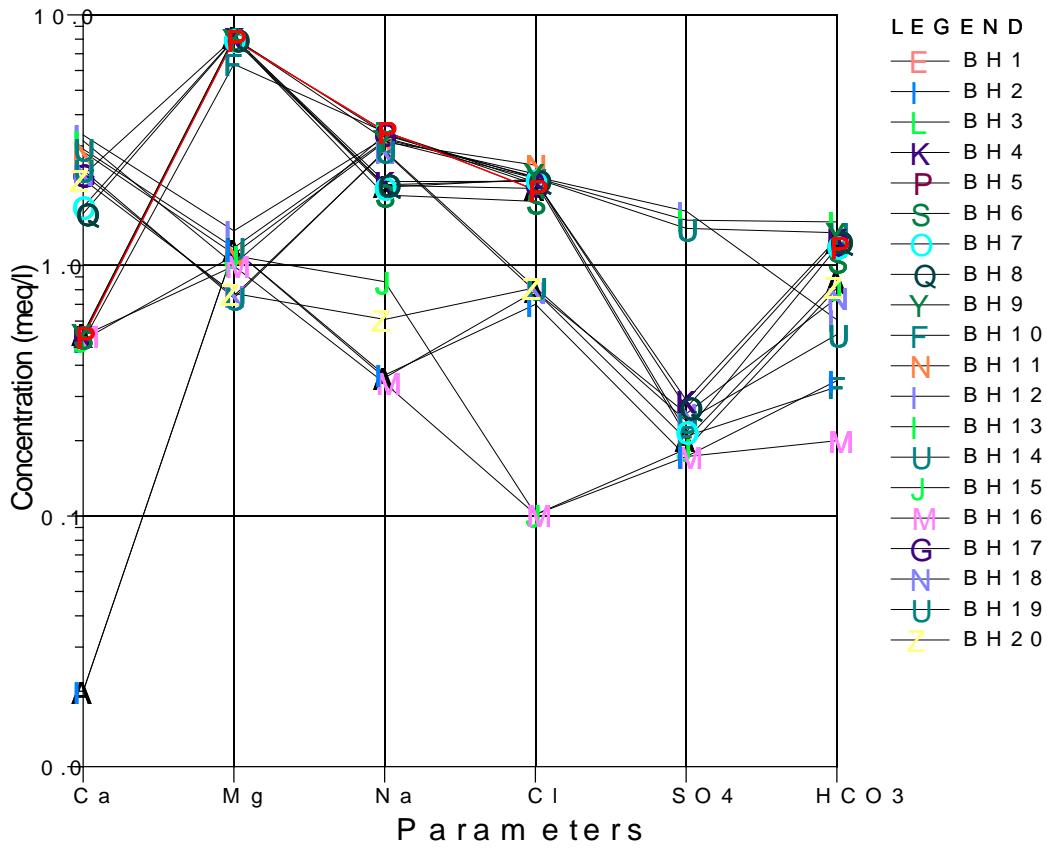 Schoeller Plot Figure 8b: Results of Water Quality Plotted on Schoeller Diagram Tapping Middle and Lower Aquifer in Boreholes
a) Suitability of water for drinking, domestic use and agriculture based on its major ions
The first thing to think about the Basin is that, is there enough water to drink both for domestic uses and livestock rearing before talking of small scale irrigation. This is the question to answer before talking about its suitability of the water in the research area. In fact there is no enough water for consumption. The only available water in the study area is little water from A and B subzones in Upper aquifer bed with sodium, magnesium and sulphate are higher above the WHO, 2021 limit as detected from analyses of water samples.
Wilcox plot enable water to be classified base on the conductivity of the water analysed in the study area. From the Wilcox plot it can be read that, one of the sample is excellent for irrigation with low sodium hazard with conductivity $< 250 \mu \mathrm{S/cm}$ while ten of the samples are good for irrigation with conductivity between $< 250 - 750 \mu \mathrm{S/cm}$ and five of the sample are moderately good for irrigation with conductivity between 750 - 2250 $\mu \mathrm{S/cm}$ in the Upper aquifer tapping through hand dug wells. In the borehole tapping Middle and Lower aquifer, five of the samples is excellent for irrigation with low sodium hazard with conductivity $< 250 \mu \mathrm{S/cm}$ while twenty of the samples are good for irrigation with conductivity between $< 250 - 750 \mu \mathrm{S/cm}$, This means that the water in deeper Chad Formation is more conductive than those in the phretic zone as a result of higher total dissolve solid (Figure 9a and 9b).
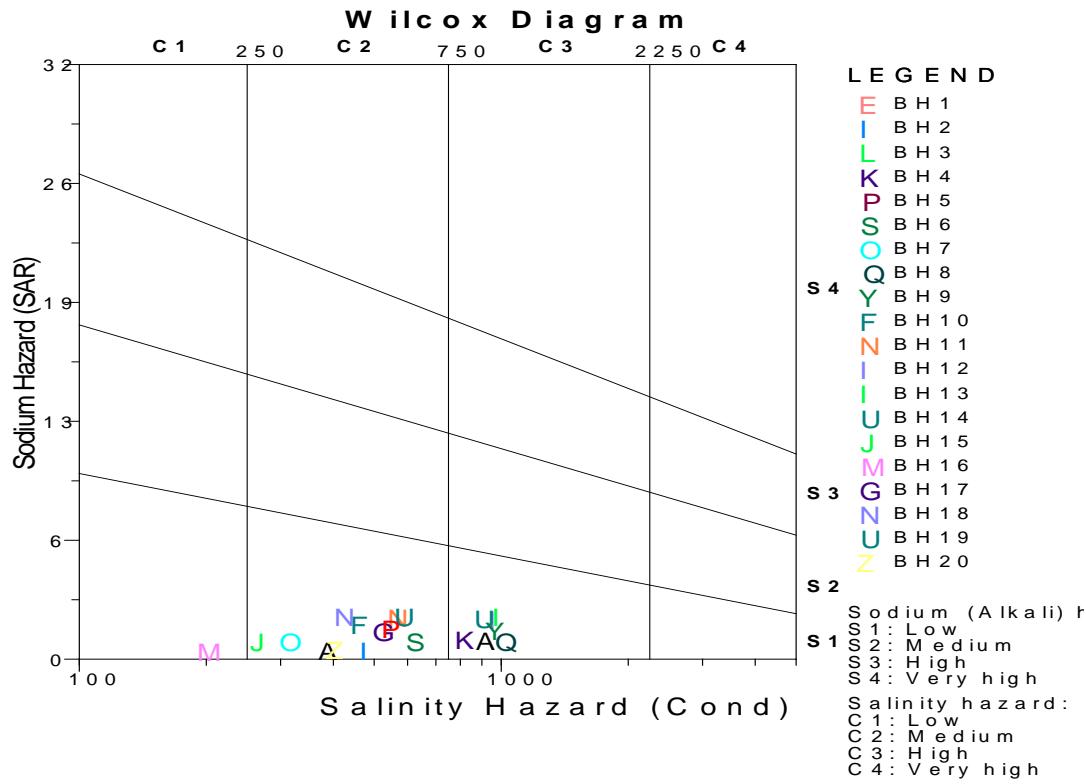 Figure 9a: Wilcox Plot of Hand Dug Wells Tapping Upper Aquifer in Chad Formation
 Figure 9b: Wilcox Plot of Boreholes Tapping Middle and Lower Aquifer
## VII. CONCLUSION
Results of hydrochemical studies of both surface and groundwater in parts of the Chad basin shows that the water is acidic and alkaline. The study further reveals that the Warodi wells 24 and 25 is highly enriched in sodium and other anions which are above the permissible limits (WHO, 2020) which may cause laxative effect such as gastrointestinal pains thereby leading to death in most cases. This has been confirmed in this study as animals that drank the water from this wells died instantly according to the villagers and so all the wells were abandoned. Further research may be required for the confirmation of this to ascertain the result of higher pollution of the wells in the area. It may be also recommended that, other water sources be developed to supplement the existing ones and also the need to advance this research to microbial, heavy metals and isotopic studies is necessary to ascertain the reason for higher major elements in the wells.
Generating HTML Viewer...
Funding
No external funding was declared for this work.
Conflict of Interest
The authors declare no conflict of interest.
Ethical Approval
No ethics committee approval was required for this article type.
Data Availability
Not applicable for this article.
How to Cite This Article
S. Adamu. 2026. \u201cHydrochemical Assessment of Surface and Groundwater in Some Selected Communities of Borno and Yobe State\u201d. Global Journal of Science Frontier Research - H: Environment & Environmental geology GJSFR-H Volume 23 (GJSFR Volume 23 Issue H1): .
Explore published articles in an immersive Augmented Reality environment. Our platform converts research papers into interactive 3D books, allowing readers to view and interact with content using AR and VR compatible devices.
Your published article is automatically converted into a realistic 3D book. Flip through pages and read research papers in a more engaging and interactive format.
The study area comprises three communities of Ala, Daura in Borno State and Kyalari in Yobe State, North-eastern Nigeria which forms part of the Chad Basin. Twenty five (25) water samples were collected from major sources which comprises of nine (9) hand dug wells, ten (10) surface water and six (6) boreholes. The physical parameters analyzed revealed pH values ranging from 6.5 -8.1 and electrical conductivity varies between 67 -1050mµ/cm. The results of the chemical parameters shows that Ca2+ ranges between 3.5 to 66.5mg/l, while Mg2+ varies from 4.8 to 28.2mg/l, Na+ and K+ varies between 0.7 to 1241.0mg/l and2.0 to 112.0mg/l respectively. HCO3-ranges from 77.5mg/l to 337.0mg/l while Cl-varies from 4.0 to 160.0mg/l. The concentration of SO4-varies between 0.7mg/l to 283.0mg/l. This study confirms that they are normal for domestic, agricultural and small scale irrigation purposes. The study shows that some cation and anion are within WHO limits of 2020 permissible limit of drinking water standard except for WARODI wells which show abnormally higher values above the WHO standard.
Our website is actively being updated, and changes may occur frequently. Please clear your browser cache if needed. For feedback or error reporting, please email [email protected]
Thank you for connecting with us. We will respond to you shortly.