This study aimed to assess the position of the condyle in the condylar fossa using cone beam computed tomography in patients with tooth loss and malocclusion. A sample of 47 patients of both genders from the Unichristus Dentistry service was selected and divided into six groups. The division was as follows: 1. Angle Class I patients; 2. Angle Class II patients; 3. Angle Class III patients; 4. edentulous patients in both arches; 5. edentulous upper and partially edentulous lower patients; 6. patients with multiple losses. All the patients underwent closedmouth cone-beam computed tomography, with exposure values of 85kVp, 6.3ma, and 20s of exposure. The images were analyzed in sagittal and axial sections on both sides. Data was expressed as mean and standard deviation, and the Kolmogorov-Smirnov normality test was used to compare the right and left sides or ANOVA/ Bonferroni for independent or repeated measures.
## I. INTRODUCTION
The temporomandibular joint (TMJ) is one of[^2] the most complex joints in the human body. It comprises bone and soft tissue structures located between the mandible and the temporal bone (1).
The balanced functioning of the TMJ is of great importance in maintaining the harmony of the masticatory system. The asymmetrical position and morphological changes of the temporomandibular joint structures can be influenced by various factors, such as missing teeth, abrasion, premature contacts, paraphunction, unilateral crossbite, and dental-skeletal asymmetries (2).
The condyle is the primary growth center of the mandible and responds to functional stimuli and mechanical stresses exerted on the TMJ region from childhood to adulthood, continuously undergoing bone remodeling processes that affect its volume and shape (3). Factors such as gender, age, facial growth pattern, occlusal force, and pathological and functional changes can affect the morphology of the TMJ and, as a result, there is a reconfiguration of the joint surfaces (4).
In the literature, it has been hypothesized that the condyle and fossa may differ in shape and their interrelations between people with various malocclusions and dentofacial morphologies. Several conventional tomography studies have been conducted to find the relationship between skeletal malocclusions - Class II and Class III - and some characteristics of the temporomandibular joint (TMJ), but the results have not been homogeneous. It is also unclear what the position of the condyle is within the fossa in the other types of malocclusions, whether there is a difference between them, and, if so, whether they are a cause or a result of the occlusion, given that the structures of the TMJ do not grow homogeneously (5).
The interpretation of the condyle-fossa relationship in images is challenging. Two-dimensional (2D) radiographs have limitations inherent to the technique, primarily when used to assess the joint (6). This is because the TMJ is a small joint with complex morphology, surrounded by bony structures that produce overlapping images (7). Cone beam computed tomography is the modality of choice for evaluating the bone morphology of the TMJ, as it produces three-dimensional (3D) images with high resolution and without magnification or distortion, enabling precise and accurate measurements of the structures. (8). In addition, compared to conventional CT scans, it has a shorter scanning time and radiation dosages that are up to 15 times lower (3).
This study aims to evaluate the position of the condyle in the condylar fossa using cone beam computed tomography in different clinical dental situations.
## II. MATERIALS AND METHODS
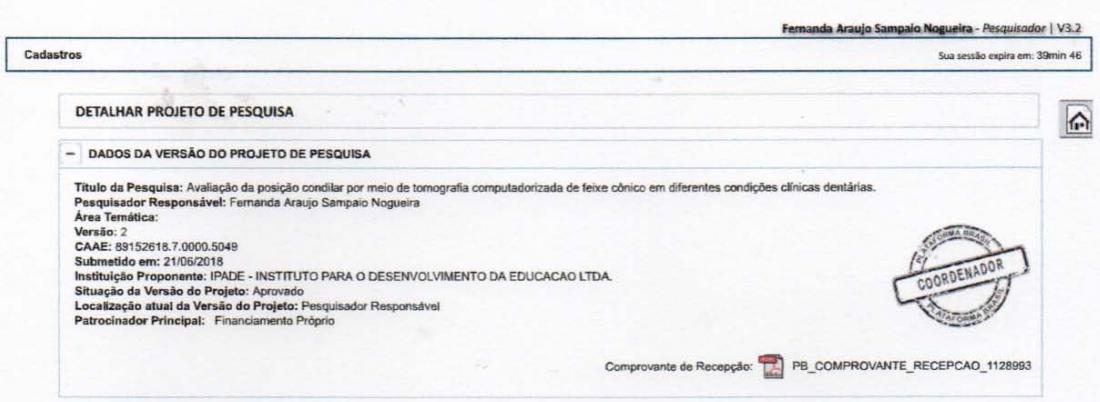
This is an observational, in vivo, cross-sectional study. This study was approved by the Human Research Ethics Committee of the Christus University Center (UNICHRISTUS) under protocol number 89152618.7.0000.5049.
### a) Study Design
Patients seen at the Christus University Center dental service were included in this study. Pregnant women, minors, those with apparent facial asymmetry, edentulous patients with implants for prosthetic fixation, and those with any syndrome involving the craniofacial bones were excluded from the sample. A total of 47 patients made up a convenience sample, aged between 18 and 70, divided into six groups:
Group A: Angle Class I patients;
Group B: Angle Class II patients;
Group C: Angle Class III patients;
Group D: Edentulous bimaxillary patients;
Group E: Edentulous upper and partially edentulous lower patients (Kennedy Class I)
Group F: Patients with multiple losses.
All the individuals participating in the study were informed of the possible risks involved, signed the Free and Informed Consent Form (ANNEX II), and kept a copy of it.
After selection, the patients underwent an intraoral clinical examination with a wooden toothpick and were divided into the study groups according to their dental classification. Any TMD symptoms were not a criterion for excluding patients from the sample. Finally, they underwent CBCT scans of the bilateral TMJ region with the mouth closed in a relaxed position.
### b) Cone Beam Computed Tomography (Cbct)
The position of the patient's head was standardized so that the Frankfurt plane was parallel to the ground, and the median sagittal plane was perpendicular to the ground. The device used for all the CT scans was the Eagle 3D (Dabi Atlante S/A Industrias Médico Odontológicas, Ribeirão Preto, SP, Brazil) belonging to the Unichristus Imaging Clinic. All patient safety measures, such as wearing a lead apron and using the lowest radiation dose, were complied with. The exposure values established were $85\mathrm{kVp}$, 6.3ma, 20s exposure. The images were transformed into
DICOM (Digital Imaging and Communications in Medicine), reconstructed three-dimensionally, and interpreted in the Blue Sky Plan 4 program (Blue Sky Bio, Libertyville, IL, USA), where analysis and measurements were carried out on the sagittal and axial sections.
The condylar position of all the patients in the sample was analyzed by a single evaluator who was a radiologist and experienced with tomographic images. This same evaluator selected all the patients in the sample in the study's first phase. A maximum of 10 images a day were interpreted to avoid visual fatigue and interference with the results. The images were viewed and evaluated in a room with reduced lighting to increase accuracy.
The analysis methodology used in this work was previously described by VITRAL et al. (9).
The right and left sides were analyzed separately. The sagittal measurements (MS) evaluated were (FIGURE 1):
1. Depth of the articular fossa: measured from the uppermost point to the horizontal plane with the lowermost point of the external acoustic meatus.
2. Anterior articular space: determined by the shortest distance between the condyle's most anterior point and the articular tubercle's posterior wall.
3. Superior articular space: measured by the shortest distance between the condyle's uppermost point and the articular fossa's uppermost point.
4. Posterior articular space: determined by the shortest distance between the condyle's most posterior point and the articular fossa's posterior wall.
In the axial section, the measurements analyzed (MA) were (FIGURE 2):
1. Largest anterosuperior diameter of the condylar process of the mandible.
2. Largest mediolateral diameter of the condylar process of the mandible.
3. Angle between the long axial axis of the mandibular condyle and the median sagittal plane.
4. Distance between the geometric center of the condylar process and the median sagittal plane: measured by a line running from the geometric center of the condyle perpendicular to the median sagittal plane.
### c) Statistical Analysis
Data were expressed as means and standard deviations, subjected to the Kolmogorov-Smirnov normality test, and compared using the paired t-test to compare right and left sides or ANOVA/Bonferroni for independent measures (analysis between groups) or repeated measures (analysis between positions).
The SPSS software version 20 was used to obtain the results of the statistical tests, and the significance level adopted was $5\%$ probability $(p < 0.05)$.
## III. RESULTS
The convenience sample was established with ten patients from Group A, 03 patients from Group B, ten from Group C, 08 from Group D, 06 from Group E, and ten from Group F.
In the analysis between groups (Table 1) concerning sagittal measurement 1 (MS1), groups D and E showed a significant discrepancy between the right $(p = 0.028)$ and left $(p = 0.047)$ sides.
In sagittal measurement 2 (MS2), group D showed a significantly higher measurement than all the other groups $(p = 0.016)$ on the left side, which was not the case on the right side $(p = 0.095)$, where there was no difference between the groups.
In sagittal measurements 3 and 4 (MS3 and MS4), there was no statistically significant difference when comparing the right and left sides of the patients nor between the groups $(p > 0.05)$.
Concerning axial measurements, in axial measurement 1 (MA1), on the right side, group C had the highest measurements compared to the other groups $(p = 0.043)$, while on the left side, the same did not occur $(p = 0.133)$.
In axial measurements 2 and 4 (MA2 and MA4), when comparing the right and left sides of the patients, there was no statistically significant difference $(p > 0.05)$.
In axial measurement 3 (MA3), the left side was significantly superior to the other groups $(p = 0.038)$ which did not occur on the right side $(p = 0.465)$, and patients in group F also showed a significant discrepancy between the right and left sides, with a value of $p = 0.043$.
Table 2 shows that in group A, MS2 was lower than MS3 and higher than MS4, with MS2 and MS4 being equal. In other words, the condyle is slightly extruded and centralized in the fossa. With p-values on the right side $(p = 0.001)$ and on the left side $(p < 0.001)$.
In the case of patients in group B, there was no statistical difference between the positions of the mandible on the right and left sides and the average of the two, i.e., in group B, the condyle is centralized, but in a more intrusive position when compared to the patients in group A.
Group C showed the same behavior as group A, with the condyle in a slightly extruded position and centered in the fossa, and the p-values were $(p < 0.001)$ on the right side and $(p = 0.004)$ on the left side.
Patients in group D, on the right side, had MS2 equal to MS3 and both higher than MS4, with $p = 0.001$. These data show the condyle in a more posteriorized and extruded position. On the left side, the behavior of the patients was the same as group A, with the condyle in a slightly extruded position and centered in the fossa $(p = 0.002)$.
In groups E and F, the behavior was also the same as in group A, with the condyle slightly extruded and centered in the fossa. The p-values were $(p = 0.001)$ on the right side and $(p = 0.002)$ on the left side in group E, $(p = 0.001)$ on the right side, and $(p = 0.001)$ on the left side in group F.
## IV. DISCUSSION
Cone-beam computed tomography provides three-dimensional information from a series of thin slices of the structure being assessed, without overlapping images, with a higher quality of differentiation of bone tissues when compared to conventional radiography and allows for image manipulation and adjustment even after scanning. (6). For these reasons, the imaging technique was chosen for this study.
The sagittal section is more appropriate for assessing the condyle-fossa relationship, as it allows the depth of the articular fossa to be analyzed and condylar concentricity based on a comparison of the articular spaces. In this study, the depth of the mandibular fossa showed a significant difference between the right and left sides in the groups of totally and partially edentulous patients, with values of $p = 0.028$ and $p = 0.047$, respectively. The results also showed a significant difference in the anterior joint space on the left ( $p = 0.016$ ) in all the groups analyzed. Concerning the superior and posterior joint spaces, there was no significant difference between the right and left sides in the groups. This finding partially corroborates that of Rodrigues et al. (7), who found no statistically significant difference in the anterior and superior joint spaces, while the posterior joint space did. Thus, only the analysis of the superior joint space was in agreement between the two studies.
In the study by Vitral et al. (9), which analyzed Class I patients, the posterior joint space showed a significant difference when comparing the right and left sides of the patients. Rodrigues et al. (7) used the same methodology and found a significant difference in assessing posterior joint spaces on both sides in Class I patients. In the present study, no relevant differences were found about the joint spaces on both sides in the Class I group of patients. This result may infer greater symmetry in these patients.
Concerning Class II patients, the same authors (10) found a statistically significant difference in the posterior articular space but not in the superior and anterior spaces. They justified the asymmetry in the posterior articular space by the different dimensions of the mandibular fossae. Despite the different results, this same justification can explain the significant difference in the anterior joint space on the left found in this study.
Vitral et al. (11), who also used the same methodology in their study, found a more anterior condylar position bilaterally in patients with Class II division 1 malocclusion, with the left condyle in a more anterior position than the right, and attributed this finding to an asymmetry due to unilateral chewing. Rodrigues et al. (10) results concerning Class II division 1 patients were also non-concentric on both sides, with condyles positioned more anteriorly in the mandibular fossa.
As for Angle Class III patients, the results of the study by Rodrigues et al. (10) showed no significant difference between the two sides in the anterior, superior, and posterior joint spaces. Katsavrias and Halazonetis (12), in their study comparing Class II and Class III malocclusion, concluded that the condyle had an intermediate anteroposterior position in the mandibular fossa in Class III patients.
Comparing the joint spaces on the two sides in the sagittal section does not provide enough information to conclude that one condyle is positioned anteriorly or posteriorly. For this, an association must be made with images in the axial section. If no asymmetrical position is found in this section, it can be said that the differences in joint spaces are associated with the dimension or asymmetrical positioning of the mandibular fossa (10).
The axial section is more suitable for assessing symmetry between the condyles in the anteroposterior and mediolateral aspects, as it shows the two condyles in the same image and allows for actual measurement of their dimensions and angulations (7). Evaluating Class II division 1 patients, these authors found no statistically significant differences between the right and left sides concerning the anteroposterior and mediolateral dimensions of the condyle evaluated in this study. In a study evaluating Class I patients, Rodrigues et al. (7) also found no statistically significant differences between the right and left sides of the condylar processes. Vitral and Telles (13) found similar results when assessing Class II patients using a similar methodology. However, in the present study, the right side of all the groups showed a statistically significant difference, with the Class III patients showing the highest measurements.
The functional stimuli and mechanical stress exerted on the TMJ differ in individuals according to skeletal discrepancies. Paknahad and Shahidi (8) found an association between condylar position and craniofacial morphology and stated that this association may be related to functional loads in patients with various malocclusions, leading to a change in condylar position.
In a normal dentition, harmony between the function and position of the dental elements and the condyles exists. When posterior teeth are removed, the load balance between the dentition and the TMJ can be disturbed. This is because the loss of teeth results in the displacement of adjacent and opposing teeth, causing premature contact in centric and eccentric movements, compromising occlusion and condylar position, and leading to structural alterations of the TMJ surfaces and temporomandibular dysfunction. (14).
In the study by Ammanna et al. (14), patients who had lost posterior support showed a predominance of posteriorized condylar position. This reduction in posterior articular space can cause compression in the bilaminar zone, which is responsible for the blood supply and nutrition of TMJ structures and leads to disc displacement. Thus, the posterior condylar position is more unstable than the concentric and anterior positions since the latter two keep the disc more stable against the articular eminence. The authors assessed that the posterior articular space on both sides of Kennedy Class I and II patients showed a reduction, both in the resting position and at maximum habitual intercuspation, compared to Kennedy Class III and IV patients.
In this study, the measurements between the right and left sides differed statistically significantly in the groups of edentulous patients when MS1 was assessed. This may be due to the chronological loss of dental elements in an unknown order, as this data was not collected during the data collection phase.
When analyzing the anterior articular space in this study, Class III patients showed statistically significant values on the left side compared to all the other groups. In their study, Katsavrias and Halazonetis (15) stated that the condyle and mandibular fossa differ in shape according to the patient's malocclusion. Thus, the data found in this study can be explained by the different dimensions of the mandibular fossae.
Evaluating the angulation of the condyle concerning the median sagittal plane, Rodrigues et al. (7) found no significant difference between the right and left sides in Class I, Class II division 1, and Class III patients. The present study showed significant results on both sides in the patients with multiple losses group and on the left side of all groups. For the group of patients with multiple losses, it can be inferred that the angulation of the condylar process was altered due to muscular and physiological adaptations in chewing and phonation resulting from the lack of dental elements.
## V. CONCLUSION
Patients in the Angle Class I, Angle Class III, upper total edentulous, lower partial edentulous, and multiple loss groups on both sides of the mandible had the condyle centralized in the fossa and slightly extruded. The same happened with the condyle on the left side in the group of edentulous patients, while on the right side, the position observed was with the condyle posteriorized and extruded.
A clinical interpretation of the data collected shows that edentulism tends to posteriorize the condyle, which can be explained by the probable rotation of the mandible in the face of tooth loss.
Angle Class II patients had a centralized and slightly intruded condyle. However, this group had the limitation of a small sample size, so the results are not as reliable.
Financial Support
There is no financial support for this research.
Conflict of Interest
There is no conflict of interest.
### ANNEX I: Research Ethics Committee Approval

#### LEGENDA:
(*) Apreciação
PO = Projeto Original de Centro Coordinador
$$
E = Emenda de Centro Coordinador
$$
$$
N = Notificacao de Centro Coordinador
$$
PCp = Projeto Original de Centro Participante
$$
Ep = Emenda de Centro Participante
$$
$$
Np = Notificacao de Centro Participante
$$
PDc = Projeto Original de Centro Copertura
$$
Ec = Emenda de Centro Copertura
$$
$$
No = Notificacao de Centro Copapariente
$$
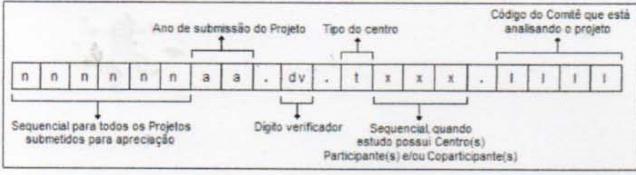
(*) Formação do CAAE
Voltar
Suporte a sistemas: 136 - opçao 8 e opçao 3, Solicitar ao attendente suporte Plataforma Brasil.
Fale conosco. Clique para enviar mensagem para a Plataforma Brasil

You are being invited to take part in the study: Evaluation of condylar position using cone beam computed tomography in different clinical dental conditions, authored by Lara Lecy Nogueira Barbosa de Sousa and supervised by Prof. Dr. Fernanda Araujo Sampaio. In this study, you will be asked to undergo a clinical dental examination to assess your dental condition. You will also be asked to undergo a Cone Beam Computed Tomography scan at the Christus University Center - UNICHRISTUS to analyze the condylar position. You will not incur any costs for the examinations or procedures carried out. The only risk you are exposed to in this research is radiation during the CT scan. However, this risk is considerably reduced with patient protection measures, such as the use of a lead apron, which will be guaranteed by the researcher in charge. The assessments will not cause you any physical, moral, or material harm. The information provided will be kept confidential, respecting your privacy. The results will be analyzed and published in scientific media without your identification.
You must be aware that participation in this study is entirely voluntary and that you can refuse to participate or leave the study at any time without penalty. Refusal to participate or withdrawal from the study will not influence your care at this institution. The researcher is responsible for reimbursing any expenses incurred by the participants in the study and for any damages arising from this study.
By this instrument, which complies with legal requirements, you, Mr.
bearer of identity card
Finally, as the researcher responsible for the research, I DECLARE compliance with the provisions of CNS Resolution No. 466 of 2012, contained in items IV.3 and IV.4, item IV.5.a, and in full with the CNS Resolution No. 466 of December 2012.
As we agree with this agreement, we sign it in two equally valid copies (one for the research participant and one for the researcher), which will be initialed on all its pages and signed at the end, following the provisions of CNS Resolution No. 466 of 2012, items IV.3.f and IV.5.d.
Fortaleza-CE,
Research Participant Lara Lecy Nogueira Barbosa de Sousa
#### ANNEX III: Initial assessment form
<table><tr><td></td><td colspan="3">Date:</td></tr><tr><td></td><td>N.</td><td>Research</td><td>Subject:</td></tr><tr><td>Name:</td><td></td><td></td><td></td></tr><tr><td>Age</td><td colspan="3">Gender: () Male () Female</td></tr><tr><td>Phone</td><td>number:</td><td></td><td></td></tr></table>
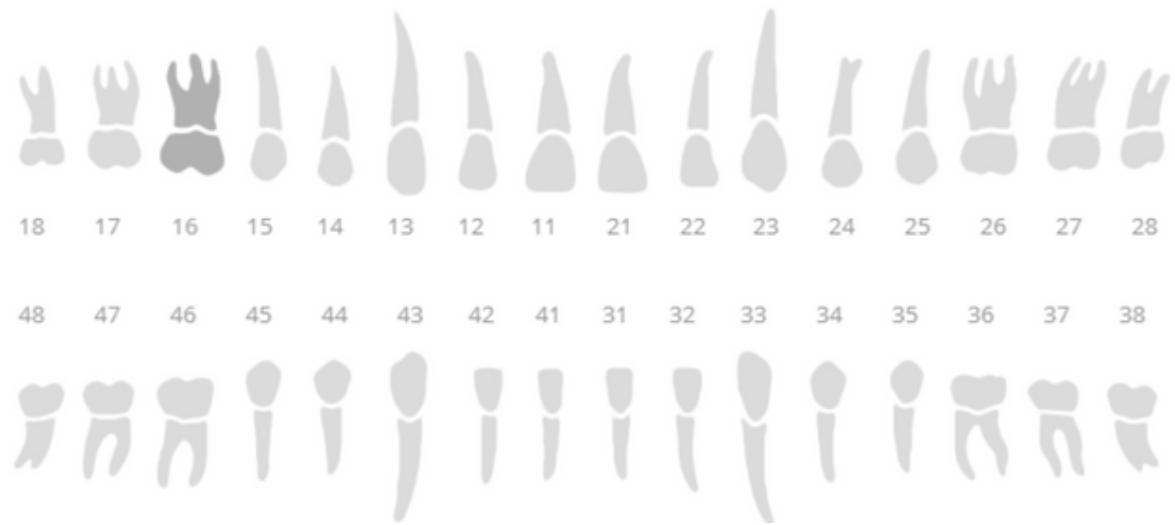
### i) Odontogram
X - Missing teeth
II) Angle Classification
Class I
OVERJET: mm
Class II Subdivision 1
OVERBITE: mm
Class II Subdivision 2
Class III
III) Research Group
Group 1: Edentulous patients in both upper and lower arches.
Group 2: Unilateral partially edentulous patients.
Group 3: Bilateral partial edentulous patients.
Group 4: Angle Class I patients.
Group 5: Angle Class II, subdivision one patients.
Group 6: Angle Class II, subdivision two patients.
Group 7: Angle Class III patients.
IV) Tomography Evaluation
#### 1. SAGITTAL PLANE
#### RIGHT
- 1:
- 2:
- 3:
- 4:
#### LEFT
- 1:
- 2:
- 3:
- 4:
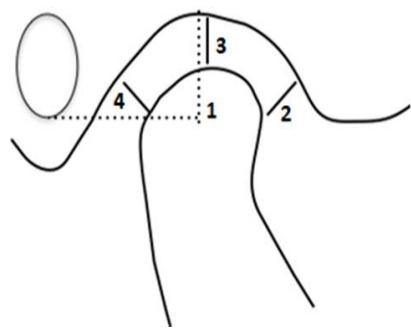 Figure 1: Illustration of the measurements in the sagittal section
#### 2. AXIAL PLANE
## RIGHT
- 1:
- 2:
- 3:
- 4:
### LEFT
- 1:
- 2:
- 3:
- 4:
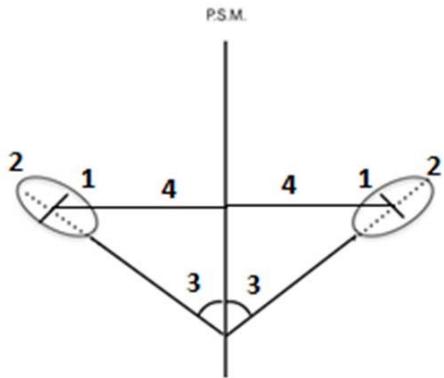
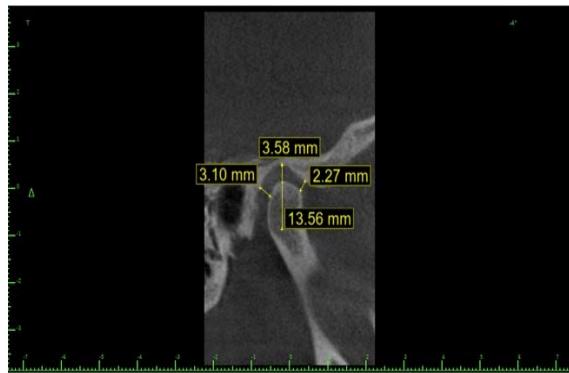
Figure 2: Illustration of axial cut measurements
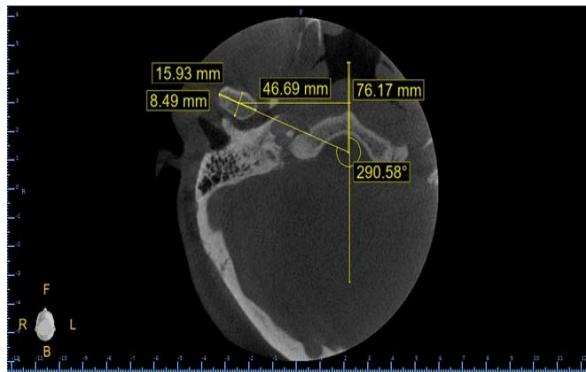
Figure 4: Axial cut measurements
 Figure 3: Sagittal section measurements
Table 1: Statistical analysis of group measurements
<table><tr><td rowspan="2"></td><td colspan="6">Groups</td><td rowspan="2">p-Value†</td></tr><tr><td>A Class I</td><td>B Class II</td><td>C Class III</td><td>D Fully</td><td>E Partially</td><td>F Multi Losses</td></tr><tr><td colspan="8">Sagittal MS 1</td></tr><tr><td>Right</td><td>13,92±3,23</td><td>10,98±7,40</td><td>14,69±2,27</td><td>15,14±2,96</td><td>15,25±1,60</td><td>14,29±2,50</td><td>0,420</td></tr><tr><td>Left</td><td>13,47±2,51</td><td>11,72±6,92</td><td>13,04±2,40</td><td>12,74±2,03</td><td>13,17±3,06</td><td>14,01±3,98</td><td>0,907</td></tr><tr><td>p-Value*</td><td>0,492</td><td>0,186</td><td>0,089</td><td>0,028</td><td>0,047</td><td>0,688</td><td></td></tr><tr><td colspan="8">Sagittal MS 2</td></tr><tr><td>Right</td><td>2,29±0,58</td><td>3,25±2,22</td><td>2,19±0,64</td><td>3,57±1,75</td><td>2,70±0,67</td><td>2,59±0,76</td><td>0,095</td></tr><tr><td>Left</td><td>2,22±0,85</td><td>2,34±0,76</td><td>1,88±0,58</td><td>3,51±1,54c</td><td>2,50±0,70</td><td>2,36±0,64</td><td>0,016</td></tr><tr><td>p-Value*</td><td>0,802</td><td>0,394</td><td>0,084</td><td>0,942</td><td>0,296</td><td>0,322</td><td></td></tr><tr><td colspan="8">Sagittal MS 3</td></tr><tr><td>Right</td><td>3,53±1,15</td><td>2,58±0,96</td><td>3,63±1,05</td><td>4,06±0,73</td><td>4,15±0,77</td><td>4,00±1,08</td><td>0,238</td></tr><tr><td>Left</td><td>3,39±0,85</td><td>2,23±0,65</td><td>3,44±1,21</td><td>4,17±1,35</td><td>3,67±0,70</td><td>3,93±0,77</td><td>0,101</td></tr><tr><td>p-Value*</td><td>0,565</td><td>0,192</td><td>0,366</td><td>0,773</td><td>0,067</td><td>0,709</td><td></td></tr><tr><td colspan="8">Sagittal MS 4</td></tr><tr><td>Right</td><td>1,99±0,76</td><td>2,12±0,37</td><td>2,32±0,91</td><td>1,67±0,73</td><td>1,83±0,90</td><td>2,32±1,23</td><td>0,620</td></tr><tr><td>Left</td><td>2,22±0,96</td><td>1,92±0,42</td><td>2,46±1,15</td><td>1,87±0,49</td><td>1,74±0,77</td><td>2,53±1,37</td><td>0,547</td></tr><tr><td>p-Value*</td><td>0,223</td><td>0,211</td><td>0,606</td><td>0,311</td><td>0,700</td><td>0,210</td><td></td></tr><tr><td colspan="8">Axial MA 1</td></tr><tr><td>Right</td><td>6,71±0,85</td><td>5,51±1,23</td><td>7,60±0,93b</td><td>6,84±1,43</td><td>7,07±0,83</td><td>7,28±0,67</td><td>0,043</td></tr><tr><td>Left</td><td>6,84±0,90</td><td>5,79±0,38</td><td>7,90±1,60</td><td>6,81±1,34</td><td>7,39±1,19</td><td>7,29±1,12</td><td>0,133</td></tr><tr><td>p-Value*</td><td>0,750</td><td>0,730</td><td>0,465</td><td>0,949</td><td>0,094</td><td>0,970</td><td></td></tr><tr><td colspan="8">Axial MA 2</td></tr><tr><td>Right</td><td>17,03±1,95</td><td>14,03±0,12</td><td>17,93±3,37</td><td>18,47±2,40</td><td>17,78±1,87</td><td>17,53±1,51</td><td>0,127</td></tr><tr><td>Left</td><td>17,34±1,86</td><td>15,22±2,82</td><td>18,52±2,97</td><td>18,14±2,82</td><td>16,79±2,32</td><td>17,71±2,06</td><td>0,383</td></tr><tr><td>p-Value*</td><td>0,345</td><td>0,528</td><td>0,119</td><td>0,754</td><td>0,183</td><td>0,695</td><td></td></tr><tr><td colspan="8">Axial MA 3</td></tr><tr><td>Right</td><td>66,92±4,99</td><td>56,46±17,66</td><td>65,59±11,16</td><td>61,88±10,01</td><td>62,41±3,91</td><td>64,71±4,63</td><td>0,465</td></tr><tr><td>Left</td><td>64,43±4,51</td><td>51,13±15,60</td><td>67,07±8,34b</td><td>62,50±11,34</td><td>66,95±7,84</td><td>69,12±4,69b</td><td>0,038</td></tr><tr><td>p-Value*</td><td>0,083</td><td>0,513</td><td>0,447</td><td>0,733</td><td>0,140</td><td>0,043</td><td></td></tr><tr><td colspan="8">Axial MA 4</td></tr><tr><td>Right</td><td>49,23±3,02</td><td>51,06±1,59</td><td>49,57±3,40</td><td>51,57±3,02</td><td>51,56±2,39</td><td>52,79±3,27</td><td>0,117</td></tr><tr><td>Left</td><td>48,75±1,96</td><td>51,19±1,91</td><td>50,74±3,67</td><td>51,90±4,83</td><td>51,12±3,54</td><td>52,44±3,18</td><td>0,265</td></tr><tr><td>p-Value*</td><td>0,591</td><td>0,845</td><td>0,066</td><td>0,755</td><td>0,591</td><td>0,628</td><td></td></tr></table>
Table 2: Analysis of condyle positioning
<table><tr><td>Group</td><td>p-Value*</td><td>Post-test</td></tr><tr><td>A</td><td></td><td></td></tr><tr><td>Right side</td><td>p=0,001</td><td>MS2a< MS3b> MS4a</td></tr><tr><td>Left side</td><td>p<0,001</td><td>MS2a< MS3b> MS4a</td></tr><tr><td>Average</td><td>p<0,001</td><td>MS2a< MS3b> MS4a</td></tr><tr><td>B</td><td></td><td></td></tr><tr><td>Right side</td><td>p=0,848</td><td>MS2a = MS3a = MS4a</td></tr><tr><td>Left side</td><td>p=0,900</td><td>MS2a = MS3a = MS4a</td></tr><tr><td>Average</td><td>p=0,870</td><td>MS2a = MS3a = MS4a</td></tr><tr><td>C</td><td></td><td></td></tr><tr><td>Right side</td><td>p<0,001</td><td>MS2a< MS3b> MS4a</td></tr><tr><td>Left side</td><td>p=0,004</td><td>MS2a< MS3b> MS4a</td></tr><tr><td>Average</td><td>p<0,001</td><td>MS2a< MS3b> MS4a</td></tr><tr><td>D</td><td></td><td></td></tr><tr><td>Right side</td><td>p=0,001</td><td>MS2a = MS3a > MS4b</td></tr><tr><td>Left side</td><td>p=0,003</td><td>MS2a< MS3b> MS4a</td></tr><tr><td>Average</td><td>p=0,001</td><td>MS2a< MS3b> MS4a</td></tr><tr><td>E</td><td></td><td></td></tr><tr><td>Right side</td><td>p=0,001</td><td>MS2a< MS3b> MS4a</td></tr><tr><td>Left side</td><td>p=0,002</td><td>MS2a< MS3b> MS4a</td></tr><tr><td>Average</td><td>p<0,001</td><td>MS2a< MS3b> MS4a</td></tr><tr><td>F</td><td></td><td></td></tr><tr><td>Right side</td><td>p=0,001</td><td>MS2a< MS3b> MS4a</td></tr><tr><td>Left side</td><td>p=0,001</td><td>MS2a< MS3b> MS4a</td></tr><tr><td>Average</td><td>p<0,001</td><td>MS2a< MS3b> MS4a</td></tr></table>
__________ after carefully reading the information contained in this FREE AND INFORMED CONSENT FORM, duly explained by the professionals in its smallest details, aware of the services and procedures to which you will be subjected, leaving no doubts about what has been read and explained, DECLARE and FIRM your FREE AND INFORMED CONSENT by agreeing to participate in the proposed research. It is made clear that the research participant may at any time withdraw his/her FREE AND INFORMED CONSENT and stop participating in this research, and is aware that all the information provided will be kept confidential under professional secrecy (Art. 9 of the Code of Dental Ethics).
[^2]: of 2 _(p.9)_
Generating HTML Viewer...
References
15 Cites in Article
O Silveira,Fcs Silva,Cen Almeida,F Tuji,P Seraidarian,F Manzi (2014). Useof CT for diagnosing temporomandibular joint.
Luciana Merigue,Ana Conti,Paula Oltramari-Navarro,Ricardo Navarro,Marcio Almeida (2016). Tomographic evaluation of the temporomandibular joint in malocclusion subjects: condylar morphology and position.
Matteo Saccucci,Michele D’attilio,Daria Rodolfino,Felice Festa,Antonella Polimeni,Simona Tecco (2012). Condylar volume and condylar area in class I, class II and class III young adult subjects.
J Arieta-Miranda,Silva Valencia,M Flores-Mir,C Paredes-Sampen,N Arriola-Guillen,L (2013). Spatial analysis of condyle position according to sagittal skeletal relationship, assessed by cone beam computed tomography.
Z Krisjane,I Urtane,G Krumina,K Zepa (2009). Threedimensional evaluation of TMJ parameters in Class II and Class III patients.
Vivek Ganugapanta,S Ponnada,K Gaddam,K Perumalla,I Khan,N Mohammed (2017). Computed Tomographic Evaluation of Condylar Symmetry and Condyle-Fossa Relationship of the Temporomandibular Joint in Subjects with Normal Occlusion and Malocclusion: A Comparative Study.
Andréia Rodrigues,Marcelo Fraga,Robert Vitral (2009). Computed tomography evaluation of the temporomandibular joint in Class I malocclusion patients: Condylar symmetry and condyle-fossa relationship.
M Paknahad,S Shahidi (2017). Association between condylar position and vertical skeletal craniofacial morphology: A cone beam computed tomography study.
R Vitral,Silva Da,M Campos,A Rodrigues,M Fraga (2011). Temporomandibular joint and normal occlusion: Is there anything singular about it? A computed tomographic evaluation.
A Rodrigues,M Fraga,R Vitral (2009). Computed tomography evaluation of the temporomandibular joint in Class II Division 1 and Class III malocclusion patients: condylar symmetry and condyle-fossa relationship.
R Vitral,Telles Cde,S Fraga,M De Oliveira,R Tanaka,O (2004). Computed tomography evaluation of temporomandibular joint alterations in patients with class II division 1 subdivision malocclusions: condyle-fossa relationship.
S Kandasamy,C Greene,A Obrez (2018). An evidencebased evaluation of the concept of centric relation in the 21st century.
R Vitral,Telles Cde,S (2002). Computed tomography evaluation of temporomandibular joint alterations in class II Division 1 subdivision patients: condylar symmetry.
S Ammanna,A Rodrigues,N Shetty,K Shetty,D Augustine,S Patil (2015). A tomographic study of the mandibular condyle position in partially edentulous population.
Elias Katsavrias,Demetrios Halazonetis (2005). Condyle and fossa shape in Class II and Class III skeletal patterns: A morphometric tomographic study.
No ethics committee approval was required for this article type.
Data Availability
Not applicable for this article.
How to Cite This Article
Cláudio Roberto Tavares Pereira Filho. 2026. \u201cInfluence of Tooth Loss and Malocclusions on Condylar Position: Analysis by Cone Beam Computed Tomography\u201d. Global Journal of Medical Research - D: Radiology, Diagnostic GJMR-D Volume 24 (GJMR Volume 24 Issue D1).
Explore published articles in an immersive Augmented Reality environment. Our platform converts research papers into interactive 3D books, allowing readers to view and interact with content using AR and VR compatible devices.
Your published article is automatically converted into a realistic 3D book. Flip through pages and read research papers in a more engaging and interactive format.
Subject: Global Journal of Medical Research - D: Radiology, Diagnostic
Authors:
Cláudio Roberto Tavares Pereira Filho, Lara Lecy Nogueira Barbosa de Sousa, Paulo Goberlânio De Barros Silva, Rafael Linard Avelar, Maysa Luna de Souza, Fernanda Araújo Sampaio (PhD/Dr. count: 0)
Our website is actively being updated, and changes may occur frequently. Please clear your browser cache if needed. For feedback or error reporting, please email [email protected]
Thank you for connecting with us. We will respond to you shortly.