This paper presents an innovative software interface for the utilization of widely used machine learning algorithms in a unified Python/R programming environment. This study makes two contributions. First, a more comprehensive and specialized architecture is made available for integrating machine learning into enterprise information systems. Second, a novel software model, Rbox+, is proposed to execute machine learning algorithms by jointly leveraging the capabilities of the Python and R programming languages through an Application Programming Interface (API). The proposed API is tested and evaluated using a publicly available benchmark dataset for regression analysis (Car-sales dataset, available on Kaggle), applying multiple machine learning models and comparative performance metrics. The obtained results demonstrate improved computational efficiency and scalability, with the execution of multiple models completed within a short processing time on standard hardware. Unlike conventional machine learning APIs or isolated ERP analytics tools, Rbox+ enables transparent, languageindependent execution and validation of machine learning models while exposing the underlying source code. The proposed approach supports practical applications in enterprise analytics, reproducible research, and machine learning education, enhancing interoperability between ERP systems, analytics platforms, and statistical programming environments.
## I. INTRODUCTION
### a) ML Overview and Challenges
Machine Learning (ML) is the process of creating software applications that enables a system to gain new knowledge from training data rather than through explicit programming. It employs several algorithms that learn from data iteratively to enhance, characterize, and predict outcomes. More accurate models based on the training data can then be created as the algorithms ingest training data. ML can be categorized into supervised, unsupervised learning and reinforcement learning. Many effective ML applications, from information-filtering systems to data-mining techniques, have been developed in recent years.
### b) Python and R Ecosystems
The frameworks and algorithms that are the key components of this field have also undergone substantial modifications. Today's technological advancements have updated forms of software engineering and computer architecture [7,15,31]. Furthermore, large volume of data management stresses the need for more efficient visualization and presentation tools [9,19]. Leading open-source programming languages like Python and R, are at the forefront of requisite quantitative computer programs [8,14,22]. Both programming languages have their own distinctive characteristics that encompass a wide range of ML algorithms, statistical controls, and strong data visualization features.
Being able to correlate data to detect patterns and anomalies can help an organization predict outcomes and improve its operations of business. Appropriate datasets must be applied for the learning process of an ML technique. Because the time at which training converges is unexpected, it is challenging to anticipate in advance the effort of training a model. The model training data set, learning parameter settings, and random variables all affect convergence [11,27].
### c) MLaaS and Cloud Deployment
Nowadays, big data helps to improve the accuracy of the ML models and makes it feasible to virtualize data, so that it may be kept in the cloud or on-premises in the most effective and economical way possible. Major cloud providers deliver ML as a Service (MLaaS), allowing users to train predictive models on this data even if they lack ML expertise or infrastructure [16,18]. Customers may outsource their costly ML operations to reliable servers using MLaaS, yet there are still no firm guarantees of service accuracy. The user may merely note that the trained model or prediction result is well-formed without knowing if the delivered result is accurate [35].
### d) The Rbox+ Initiative
Web APIs have become the preferred choice for the seamless integration of heterogeneous software systems. The primary objective of this research is to propose the design and implementation of an API (Rbox+), which is responsible for sending data to the R or Python programming environments, requesting the execution of various ML algorithms. Furthermore, statistical tests and graphical representations may also be performed in the R programming language returning the computation results in Python/R Jupyter Notebook [29] format.
The Rbox+ facilitates the integration of both Python and R programming environments with different types and content systems such as Enterprise Resource Planning (ERP) or Customer Relationship Management (CRM) which can consume Web services. The current study is intended to further develop an interface for integrating Python/R with the SAP S/4 Hana ERP system. SAP S/4 Hana ERP is an ERP business suite based on the SAP HANA in-memory database [4].
### e) Rbox+ Features
The Rbox+ is designed as an "open box" that is receptive to further adjustments, modifications, and improvements. Validation of ML models is very crucial, providing a parameter for software integration and system implementation. The user can review and compare the source code of both Python and R by examining the results of the requested ML and statistical tests. This feature further enhances the transparency of the results by modifying and improving the ML algorithms if needed, as their validation becomes more critical than ever before.
### f) Organization of the Paper
The outline of this paper is organized as follows. Section 2 presents the Rbox+ interface and its utilization, emphasizing the implementation of ML algorithms. Section 3 introduces and analyzes the software architecture of the proposed system from a Web service perspective. Section 4 presents simulation results and code implementation based on a use-case scenario involving multiple ML regression algorithms. Finally, Section 5 concludes the paper with a discussion and an outlook on future work.
## II. THE PYTHON/R INTEGRATION FOR THE RBOX+ UTILIZATION
### a) Rbox+Overview
Machine learning data processing and visualization tools are rarely embedded directly into information systems that are commonly used for managing an organization's core operations [1]. Representative examples of such systems include Microsoft Excel and SAP S/4 Hana ERP. SAP S/4 Hana represents SAP A. G.'s ERP solution and integrates critical enterprise activities such as Financial Accounting, Sales and Distribution, Materials Management, Production Planning, and Human Resources [34]. Despite its widespread adoption, SAP S/4 Hana lacks native advanced analytics, machine learning execution, and data visualization capabilities. Instead, these needs are typically addressed through separate analytical platforms such as SAP BI or SAP Analytics Cloud [30].
Rbox+ is designed to bridge this gap by providing a lightweight and flexible Web API that enables enterprise systems to directly invoke machine learning and statistical algorithms implemented in Python and R. Unlike traditional ERP analytics solutions or MLaaS platforms, which often operate as closed or proprietary environments, Rbox+ allows enterprise applications to trigger ML computations while retaining full access to the underlying algorithmic logic and execution flow.
From the perspective of system integration, Rbox+ simplifies the interaction between heterogeneous software environments. Through a single web service call, client applications can submit datasets and analysis requests without requiring native support for Python or R. This design enables ML-driven analytics to be embedded into existing enterprise workflows without altering the underlying ERP or spreadsheet-based infrastructure.
### b) Integration with Python and R
Rbox+ is implemented as a generic API that enables the Python and R programming environments to be seamlessly incorporated into any application capable of issuing HTTP requests [24]. From an integrator's perspective, Rbox+ simplifies the integration process by minimizing the required implementation effort. The integration consists of a single step, which involves preparing and executing a direct service call through Rbox+'s dispatcher method. This design simplicity and flexibility make Rbox+ highly user-friendly.
Most modern programming languages provide built-in mechanisms for converting two-dimensional datasets into JSON structures that can be transmitted as parameters to web services. As a result, invoking Rbox+ is comparable to making a standard function call in most programming environments. A key feature of Rbox+ is its generic calling mechanism, which remains consistent regardless of the specific machine learning algorithm, statistical test, or graphical output requested. Integrators are therefore only required to construct a JSON request containing the dataset and the selected analysis, while the remaining integration code can be reused. This approach ensures efficient, flexible, and reusable calls to Rbox+, thereby enhancing the overall integration process.
### c) Output and Reproducibility via Jupyter Notebook
From an end-user perspective, Rbox+ generates output in the form of Jupyter Notebook files. Jupyter Notebook is an open-source web application that supports interactive computing by combining executable code, narrative text, equations, and visualizations within a single document [13]. Rather than detailing the general functionality of Jupyter Notebook, this work focuses on its specific role in enhancing the usability, transparency, and reproducibility of Rbox+.
By producing results directly in Jupyter Notebook format, Rbox+ preserves the complete computational workflow, including the Python /R source code, intermediate outputs, and final results. This integration enables users to review, validate, and reproduce analyses without relying on opaque result summaries. In addition, the notebook format allows analysts to extend or modify the generated code, supporting iterative experimentation and a deeper understanding of the applied ML techniques [10,21].
The reproducibility facilitated by Rbox+ is particularly important in research and enterprise analytics contexts, where model validation and auditability are critical. Unlike many ERP analytics tools or MLaaS platforms, which typically provide only aggregated results, Rbox+ exposes the entire execution logic. This allows users to verify assumptions, inspect parameter settings, and assess model robustness, thereby enhancing trust in ML-driven decision support and aligning with best practices in reproducible research [23].
Furthermore, the notebook-based output makes Rbox+ suitable for educational use. It can serve as a structured template for teaching ML concepts, enabling students to explore algorithms, visualize results, and connect theoretical concepts with executable code. The ease of use and standardized output format make Rbox+ applicable to both introductory ML coursework and advanced analytical research.
In summary, Rbox+ combines generic Web API architecture with direct Python/R execution and reproducible Jupyter-based output. This combination distinguishes it from existing ERP analytics solutions, MLaaS platforms, and standalone scripting approaches by offering transparency, interoperability, and extensibility within a unified integration framework.
### d) Machine Learning Process in Rbox+
A wide range of companies, including Google Cloud AI [20], Amazon Web Services (AWS) AI [2], IBM Watson [17], and Microsoft Azure [25], provide cloud-based machine learning services. These platforms offer collections of APIs that execute inference computations using industry-trained deep neural networks (DNNs) on powerful cloud infrastructures, without requiring developers to possess in-depth knowledge of ML algorithms or resource provisioning.
Despite their advantages, third-party ML APIs still present several challenges, particularly when ML applications must be integrated into larger software systems. One approach to making ML more powerful, practical, and interoperable is the development of interfaces that enable algorithm execution independently of programming language and data format. ML algorithms are implemented in diverse ways and are designed to operate on heterogeneous datasets. Owing to differences in semantics, data requirements, and accuracy-performance trade-offs, ML APIs can be difficult to use correctly and efficiently.
In this study, these limitations are addressed through the introduction of Rbox+, a web-service-based interface that enables researchers and developers to perform statistical analyses and execute ML algorithms in the R and Python environments. Rbox+ provides a simplified and uniform access layer for ML execution, facilitating integration and comparative analysis across platforms. Tables 1 and 2 present the Rbox+ templates developed using the Python and R programming language.
Table 1: ML Algorithms in Python
<table><tr><td>Template</td><td>ML Task</td><td>Options/Hyperparameters</td></tr><tr><td>Decision Trees</td><td>Classification/Regression</td><td>Descriptives
Correlation matrix
k-fold Cross Validation</td></tr><tr><td>Advanced Trees</td><td>Classification/Regression</td><td>Descriptives
Correlation matrix
Bagging
Random Forest
Extremely Randomized Trees
k-fold Cross Validation</td></tr><tr><td>Boosting Trees</td><td>Classification/Regression</td><td>Descriptives
Correlation matrix
AdaBoost
XG Boost
Light GBM
k-fold Cross Validation</td></tr><tr><td>Gaussian
Mixture</td><td>Clustering</td><td>Descriptives
Correlation matrix</td></tr><tr><td>Mini Batch K. means</td><td>Clustering</td><td>Descriptives
Correlation matrix</td></tr><tr><td>Naive Bayes</td><td>Classification</td><td>Descriptives
Correlation matrix
k-fold Cross Validation</td></tr><tr><td>Stochastic Gradient Descent</td><td>Classification/Regression</td><td>Descriptives
Correlation matrix
k-fold Cross Validation</td></tr><tr><td>Support Vector Machines</td><td>Classification/Regression</td><td>Descriptives
Correlation matrix
Linear kernel
RBF kernel
Sigmoid kernel
Polynomial kernel
k-fold Cross Validation</td></tr></table>
Table 2: ML & Statistical Algorithms in R
<table><tr><td>Template</td><td>ML Task</td><td>Options/Hyperparameters</td></tr><tr><td>k-means</td><td>Clustering</td><td>Descriptives
Silhouette method
Gap statistic method
Anova</td></tr><tr><td>K-prototypes</td><td>Clustering</td><td>Descriptives
Silhouette method
Anova
Chi-square tests</td></tr><tr><td>Hierarchical Clustering</td><td>Clustering</td><td>Descriptives
Anova</td></tr><tr><td>Partitioning Around Medoids (PAM)</td><td>Clustering</td><td>Descriptives
Silhouette method
Gap statistic method
Anova
Chi-square tests</td></tr><tr><td>Clustering Large Applications (CLARA)</td><td>Clustering</td><td>Descriptives
Silhouette method
Gap statistic method
Anova
Chi-square tests</td></tr><tr><td>K-Nearest Neighbors</td><td>Classification/ Regression</td><td>Descriptives
Correlation matrix
Elbow method
ROC curve</td></tr><tr><td>Linear Regression</td><td>Regression</td><td>Descriptives
Pearson's Correlation
R(square value
Residuals distribution
NCV test
Spread Level Plot</td></tr><tr><td>Linear Multiple Regression</td><td>Regression</td><td>Descriptives
Correlation matrix
Collinearity test
K-fold cross-validation
Stepwise Regression</td></tr><tr><td>Logistic Regression</td><td>Classification</td><td>Descriptives
Correlation matrix
Collinearity test
Hosmer test (Goodness of fit)
Predictive ability
ROC curve</td></tr><tr><td>Multinomial Logistic Regression</td><td>Classification</td><td>Descriptives
Correlation matrix
Evaluate Collinearity
Stepwise Regression</td></tr><tr><td>Principal Component Analysis (PCA)</td><td>Dimensionality Reduction</td><td>Descriptives
Correlation matrix
Correlations Vars – PCs</td></tr><tr><td>PCA mix</td><td>Dimensionality Reduction</td><td>Descriptives
Plots</td></tr><tr><td>Random Forest</td><td>Classification/Regression</td><td>Descriptives
Correlation matrix</td></tr><tr><td>t-Test</td><td>Association</td><td>Descriptives
Kolmogorov-Smirnov
Levene's test
Mann-Whitney U
Boxplots
Histogram</td></tr><tr><td>Paired t-Test</td><td>Association</td><td>Descriptives
Pearson's Correlation
Kolmogorov-Smirnov
Mann-Whitney
Histograms</td></tr><tr><td>One-way Anova</td><td>Association</td><td>Descriptives
Tukey HSD (honest significance test)
Levene's test (homoskedasticity test)
Diagnostic plots
Kruskal Wallis</td></tr><tr><td>Two-way Anova</td><td>Association</td><td>Descriptives
Tukey HSD
Pairwise t-tests
Levene's test
Normality test</td></tr><tr><td>x2 test</td><td>Association</td><td>Descriptives
Crosstabss
Balloon plot
Barplot</td></tr></table>


### e) The Rbox + Learning Aspect
Rbox+ has been designed as a distinctive learning and analysis tool, acknowledging the researcher's fundamental motivation to understand how algorithmic calculations are performed. By displaying the generated Python/R source code at every stage of the computational workflow, Rbox+ ensures full transparency throughout the entire data processing cycle, including data upload, data manipulation, statistical testing, data analysis, and visualization of the results. This characteristic transforms Rbox+ into a powerful instructional tool that enables developers and researchers to gain a deeper understanding of machine learning algorithms and their execution context, while also supporting the development of Python/R programming skills.
Data analysis in a machine learning context involves multiple stages, including data collection and exploration, data cleaning and preprocessing, feature selection, model training and evaluation, and iterative refinement. The objective is to understand the data, improve its quality, and optimize it for effective model training [32]. The iterative nature of this process allows for continuous refinement of the analytical pipeline and the resolution of emerging challenges. Ultimately, the goal is to deploy a well-performing model and monitor its performance over time [26]. Within this framework,
Rbox+ provides an accessible platform for exploring complex statistical and machine learning techniques, supporting the learning process of its users.
## III. SYSTEM ARCHITECTURE
### a) The Three-Tier Design
This section describes the System Architecture, which is defined independently of the implementation details. The Rbox+ API operates on a web server that is connected to both the R and Python programming environments and is implemented using the PHP programming language. The machine learning methods included in Rbox+ are accessible to any application capable of handling HTTP requests. The design of Rbox+ follows a conventional three-tier architecture [24]. More specifically, it is based on a client-server model consisting of three distinct processing layers, as illustrated in Figure 1:
a) Client Tier (service consumer) concerns the calling applications of Rbox+.
b) API Tier (service provider) handles the requests towards the R and Python environments.
c) Processing Tier executes the requested ML and statistical computations.
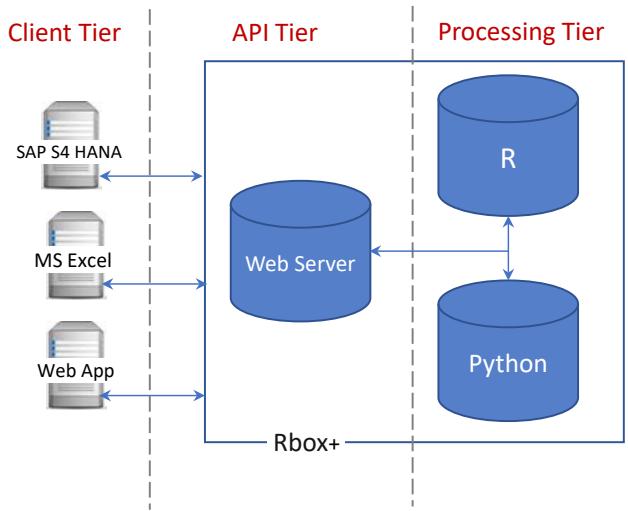 Figure 1: Rbox+ Three-tier Architecture
### b) Request JSON Structure
All three tiers (Processing, API, and Client tier), operate in accordance with the previously proposed Rbox API [24] and are briefly described in the following section. The API tier functions as a web server that handles HTTP requests via POST method. Each request carries a JSON structure (Table 1) containing information about the requested machine learning algorithm (implemented in Python/R), as well as the dataset to which the model will be applied.
Table 3: JSON Structure
<table><tr><td>Variable</td><td>Description</td><td>JSON sample for t-Test</td></tr><tr><td>template</td><td>ML/Statistical test</td><td rowspan="9">{"template": "P.NaiveBayes",
"numvars": 2,
"numopts": 6,
"options": [1,1,1,1,1,1],
"variables": [
{id]: "X0",
"name": "VEHICLE_TYPE",
"datatype": "factor",
"values": ["Car", "Passenger",...}],
{id": "X1",
"name": "PRICE",
"datatype": "numeric",
"values": ["21.50", "28.40",...]]}}</td></tr><tr><td>numvars</td><td>Variables counter</td></tr><tr><td>numopts</td><td>Options counter</td></tr><tr><td>options</td><td>Options on/off</td></tr><tr><td>variables</td><td>Variables list</td></tr><tr><td>id</td><td>\(x_{1}\ldots x_{n}\)</td></tr><tr><td>name</td><td>Variable name</td></tr><tr><td>datatype</td><td>Variable type</td></tr><tr><td>values</td><td>Value list</td></tr></table>
After the execution of the corresponding script, a response is returned to the calling system. This response essentially includes a URL pointing to the results page. The machine learning outputs are presented in Jupyter Notebook format [29], allowing end users to view both the generated Python/R source code and the corresponding computational results within a single HTML document.
The JSON element template specifies the requested machine learning technique or statistical test. As shown in Table 1, the options parameter includes on/off switches that control the hyperparameters of the ML algorithm or enable additional tests associated with each method. The variables element of the JSON structure contains the attributes id, name, and datatype, along with the corresponding list of values for each variable. The id attribute represents the unique identifier of each variable and ranges from $x_0$ to $x_n$. The numvars parameter specifies the total number of variables, while numopts indicates the number of available on/off switches within the options array.
Through this mechanism, Rbox+ dynamically enables or disables hyperparameters for each ML method, thereby reducing the execution time of the corresponding Python/R script and minimizing the overall response time of the HTTP request.
## IV. SIMULATION RESULTS AND CODE IMPLEMENTATION
### a) Sample Dataset and use-case Scenario
In this section, indicative results produced by Rbox+ are presented. A publicly available dataset, commonly used for educational purposes, is employed to demonstrate the flexibility of Rbox+ in executing multiple ML algorithms and selecting the best-fitting model through comparative analysis. The car sales data set is available in the Kaggle repository and contains information on vehicle sales across different manufacturers. In addition to sales volume, the dataset includes several explanatory variables, such as resale value, price, engine size, horsepower, wheelbase, width, length, fuel capacity, fuel efficiency, and power performance factor.
For the purposes of the presented use-case scenario, a range of machine learning algorithms supported by Rbox+ is applied to predict vehicle sales volume. The explanatory variables used in the analysis include engine size, horsepower, wheelbase, width, length, fuel capacity, and fuel efficiency. This type of prediction problem is addressed using multiple regression models, and the predictive performance of each method is evaluated using the $\mathsf{R}^2$ and adjusted $\mathsf{R}^2$ metrics [3].
### b) Model Selection
After importing the dataset in the Rbox+ Excel Client, the researcher can select the Data Analysis model (Regression, Classification, Clustering or Dimensionality Reduction) and the desired ML method. At this step, it is important to specify the response variable as well as the independent variables. Additional options can also be enabled, performing further calculations or plots useful during the analysis stage as shown in Figure 2. Moreover, Figure 3 illustrates the option of using the SAP S4Hana Client. The analyst can easily explore all the available ML Regression methods and trigger the execution accordingly.
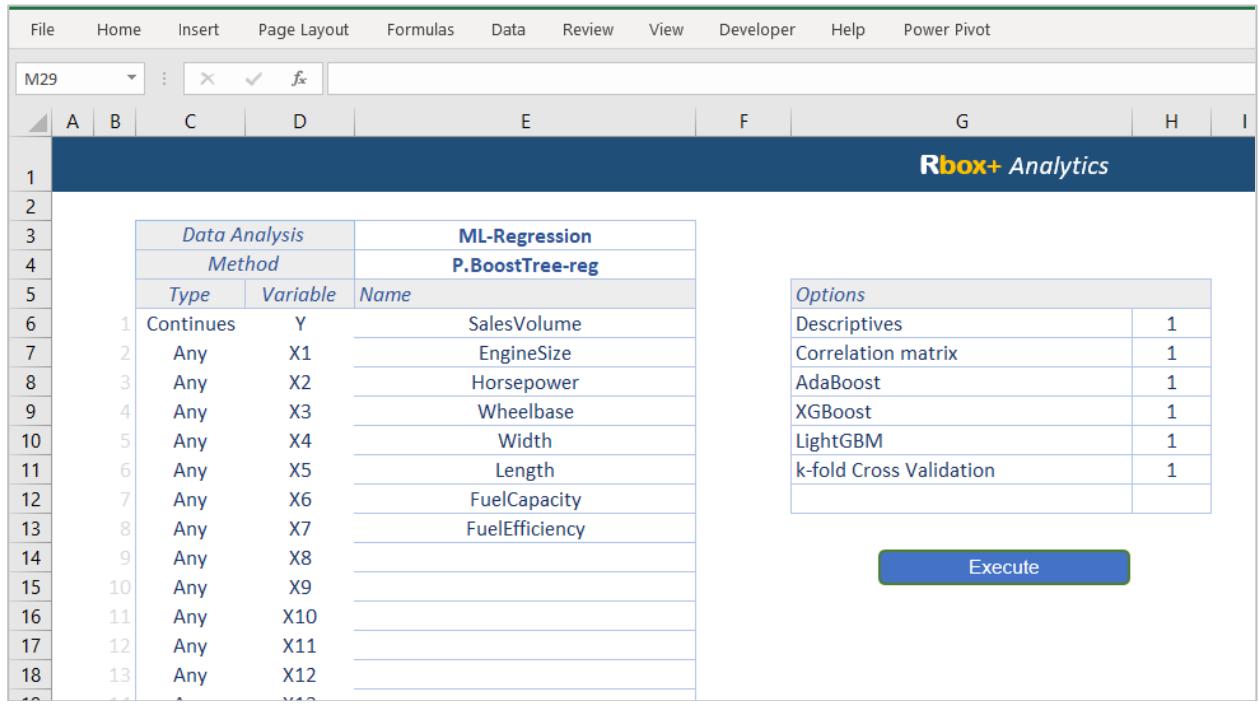 Figure 2: Rbox+ Excel Client
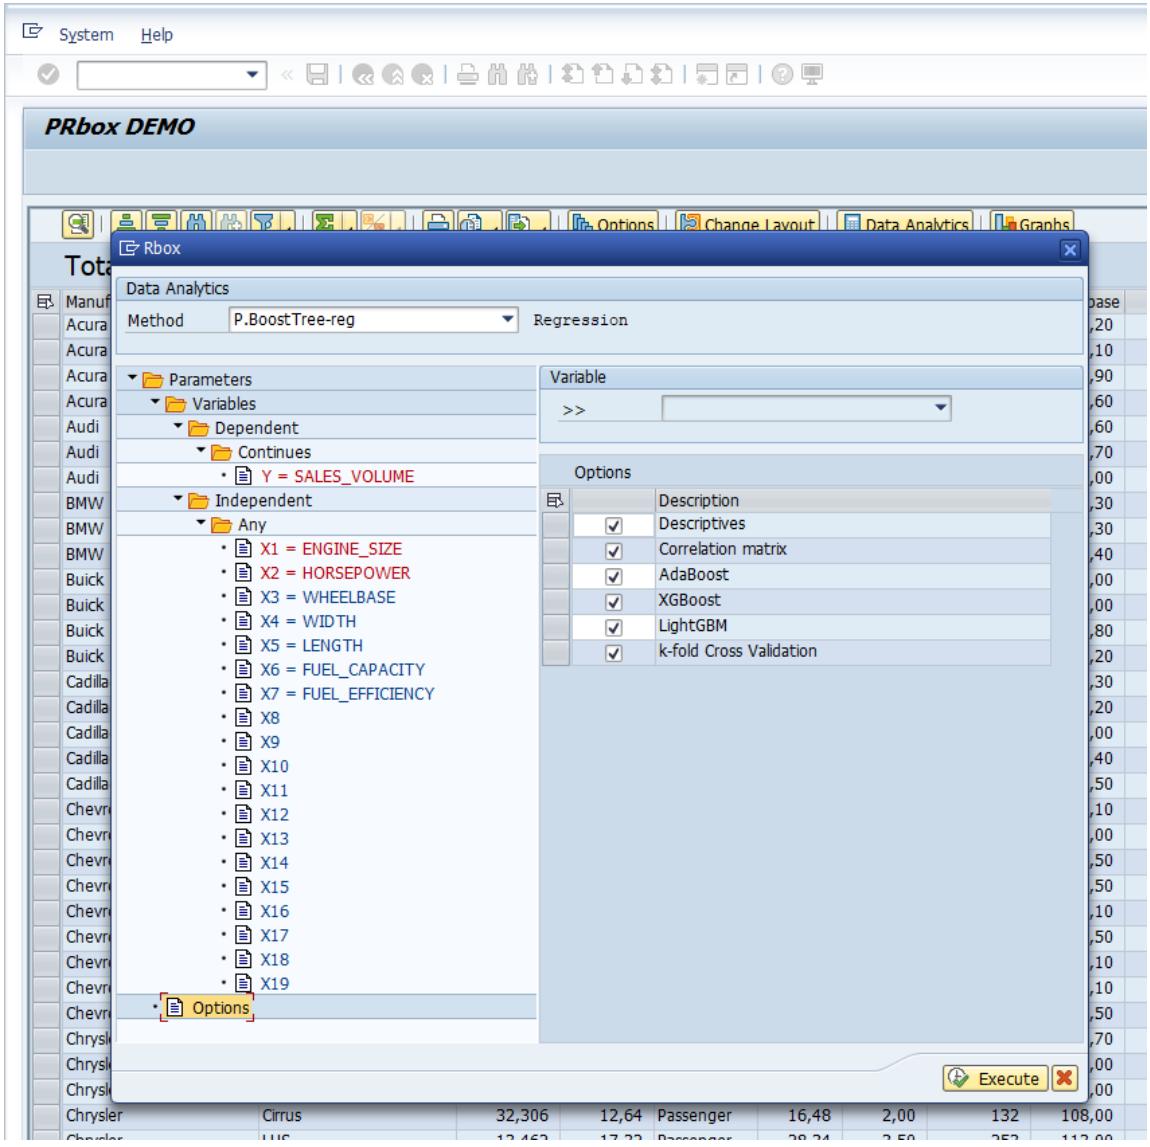 Figure 3: Rbox+SAP S4 Hana Client
### c) Results Page
The calculation outcomes are presented in Jupyter Notebook format within the user's web browser, as illustrated in Figures 4 and 5. Both the source code and the extracted results appear on the same page, allowing the analyst to review the outcomes and compare the goodness of fit across different models.
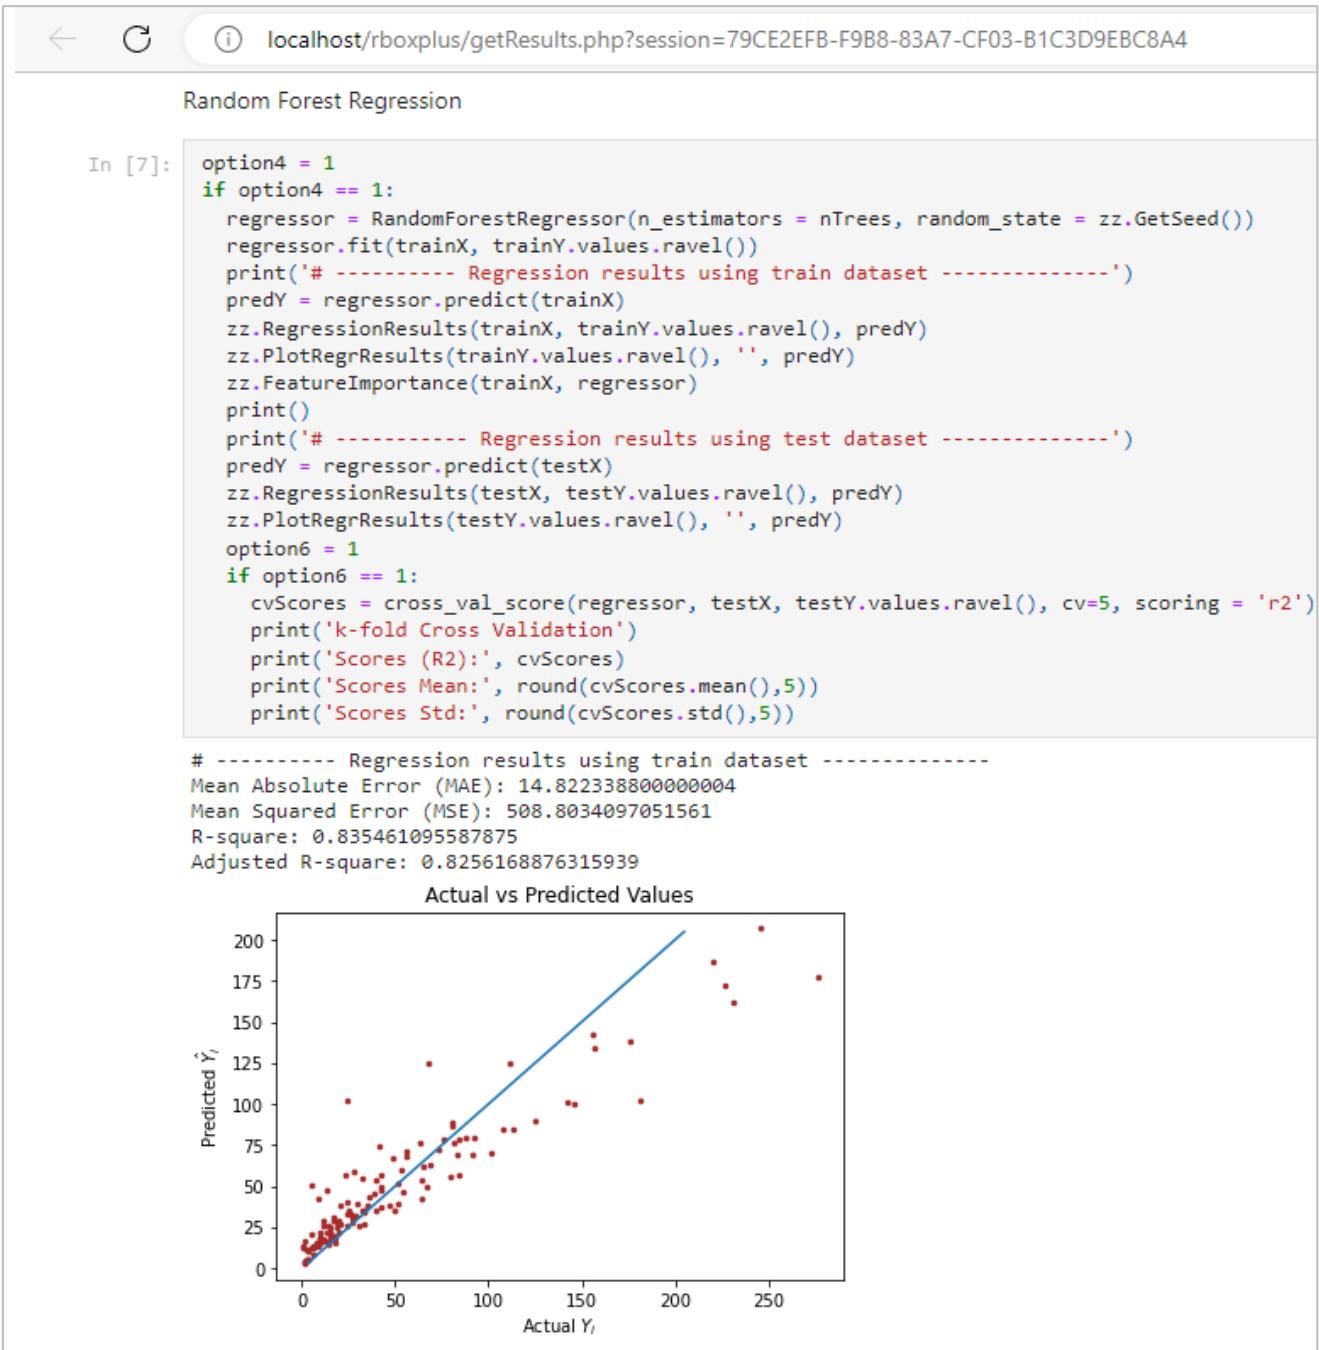 Figure 4: Rbox + Results: Jupyter Notebook

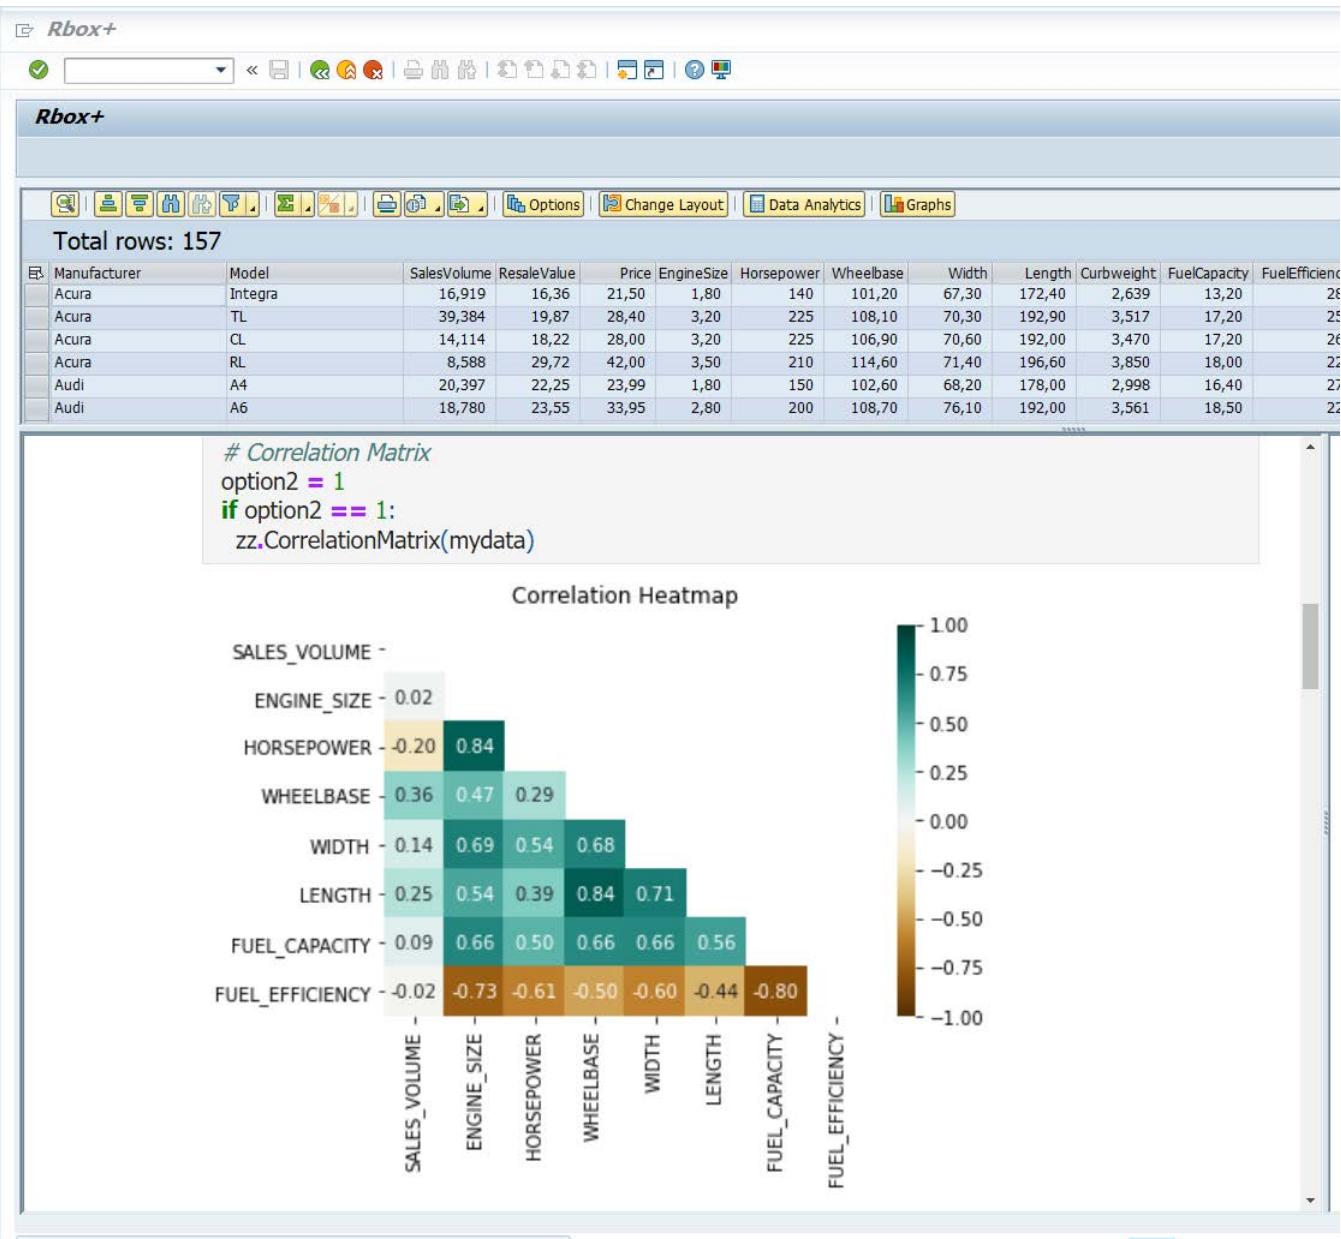 Figure 5: Rbox + SAP S4 Hana output
In the Excel worksheet, a table is displayed that contains hyperlinks to the results page, the generated source code, and the corresponding Jupyter Notebook file. Through these links, the analyst can access the complete history of the performed computations and revisit or reassess the associated results at any time, as illustrated in Figure 6.
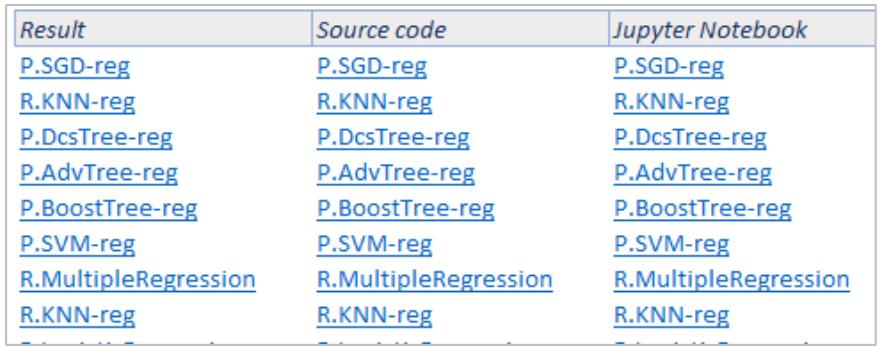 Figure 6: Rbox + API hyperlinks
The users can export the entire Python or R development environment (e.g., Jupyter Notebook, VS source code, as depicted in Figures 7 and 8, and Code, Eclipse). subsequently edit and process it in their preferred
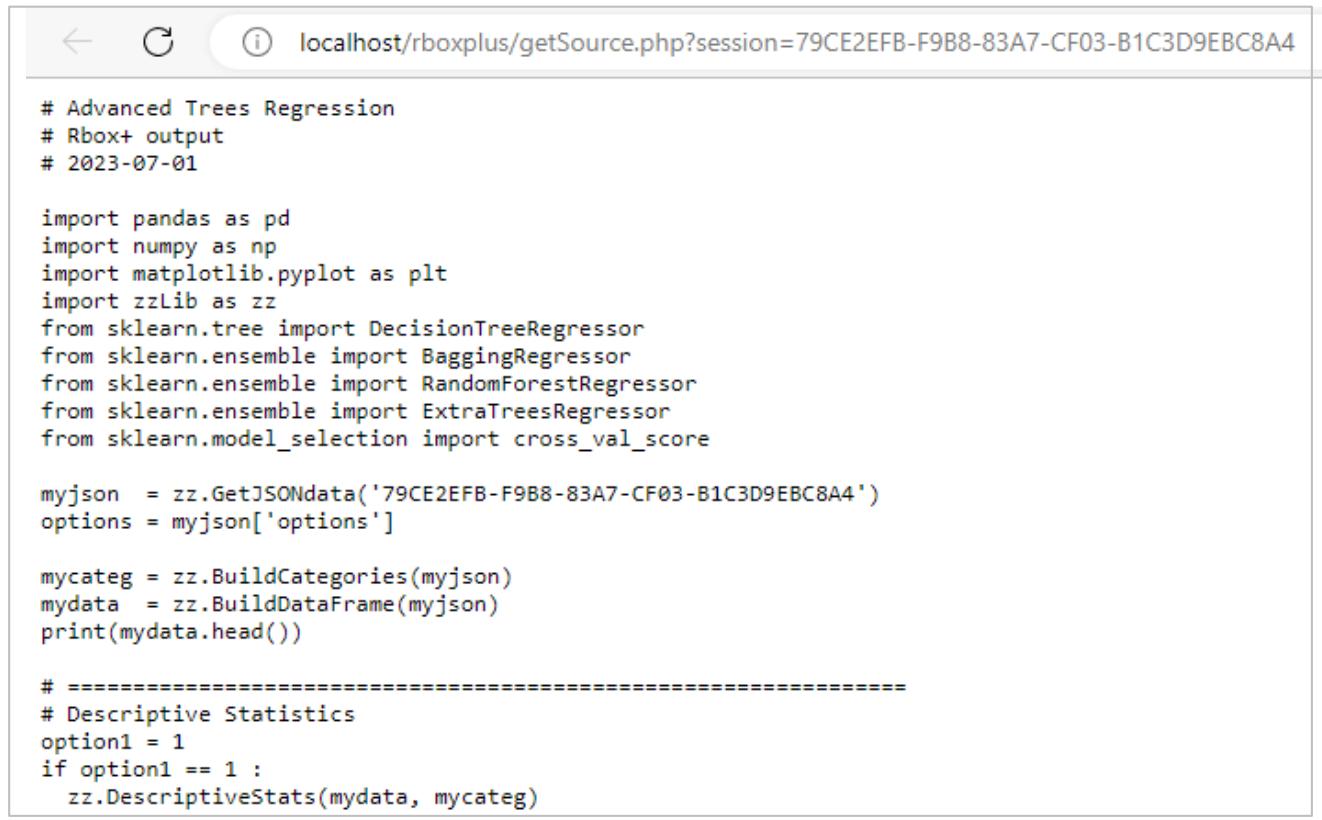 Figure 7. The Source Code
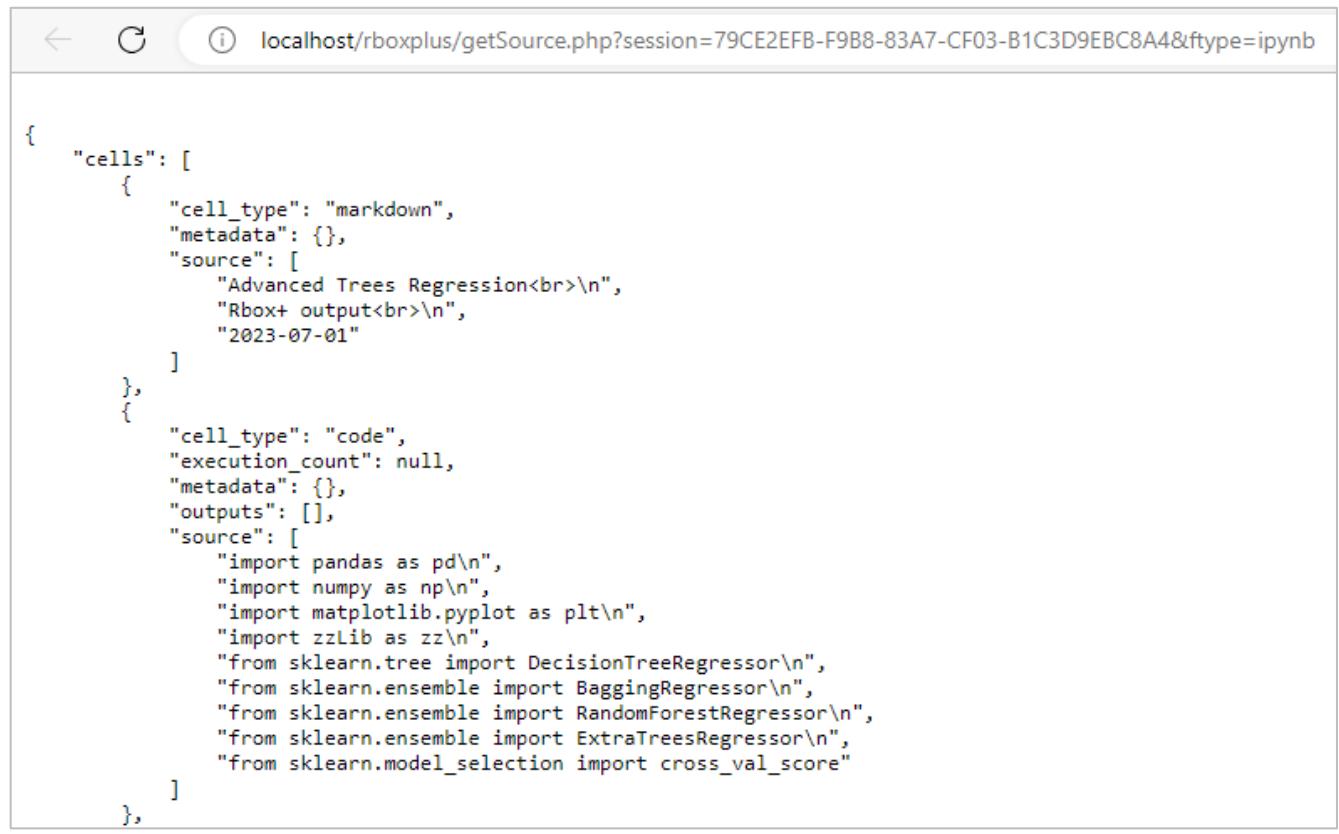 Figure 8: Jupyter Notebook (.ipynb) file
### d) Performance Evaluation
For the purposes of the selected use-case scenario, a wide variety of ML regression algorithms were executed, and the results are presented in Table 4.
Table 4: ML Regression Algorithms and their Results
<table><tr><td>ML Regression</td><td>Method</td><td>MSE</td><td>R2</td><td>Adj.R2</td></tr><tr><td rowspan="3">Support Vector Machines</td><td>Linear kernel</td><td>0.804</td><td>0.195</td><td>0.147</td></tr><tr><td>Polynomial kernel</td><td>0.830</td><td>0.169</td><td>0.120</td></tr><tr><td>RBF kernel (Gaussian Kernel Radial Basis)</td><td>0.767</td><td>0.232</td><td>0.186</td></tr><tr><td rowspan="3">Boosting Trees</td><td>AdaBoost (Adaptive Boosting)</td><td>270.738</td><td>0.912</td><td>0.907</td></tr><tr><td>XGBoost (eXtreme Gradient Boosting)</td><td>101.074</td><td>0.967</td><td>0.965</td></tr><tr><td>LightGBM (Light Gradient Boosting Machine)</td><td>1678.109</td><td>0.457</td><td>0.424</td></tr><tr><td rowspan="3">Advanced Trees</td><td>Bagging Regression</td><td>507.963</td><td>0.835</td><td>0.825</td></tr><tr><td>Random Forest</td><td>508.803</td><td>0.835</td><td>0.825</td></tr><tr><td>ExtraTrees (Extremely Randomized Trees)</td><td>100.603</td><td>0.967</td><td>0.964</td></tr><tr><td>KNN</td><td>K-Nearest Neighbors</td><td>1.073</td><td>0.067</td><td>-0.216</td></tr><tr><td>SGD</td><td>Stochastic Gradient Descent</td><td>0.742</td><td>0.257</td><td>0.213</td></tr><tr><td>Decision Tree</td><td></td><td>1559.749</td><td>0.495</td><td>0.465</td></tr><tr><td>Multiple Regression</td><td></td><td>56.010</td><td>0.331</td><td>0.291</td></tr></table>
Seven discrete ML regression algorithms were evaluated, some with multiple variations, resulting in a total of 13 distinct result sets. The predictive performance of each model can be assessed using the $R^2$ and Adjusted $R^2$ metrics. Notably, the execution of all 13 models on a dataset with 8 variables and 157 observations required less than two minutes on a conventional commercial laptop equipped with an Intel Core i5 processor and 8 GB of RAM.
The analyst can readily identify the best-fit model by comparing the extracted results and determining the next steps. For the Car-sales dataset, the XGBoost (eXtreme Gradient Boosting) regression model produced the best fit $(\mathrm{Adj.R}^2 = 0.965)$ among the tested algorithms.
### e) Findings and Key Take aways
Exploring datasets with Rbox+ across multiple ML models provides several advantages. It enables researchers to identify the model that best fits a given dataset, supporting informed decision-making while offering insight into the relative strengths and limitations of each approach [33]. Because every ML model carries inherent assumptions and potential biases [6], evaluating diverse algorithms helps assess the robustness of results and ensures that observed patterns are consistent across methods, thereby enhancing the generalizability of findings.
Additionally, models may assign varying levels of importance to features within the dataset, and comparing feature rankings across algorithms allows researchers to identify the most influential variables and gain insight into underlying data dynamics [36].
Employing multiple models also aids in detecting overfitting, a common challenge in which models perform well on training data but fail to generalize to unseen data [5]; this detection informs necessary adjustments or regularization strategies. Furthermore, combining models through ensemble or stacking techniques can improve predictive performance by mitigating individual model weaknesses and leveraging complementary strengths [28].
Finally, each ML model embodies unique assumptions, and exploring a range of algorithms provides alternative perspectives that can reveal hidden patterns, thereby enrich the depth of analysis and contribute to a more comprehensive understanding of the data [12].
### f) Limitations and Future Research
While Rbox+ offers significant advantages, certain constraints remain. Current testing has focused on moderate-sized datasets; consequently, further research is required to assess scalability regarding high-frequency data streams and "Big Data" contexts. Additionally, the complexity of security protocols and access control in highly regulated environments necessitate deeper investigation. To address these gaps, future development could transition the "open box" framework toward more sophisticated capabilities, including automated hyperparameter tuning and distributed processing to manage large-scale data. A planned emphasis on deeper cloud infrastructure integration to enhance the system's flexibility and deployment readiness must also be considered.
## V. CONCLUSIONS
This paper introduces Rbox+, an innovative API designed as a comprehensive framework for the integration of machine learning systems. By bridging the gap between enterprise information systems and the Python/R programming environments, Rbox+ streamlines the analytics design cycle, minimizes implementation complexity, and enhances the operational utility of ML algorithms. The framework provides a unified, language-independent interface that allows complex statistical analyses to be executed seamlessly within existing corporate infrastructures.
Empirical evaluation indicates that Rbox+ efficiently executes multiple ML models within a single analytical workflow. In a demonstrated use-case, thirteen regression models were applied to a moderate-sized dataset, completing processing tasks on standard consumer hardware and thereby confirming the practical feasibility of the approach. Furthermore, the framework's ability to directly compare model performance using established metrics facilitates more informed model selection and validation.
The primary contributions of this study are fourfold. First, Rbox+ establishes a unified Web API that provides a generic and extensible interface, enabling enterprise systems to invoke ML algorithms without requiring native support for statistical languages. Second, the framework promotes transparency and reproducibility by exposing generated source code and delivering results in Jupyter Notebook format, which fosters greater trust in ML-driven decision support. Third, the practical applicability of the system is demonstrated through successful integration with SAP S/4Hana and Microsoft Excel. Finally, Rbox+ supports comparative ML evaluation by enabling the parallel execution of multiple algorithms, allowing analysts to efficiently assess predictive performance and robustness.
The identified limitations and future research directions for Rbox+ focus on four primary areas: scalability, data governance, security protocols, and functional expansion.
In conclusion, Rbox+ offers a transparent, flexible, and extensible approach to integrating machine learning into enterprise systems. By combining interoperability with reproducibility, the framework helps bridge the gap between advanced ML techniques and operational enterprise analytics, acting in parallel as an educational and learning tool.
# Conflict of Interest Statement
Spiros Chountas and Antonios Konomos declare no conflicts of interest.
Generating HTML Viewer...
References
36 Cites in Article
Osama Ali,Ali Nassif,Luiz Capretz (2013). Business intelligence solutions in healthcare a case study: Transforming OLTP system to BI solution.
Amazon (2020). Introduction to Amazon Web Services.
A Arias,P Westfall (2020). Understanding Regression Analysis: A Conditional Distribution Approach.
D Bardhan,A Baumgartl,N Choi,M Dudgeon (2021). SAP S/4 HANA An Introduction.
M Bejani,M Ghatee (2021). A systematic review on overfitting control in shallow and deep neural networks.
A Bellet,A Habrard (2015). Robustness and generalization for metric learing.
E Borgia (2014). The Internet of Things vision: Key features, applications and open issues.
P Bruce,A Bruce,P Gedeck (2020). Practical Statistics for Data Scientists: 50+ Essential Concepts using R and Python.
Longbing Cao (2017). Data Science.
A Cardoso,J Leitão,C Teixeira (2019). using the Jupyter notebook as a tool to support the teaching and learning processes in engineering courses, The Challenges of the Digital Transformation in Education.
Ying Chen,Zhihong Yuan,Bingzhen Chen (2018). Process optimization with consideration of uncertainties—An overview.
Victoria Cox (2017). Translating Statistics to Make Decisions.
Jiangang Hao,Tin Ho (2019). Machine Learning Made Easy: A Review of <i>Scikit-learn</i> Package in Python Programming Language.
Thomas Haslwanter (2016). Python.
B Hazen,C Boone,J Ezell,D (2014). Jones-Farme: Data quality for data science, predictive analytics, and big data in supply chain management: An introduction to the problem and suggestions for research and application.
J Huang,K Ko,M Shu,B Hsu (2020). Application and comparison of several machine learning algorithms and their integration models in regression problems.
Ibm Ibm,Watson (2020). Unknown Title.
Ross Ihaka,Robert Gentleman (1996). R: A Language for Data Analysis and Graphics.
Amir Gandomi,Murtaza Haider (2015). Beyond the hype: Big data concepts, methods, and analytics.
(2020). Google Cloud AI.
Brian Granger,Fernando Pérez (2021). Jupyter: Thinking and Storytelling with Code and Data.
Nenad Jukić,Abhishek Sharma,Svetlozar Nestorov,Boris Jukić (2015). Augmenting Data Warehouses with Big Data.
Mary Kery,Marissa Radensky,Mahima Arya,Bonnie John,Brad Myers (2018). The Story in the Notebook.
A Konomos,S Chountasis (2023). Rbox: A web API for software integration with the R programming language.
(2020). Microsoft Azure Cognitive Services.
S Naghibi,H Pourghasemi (2015). A comparative assessment between three machine learning models and their performance comparison by bivariate and multivariate statistical methods in groundwater potential mapping.
Andy Neumann,Nuno Laranjeiro,Jorge Bernardino (2021). An Analysis of Public REST Web Service APIs.
Bohdan Pavlyshenko (2018). Using Stacking Approaches for Machine Learning Models.
Quinn Dombrowski,Tassie Gniady,David Kloster (2020). Introduction aux carnets Jupyter.
L Richardson,S Ruby (2008). RESTful Web Services.
W Richert,L Coelho (2013). Building Ensemble Models with Python.
P Simard,S Amershi,D Chickering,A Pelton,S Ghorashi,C Meek,G Ramos,J Suh,J Verwey,M Wang,J Wernsing (2017). Machine teaching: A new paradigm for building machine learning systems.
Sunil Singh,Arpita Nagpal,Rakhee Sharma (2016). A Comparative Analysis of Machine Learning Algorithms for Classification of Natural Disaster Tweets.
Harry Tanuwidjaja,Rakyong Choi,Seunggeun Baek,Kwangjo Kim (2020). Privacy-Preserving Deep Learning on Machine Learning as a Service—a Comprehensive Survey.
Lingchen Zhao,Qian Wang,Cong Wang,Qi Li,Chao Shen,Bo Feng (2021). VeriML: Enabling Integrity Assurances and Fair Payments for Machine Learning as a Service.
Alexander Zien,Nicole Krämer,Sören Sonnenburg,Gunnar Rätsch (2009). The Feature Importance Ranking Measure.
No ethics committee approval was required for this article type.
Data Availability
Not applicable for this article.
How to Cite This Article
Dr. Antonios Konomos. 2026. \u201cIntegrating Machine Learning into Business Management Systems: The Rbox+ API\u201d. Global Journal of Computer Science and Technology, Global Journal of Computer Science and Technology - C: Software & Data Engineering GJCST-C Volume 26 (GJCST Volume 26 Issue C1): .
Explore published articles in an immersive Augmented Reality environment. Our platform converts research papers into interactive 3D books, allowing readers to view and interact with content using AR and VR compatible devices.
Your published article is automatically converted into a realistic 3D book. Flip through pages and read research papers in a more engaging and interactive format.
This paper presents an innovative software interface for the utilization of widely used machine learning algorithms in a unified Python/R programming environment. This study makes two contributions. First, a more comprehensive and specialized architecture is made available for integrating machine learning into enterprise information systems. Second, a novel software model, Rbox+, is proposed to execute machine learning algorithms by jointly leveraging the capabilities of the Python and R programming languages through an Application Programming Interface (API). The proposed API is tested and evaluated using a publicly available benchmark dataset for regression analysis (Car-sales dataset, available on Kaggle), applying multiple machine learning models and comparative performance metrics. The obtained results demonstrate improved computational efficiency and scalability, with the execution of multiple models completed within a short processing time on standard hardware. Unlike conventional machine learning APIs or isolated ERP analytics tools, Rbox+ enables transparent, languageindependent execution and validation of machine learning models while exposing the underlying source code. The proposed approach supports practical applications in enterprise analytics, reproducible research, and machine learning education, enhancing interoperability between ERP systems, analytics platforms, and statistical programming environments.
Our website is actively being updated, and changes may occur frequently. Please clear your browser cache if needed. For feedback or error reporting, please email [email protected]
Thank you for connecting with us. We will respond to you shortly.