
I. INTRODUCTION
Hydrogen bond (HB) is vital in many physical, chemical, and biological systems in life, and hydrogen fluoride (HF) is one of the strong proton donor molecule which is worthy of investigation nature of (HB). In [1] v(HF) stretching band formation mechanisms of B...HF complexes were investigated both experimentally and theoretically in detail. Recently, computational efforts performed on the relevant complexes [2]. In [3] for and trimers accurate spectral parameters were presented through a very high level of quantum chemical calculations. Optimal geometry, harmonic spectral parameters and energetic evaluations of the complexes were shown in [4]. This complex has been investigated both experimentally and theoretically by THz spectroscopic and CCSD(T)-F12/aug-cc-pV5Z and MP2/aug-cc-pVQZ quantum chemical calculations [5]. In this work dissociation energy of the dimer is estimated as kJ·mol for the global potential energy minimum.
Anharmonic calculations in mp2/6-311++G(3df,3pd) approximation and low temperature matrix-isolation experimental studies were performed in [6]. For the complex, both experimental and computational results have showed in our paper [7]. In [8], spectral and geometrical parameters of the and -complexes were performed by using the mp2 theory and multidimensional variation methods. Anharmonic calculations are play an essential role in the investigation of hydrogen bonded molecular complexes due to well agreement with the experimental results. Recently, numerous works have been devoted to solving anharmonic multidimensional problems with the help of Schrödinger equations with the variational methods [9-11]. In [12] authors utilized fully automated code for the establishing of interatomic force constants for the identification ro-vibrational spectral parameters for several HB molecular complexes. The results in the report are significantly important to analyze internal dynamics, to recognize spectral manifestation of molecular complexes, and to distinguishing overlapping spectral lines of noncovalent bonded molecular complexes.
In this work, complex and monomers are studied with the help FTIR spectroscopy in the gas phase and quantum chemical calculations. Obtained results are coincided with relevant literature.
II. EXPERIMENTAL AND COMPUTATIONAL METHODS
a) Experimental Methods
The high-resolution absorption spectra of the complex and monomer were recorded with the help Bruker 125 HR spectrometer at the resolution of in the gas phase. Formaldehyde molecule transferred from the powder to the gas phase by the phase changer vacuum equipment. The vacuum atmosphere has created inside of cavity cell, and the samples were placed into stainless steel cavity according to the real gas lows. The stainless-steel cavity was in length with sapphire and ZnSe windows. Total pressure of the mixture was about 20-100 Torr.
b) Computational Methods
Quantum chemical calculations are carried out by the help of the latest version of GAUSSIAN 16 software [15] with mp2/6-311++G(3df,3pd) approximation. Equilibrium geometries, interaction energies, and various harmonic spectral parameters of the complex have been determined.
III. RESULTS AND DISCUSSION
a) Experimental Part
Gas phase vibrational spectra of molecular complexes yield adequate information about the rotational dynamics and complicated intermolecular interactions. Recently, in [6] the complex and its monomers have been studied in the matrix with the help of FTIR spectroscopy. Infrared spectra in matrix in the and regions were analyzed in detail. Within and regions a new spectral features have observed.
Fig.1. shows stretching region of the complex and molecule. In the figure,
R, Q, and P branches observed. The yellow spectrum belongs to the pure molecule at pressure (c), the green spectrum belongs to the complex recorded at Torr (b) and blue is belongs to the complex at 65 Torr (a), for all three spectra recorded at a resolution of . Even through the fact that there were no observations of spectral changes upon the complex formation in the band, the intensity of lines increased when the pressure increased from 65 to 95 Torr. The line parameters of the band were in good agreement with HITRAN [13] database.
Intensities of the transitions can be determined through the following formula
Where, S is the absorption intensity of the lines (in km/mol), i-initial state, f-final state, \nu-is the transition frequency (in cm^{-1}), \langle i|\mu_x|f\rangle^2, \langle i|\mu_y|f\rangle^2, \langle i|\mu_z|f\rangle^2 - the dipole moment components (in D).
Herein the line intensities of the bands increasing when upgrade the pressure from 65 to 95 Torr, respectively.
![Figure 1: Absorption spectra of pure H2CO and HF+ H2CO complex in gas phase in the v(C[]O) stretching region. (yellow, pure H2CO p=0.006 kgf/cm2, green, HF+ H2CO complex p=90 Torr and blue, HF+ H2CO complex 65 Torr, resolution 0.05 cm-1)](https://doc.globaljournals.org/nvtq43_58233/ocr/images/derivatives/9e/9e2a3a1b9114bd79192086797f4c6fdb749389d906c07ad868aa0beec49a7b8a.webp)
All the spectral features related to the H-F, C=O, and C-H stretches and the HF librational vibrations in the complex.
In contrast with studied complexes in [1], in this work, the v(HF) region is complicated spectral features are not observed upon the complex formation. Due to following reasons, complicated spectral patterns have not observed: firstly, C=O and HF stretching vibrations are weakly interacting mutually in the complex. Secondly, the mechanical anharmonic constant of the HF molecule is sufficiently large and equals . Thirdly, the molecule keeps the inclination to polymerization even in the case of low concentrations.
Therefore, we are not considering the focus region of the complex. It requires further experimental investigations at a convenient condition and with the help of unique spectroscopic techniques.
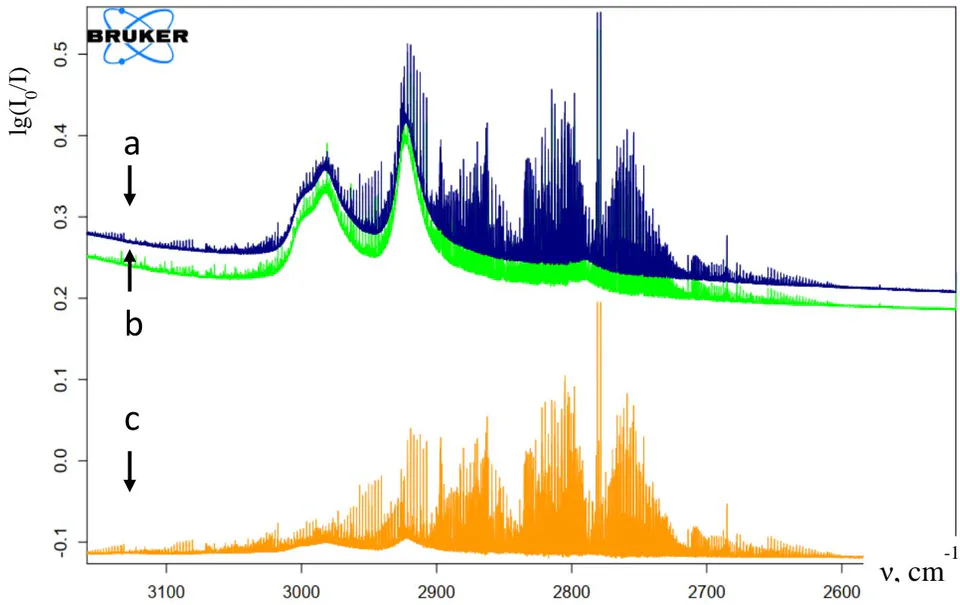
Fig. 2. shows stretching region of the complex and molecule. In the spectrum, R, Q, and P branches have observed, respectively. The yellow spectrum (c) belongs to the pure molecule at pressure , and green (b) belongs to the complex which is recorded at Torr and at blue (a) belongs to the complex Torr, respectively. All spectra were recorded at the spectral resolution.
b) Computational Part
Quantum chemical calculations on the complex have been carried out with using the GAUSSIAN 16 software in the mp2/6-311++G(3df,3pd) approximation with the basis set superposition error taken into account. This approximation provides accurate information for the spectral parameters of the complex. The band changes (blue or red), of the frequency, and intensity changes have been explained in [4] in detail. The equilibrium geometry of the complex is presented in Fig.3. Selected geometrical parameters of the complex have shown in table 1.
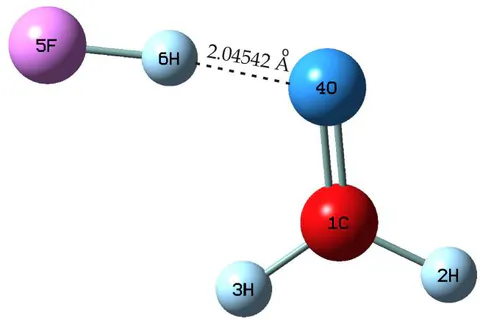
Upon the formation of the complex, H-F stretching frequency shortened by and the stretching band of formaldehyde also shortened about .
The C-H stretching frequency is blue shifted by about , and the atomic distance between C and O is increased. The H-F frequency is equal (3546 cm ) according to the computational results and this value equals to which is calculated in experiment [14]. The frequency of HF molecule according to experimental investigation equals to . This value shifts toward the low energy side upon the complex formation by about according to quantum chemical calculation findings. Geometrical and spectral parameters of the complex are in good agreement with the calculated parameters in [6]
| Distances, (Å) | Monomers | Complex | Angles, (°) | Monomer | Complex |
| r(H3–F) | 0.915 | 0.936 | ∠OCH1 | 121.5 | 121.3 |
| r(C=O) | 1.207 | 1.215 | ∠OCH2 | 121.5 | 121.1 |
| r(C–H1) | 1.101 | 1.096 | ∠OH3F | 166.4 | |
| r(C–H2) | 1.102 | 1.097 | ∠COH3 | 111.2 | |
| r(O...H3) | 1.753 | ∠COF | 141.4 | ||
| r(O...F) | 2.649 |
Dipole moment of the complex calculated in CCSD(T)6311++G(3df,3pd) approximations equals to
3.81D. Change of geometrical parameters upon complex formation of the complex are shown in Table 2.
| H2CO···HF | |||
| Interatomic distances (Å) | |||
| Δr(C=O) | Δr(CH2) | Δr(CH3) | Δr(HF) |
| 0.0057 | -0.0047 | -0.0039 | 0.0186 |
In Table 3. calculated and experimental determined frequency and intensities are shown. The banding energy of the complex equals to , and atomic distance to be 0.921 Å.
| Assignments | Harmonic | Experiment | ||
| v | S | v | S | |
| C=O stretch | 1758 | 75 | 1744 | 61 |
| C-H in phase stretch | 3017 | 47 | 2763 | 42 |
| C-H out of phase | 3120 | 44 | 2882 | 39 |
VI. CONCLUSION
In this work complex is studied with the help of FTIR spectroscopy and quantum chemical calculations. High-resolution absorption spectra of the complex in regions of , and C-H are presented. Although, the fact that no changing reasons in , stretching bands upon the complexation are explained.
Quantum chemical calculations are carried out at mp2/6-311++g(3df,3pd) approximation. Dipole moment is equal to 3.81 D. The complex formation energy equals to . A good agreement was found between experimental and computational results and the results coincide with the relevant literatures. We believe that the experimental and computational results of this work can be used to better realize the internal dynamics of the B...HF complexes.