## I. INTRODUCTION
In order to be certain of the simultaneous effects of several variables, multivariate statistical methods are used to analyze the behavior of the set of different random variables. The main objective of the multivariate analysis is highly variable in relation to what we want to achieve with them, which raises the different scenarios that explain the objective of the multivariate analysis.
In this sense, there are some applications of multivariate analysis for hydrometeorological factors, such as (Soley & Alfaro, 1999) proposes multivariate analysis methods that by the year 1999, were being applied in the Geophysical Research Center in the projects of study of climatic variability, and names three methods: principal component analysis, singular value decomposition, and the canonical correlation method. (Soley & Alfaro, 1999) in their scientific publication, conclude that, despite the fact that the precipitation fields of the Pacific and the Caribbean are climatologically different, the anomalies could show similar behaviors when affected by large-scale processes.
It can be mentioned that (Entrajes, Varni, Gandini, & Usunoff, 1996) carried out a research work based on the analysis of principal components (PCA), of homogeneous regions of precipitation in the area of the Arroyo del Azul basin (6237 km2), which is located in the center of the province of Bs. As., Arg. The identification of these regions allowed researchers, among other applications, their inclusion in hydrological models of water flow (surface and groundwater), and in the agroecological regionalization of the area.
As a result (Entrajes, Varni, Gandini, & Usunoff, 1996), determined from the analysis of data from 12 stations from the period 1985-1994, two components were selected that, together, consider more than $89\%$ of the variance. total contained in the original data. Precipitation being a continuous spatial function, and that the principal components derived from them are also continuous and, therefore, the load distribution maps express the association between the precipitation at each point in the basin and that registered at the hypothetical station. What does each principal component represent?
The main objective of this research work is to analyze the correlation of the historical precipitation variable of three stations located in Nicaragua, Costa Rica and Honduras, with the global historical precipitation data from WorlClim, implementing multivariable statistical methods to answer the following question.: Will historical precipitation data for Nicaragua, Costa Rica, and Honduras be correlated with WorldClim global historical data, and can WorldClim global historical data be used for a timely hydrological analysis in the absence of that?
## II. OBJECTIVES
### a) General Objective
Analyze the correlation of the historical precipitation variable of Nicaragua, Costa Rica, and
Honduras with the global historical precipitation of WorldClim.
## III. ESPECIFICS OBJECTIVES
Detail historical precipitation data for each area of interest, as well as global data.
Develop the multivariable correlation model between the precipitation data of each area of interest with the global data.
Examine the influence of global precipitation data in the studied area of interest.
## IV. METHODOLOGICAL DESIGN
### a) Kind of Investigation
The present work was designed under the methodological approach of the quantitative approach, since this is the one that best adapts to the characteristics and needs of the present investigation.
The quantitative approach uses data collection and analysis to answer research questions and test previously established hypotheses, and translates into: "the sequential and probative. Each stage precedes the next and we cannot "jump" or avoid steps. The order is rigorous, although of course, we can redefine some phase. It starts from an idea that is being delimited and, once defined, objectives and research questions are derived, the literature is reviewed and a theoretical framework or perspective is built. From the questions hypotheses are established and variables are determined; a plan is drawn up to test them (design); variables are measured in a certain context; the measurements obtained using statistical methods are analyzed, and a series of conclusions regarding the hypothesis or hypotheses are drawn". (Sampieri, Fernandez Collado, & Baptista, 2014. Page 5).
The observation technique was taken from the quantitative approach, the database information is collected and can be quantified. Data collection is done through quantitative observation, since it allows quantifying the behavior of precipitation over time.
### b) Execution Time
In the development of the research work, there were three months, of which one month to obtain the precipitation data of a series from 1960 to 2021 global climate of WorldClim, one month to process the data from different sites of study interest. at the regional level, and one month to obtain and write the final report, in the period from April to June 2023.
### c) Data Collection Technique and Method
By downloading high-resolution global weather-climate data of precipitation, for mapping using the WorldClim spatial model. The data is used for mapping and spatial modeling. Since the data is provided for use in research and related activities.
By obtaining precipitation data from the INETER database, from the airport station, Managua Nicaragua.
By obtaining precipitation data from the database of the National Meteorological Institute of Costa Rica.
By obtaining precipitation data from the database of the Center for Atmospheric, Oceanographic and Seismic Studies.
Microsoft Excel will be used, since it brings together the statistical applications used for this study.
## i. Primary Sources
WorldClim Portal, Global Climate and Weather Data: Historical Climate Data, Historical Monthly Weather Data for Precipitation.
Portal of the Nicaraguan Institute of Territorial Studies, historical monthly precipitation data.
Portal of the National Meteorological Institute of Costa Rica, historical monthly precipitation data.
Portal of the Center for Atmospheric, Oceanographic and Seismic Studies of Honduras, historical monthly precipitation data.
## ii. Secondary Sources
Scientific articles related to the use of multivariable statistical methods.
Bibliography related to multivariate statistics.
Library of the Nicaraguan Institute of Territorial Studies of Nicaragua (INETER), meteorology department.
### d) Universe
Regional precipitation data for Nicaragua, Costa Rica, Honduras, and global precipitation data fromWorldClim.
### e) Population
The precipitation database for the Aeropuerto station in Nicaragua, the El Indio coffee station, San Vito-Puntarenas in Costa Rica, and the Amapala station in Honduras, as well as the precipitation database for the Central American region.
### f) Sample
Airport station precipitation database for the period 1958-2020 in Nicaragua, El Indio coffee station precipitation database, San Vito-Puntarenas for the period 1968-2020 in Costa Rica, Amapala precipitation database in the period of 1952-2020 in Honduras, and database of global precipitation in the period of 1960-2021 of Worclim.
### g) Inclusion Criteria
We worked with precipitation data in raster format from regional WorldClim in Central America, precipitation data measured from the Nicaraguan airport station, precipitation data measured from the El Indio coffee station, San Vito-Puntarena in Costa Rica, and precipitation data measured from the Amapala station in Honduras.
### h) Exclusion Criteria
All those precipitation data that are not measured from the stations: airport in Nicaragua, El Indio coffee plantation, San Vito-Puntarena in Costa Rica, and Amapala in Honduras, and that are not studied in the 1958-2020 ranges, 1968-2020, 1952-2020 and 1960-2021 established by each station respectively.
## V. THEORETICAL ASPECTS
There are many definitions of multivariate statistics, according to the complexity of the problem, there are techniques that range from the simplest to the most complex. There is no single definition, therefore, the definition in which the study carried out in this investigation is most accurately adapted will be used.
According to (García, 2021), defines multivariate statistics as different methods that study and examine the simultaneous effect of multiple variables. (García, 2021) also describes that multivariate methods are used to analyze the behavior of the set of more than one random variable.
There is a wide multivariate technique used for the analysis of multiple data, and they are available in various statistical studies, some of which will be mentioned.
### a) Matrix Chart
This Matrix Graph technique, (García, 2021) states that in this technique it is used to show the pairs of X-Y graphs of a set of quantitative variables. It is an excellent technique if it is required to detect pairs of highly correlated variables, and it can also detect cases with outliers.
### b) Correlation Analysis
(García, 2021), on this occasion he defines in his blog, that it is a process of correlation analysis and its objective is to summarize two or more columns of numerical data. Calculate summary statistics for each variable, as well as the correlation and covariance between the two.
### c) Spider Diagram
Taking (García, 2021) as a reference, he defines this technique as a spider diagram that is also known as a radar graph, it is used to show the values of various quantitative variables depending on the situation.
Then there is the Factorial Analysis technique (García, 2021), he defines it as the analysis that produces a linear combination of multiple quantitative variables, these variables represent the highest percentage of variation. These types of analyzes are used to narrow the scope of the problem in order to better understand the factors that affect the variables studied.
### d) Logistic Regression Analysis
(García, 2021), states that the logistic regression analysis, is also known as a selection model, is a multiple regression variable that allows predicting events and studies the influence of two types of variables on each other: dependent variables and non-dependent variables. The first is an explanatory variable, while the second is a non-explanatory variable. The first variable describes the current state of the database, and the second interprets the data through the dependency between two variables. (García, 2021) ensures that it is a technique that helps predict the choices that consumers can make when choosing alternatives.
Finally, not the last, but if one of the most important, you have the Linear Discriminant Analysis, (García, 2021), describes that it is a technique that was designed to help distinguish two or more sets of data based on a set of quantitative variables. This is achieved by establishing a discriminant function or linear combination of variables.
To mention a few more, there is Correspondence Analysis, Multidimensional Scaling, and Canonical Correlation.
The multivariate analysis technique is based on optimizing the data or simplifying the structure of the data, ordering and grouping the data, investigating the dependency relationship between variables, predictive relationship between variables, construction and testing of hypotheses. And it is from here that logistic regression analysis has been identified as the most important technique.
## VI. RESULTS
According to the preparation of the data, certain years are discriminated until measurement homogeneity is reached in the same year. In this case, the analysis is carried out from 1968 to 2020, which is where the data is complete in a homogeneous manner. See table 1:
Table 1: Cumulative, Global and Station presentation data for Nicaragua, Costa Rica and Honduras
<table><tr><td rowspan="2">Year</td><td>WorldClim</td><td>Estation NIC</td><td>EstationCR</td><td>Estation H</td></tr><tr><td>Accumulated</td><td>Accumulated</td><td>Accumulated</td><td>Accumulated</td></tr><tr><td>1968</td><td>2371.86</td><td>1266.60</td><td>1271.6</td><td>1401.90</td></tr><tr><td>1969</td><td>2571.41</td><td>1368.50</td><td>2297</td><td>1458.30</td></tr><tr><td>1970</td><td>2517.08</td><td>1082.00</td><td>1714.2</td><td>1294.80</td></tr><tr><td>1971</td><td>2043.23</td><td>1293.40</td><td>1803.3</td><td>1231.60</td></tr><tr><td>1972</td><td>2021.77</td><td>669.70</td><td>1000.5</td><td>847.00</td></tr><tr><td>1973</td><td>2327.46</td><td>1742.90</td><td>1617.6</td><td>1299.10</td></tr><tr><td>1974</td><td>2137.27</td><td>868.80</td><td>1358.8</td><td>1092.60</td></tr><tr><td>1975</td><td>2168.22</td><td>1365.00</td><td>1374.2</td><td>1175.20</td></tr><tr><td>1976</td><td>2013.26</td><td>744.40</td><td>1025.7</td><td>896.40</td></tr><tr><td>1977</td><td>1918.44</td><td>812.70</td><td>1124.4</td><td>926.60</td></tr><tr><td>1978</td><td>2297.52</td><td>1008.10</td><td>1417.8</td><td>1024.70</td></tr><tr><td>1979</td><td>2563.92</td><td>1058.70</td><td>2410.1</td><td>1507.10</td></tr><tr><td>1980</td><td>2466.21</td><td>1376.00</td><td>1831.1</td><td>1468.00</td></tr><tr><td>1981</td><td>2623.52</td><td>1306.10</td><td>1721.9</td><td>1535.10</td></tr><tr><td>1982</td><td>2280.63</td><td>1354.40</td><td>1590.5</td><td>1331.00</td></tr><tr><td>1983</td><td>2189.58</td><td>806.70</td><td>1237</td><td>933.10</td></tr><tr><td>1984</td><td>2385.22</td><td>1151.90</td><td>1600.8</td><td>1036.20</td></tr><tr><td>1985</td><td>1994.12</td><td>1251.90</td><td>1136.2</td><td>1010.10</td></tr><tr><td>1986</td><td>1955.51</td><td>780.20</td><td>1530.2</td><td>1132.80</td></tr><tr><td>1987</td><td>1975.43</td><td>1102.80</td><td>905.2</td><td>977.70</td></tr><tr><td>1988</td><td>2474.85</td><td>1679.60</td><td>2117.3</td><td>1898.80</td></tr><tr><td>1989</td><td>2171.58</td><td>785.20</td><td>1163.4</td><td>1059.40</td></tr><tr><td>1990</td><td>2266.09</td><td>755.80</td><td>1040.2</td><td>1111.70</td></tr><tr><td>1991</td><td>2052.21</td><td>980.50</td><td>1039.4</td><td>788.80</td></tr><tr><td>1992</td><td>2196.25</td><td>704.80</td><td>1143.5</td><td>921.40</td></tr><tr><td>1993</td><td>2281.27</td><td>1420.00</td><td>1533.4</td><td>1456.70</td></tr><tr><td>1994</td><td>1908.26</td><td>1018.90</td><td>851.9</td><td>891.80</td></tr><tr><td>1995</td><td>2400.96</td><td>1360.20</td><td>2061.2</td><td>1715.10</td></tr><tr><td>1996</td><td>2372.41</td><td>1608.60</td><td>1601.9</td><td>1655.20</td></tr><tr><td>1997</td><td>2193.98</td><td>862.40</td><td>1246.6</td><td>1096.40</td></tr><tr><td>1998</td><td>2342.17</td><td>1565.00</td><td>1891.5</td><td>1933.70</td></tr><tr><td>1999</td><td>2295.39</td><td>1253.90</td><td>1815.4</td><td>1130.50</td></tr><tr><td>2000</td><td>2133.99</td><td>957.10</td><td>1317.1</td><td>1005.10</td></tr><tr><td>2001</td><td>2149.15</td><td>862.00</td><td>1289.6</td><td>814.70</td></tr><tr><td>2002</td><td>2163.02</td><td>1224.60</td><td>1208.6</td><td>1227.80</td></tr><tr><td>2003</td><td>2179.96</td><td>1229.60</td><td>1672.2</td><td>1089.50</td></tr><tr><td>2004</td><td>2271.23</td><td>819.20</td><td>1512.5</td><td>1065.20</td></tr><tr><td>2005</td><td>2307.87</td><td>1395.10</td><td>2086.8</td><td>1589.10</td></tr><tr><td>2006</td><td>2423.60</td><td>683.30</td><td>993.5</td><td>1042.50</td></tr><tr><td>2007</td><td>2184.45</td><td>1411.90</td><td>1830.3</td><td>1556.00</td></tr><tr><td>2008</td><td>2500.90</td><td>1439.50</td><td>1907.6</td><td>1410.20</td></tr><tr><td>2009</td><td>2078.57</td><td>796.10</td><td>1162</td><td>921.60</td></tr><tr><td>2010</td><td>2466.79</td><td>1775.90</td><td>1684.6</td><td>2146.80</td></tr><tr><td>2011</td><td>2359.83</td><td>1569.70</td><td>1892.8</td><td>1364.80</td></tr><tr><td>2012</td><td>2016.52</td><td>1126.00</td><td>1017.7</td><td>1215.70</td></tr><tr><td>2013</td><td>2346.10</td><td>1070.40</td><td>1339.4</td><td>1369.70</td></tr><tr><td>2014</td><td>2138.03</td><td>825.60</td><td>980.4</td><td>1027.60</td></tr><tr><td>2015</td><td>2044.55</td><td>813.80</td><td>736.3</td><td>971.30</td></tr><tr><td>2016</td><td>2109.52</td><td>986.10</td><td>1581.2</td><td>986.90</td></tr><tr><td>2017</td><td>2185.27</td><td>1309.00</td><td>2096.2</td><td>1722.20</td></tr><tr><td>2018</td><td>2192.44</td><td>1022.90</td><td>1301.1</td><td>1124.70</td></tr><tr><td>2019</td><td>2021.07</td><td>1136.20</td><td>1448</td><td>976.90</td></tr><tr><td>2020</td><td>2326.52</td><td>1484.60</td><td>1939.4</td><td>1811.70</td></tr></table>
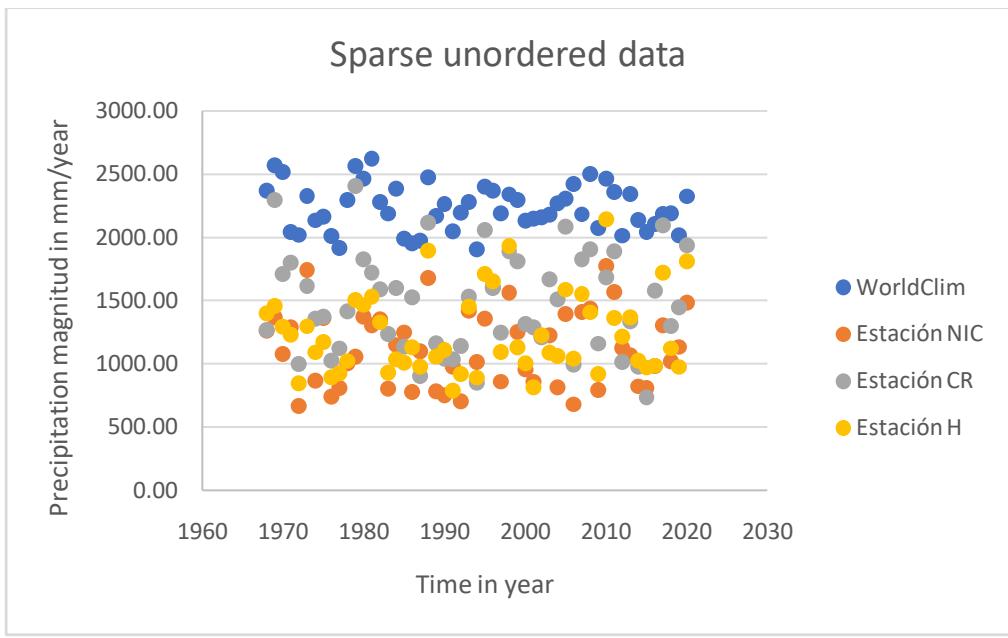 Figure 1: Behavior of Precipitation Data Over Time Without Manipulation
Note: figure created from the database From the data, from a series of 53 data, we continue to order them from lowest to highest and the correlation analysis technique is implemented, see Table 2.
Table 2: Sorted database
<table><tr><td rowspan="2">Year</td><td>WorldClim</td><td>Estation NIC</td><td>EstationCR</td><td>Estation H</td></tr><tr><td>Accumulated</td><td>Accumulated</td><td>Accumulated</td><td>Accumulated</td></tr><tr><td>1</td><td>2021.77</td><td>806.70</td><td>736.3</td><td>986.90</td></tr><tr><td>2</td><td>2043.23</td><td>812.70</td><td>851.9</td><td>1005.10</td></tr><tr><td>3</td><td>2044.55</td><td>813.80</td><td>905.2</td><td>1010.10</td></tr><tr><td>4</td><td>2052.21</td><td>819.20</td><td>980.4</td><td>1024.70</td></tr><tr><td>5</td><td>2052.70</td><td>824.20</td><td>993.5</td><td>1027.60</td></tr><tr><td>6</td><td>2078.57</td><td>825.60</td><td>1000.5</td><td>1036.20</td></tr><tr><td>7</td><td>2083.28</td><td>862.00</td><td>1017.7</td><td>1042.50</td></tr><tr><td>8</td><td>2109.52</td><td>862.40</td><td>1025.7</td><td>1059.40</td></tr><tr><td>9</td><td>2133.99</td><td>868.80</td><td>1039.4</td><td>1062.80</td></tr><tr><td>10</td><td>2137.27</td><td>878.20</td><td>1040.2</td><td>1065.20</td></tr><tr><td>11</td><td>2138.03</td><td>957.10</td><td>1124.4</td><td>1089.50</td></tr><tr><td>12</td><td>2149.15</td><td>964.80</td><td>1136.2</td><td>1091.80</td></tr><tr><td>13</td><td>2163.02</td><td>980.50</td><td>1143.5</td><td>1092.60</td></tr><tr><td>14</td><td>2168.22</td><td>986.10</td><td>1162</td><td>1096.40</td></tr><tr><td>15</td><td>2171.58</td><td>1008.10</td><td>1163.4</td><td>1111.70</td></tr><tr><td>16</td><td>2179.96</td><td>1018.90</td><td>1208.6</td><td>1116.40</td></tr><tr><td>17</td><td>2184.45</td><td>1022.90</td><td>1237</td><td>1124.70</td></tr><tr><td>18</td><td>2185.27</td><td>1058.70</td><td>1246.6</td><td>1130.50</td></tr><tr><td>19</td><td>2189.58</td><td>1070.40</td><td>1271.6</td><td>1132.80</td></tr><tr><td>20</td><td>2192.41</td><td>1082.00</td><td>1289.6</td><td>1136.70</td></tr><tr><td>21</td><td>2192.44</td><td>1102.80</td><td>1301.1</td><td>1139.80</td></tr><tr><td>22</td><td>2193.08</td><td>1126.00</td><td>1317.1</td><td>1156.70</td></tr><tr><td>23</td><td>2193.98</td><td>1136.20</td><td>1339.4</td><td>1175.20</td></tr><tr><td>24</td><td>2196.25</td><td>1151.90</td><td>1358.8</td><td>1215.70</td></tr><tr><td>25</td><td>2202.48</td><td>1209.80</td><td>1374.2</td><td>1227.80</td></tr><tr><td>26</td><td>2266.09</td><td>1224.60</td><td>1417.8</td><td>1231.60</td></tr><tr><td>27</td><td>2271.23</td><td>1229.60</td><td>1448</td><td>1294.80</td></tr><tr><td>28</td><td>2280.63</td><td>1251.90</td><td>1512.5</td><td>1299.10</td></tr><tr><td>29</td><td>2281.27</td><td>1253.90</td><td>1530.2</td><td>1319.30</td></tr><tr><td>30</td><td>2295.39</td><td>1266.60</td><td>1533.4</td><td>1331.00</td></tr><tr><td>31</td><td>2297.52</td><td>1293.40</td><td>1581.2</td><td>1364.80</td></tr><tr><td>32</td><td>2307.87</td><td>1306.10</td><td>1590.5</td><td>1365.00</td></tr><tr><td>33</td><td>2321.65</td><td>1309.00</td><td>1600.8</td><td>1401.90</td></tr><tr><td>34</td><td>2326.52</td><td>1320.10</td><td>1617.6</td><td>1410.20</td></tr><tr><td>35</td><td>2342.17</td><td>1360.20</td><td>1672.2</td><td>1422.10</td></tr><tr><td>36</td><td>2346.10</td><td>1365.00</td><td>1684.6</td><td>1456.70</td></tr><tr><td>37</td><td>2351.24</td><td>1368.50</td><td>1714.2</td><td>1458.30</td></tr><tr><td>38</td><td>2371.86</td><td>1383.60</td><td>1803.3</td><td>1507.10</td></tr><tr><td>40</td><td>2371.86</td><td>1383.60</td><td>1803.3</td><td>1507.10</td></tr><tr><td>41</td><td>2372.41</td><td>1395.10</td><td>1815.4</td><td>1530.60</td></tr><tr><td>42</td><td>2385.22</td><td>1411.90</td><td>1830.3</td><td>1535.10</td></tr><tr><td>43</td><td>2400.96</td><td>1420.00</td><td>1831.1</td><td>1556.00</td></tr><tr><td>44</td><td>2423.60</td><td>1420.50</td><td>1891.5</td><td>1589.10</td></tr><tr><td>45</td><td>2457.28</td><td>1437.60</td><td>1892.8</td><td>1638.90</td></tr><tr><td>46</td><td>2466.21</td><td>1439.50</td><td>1907.6</td><td>1644.10</td></tr><tr><td>47</td><td>2466.79</td><td>1484.60</td><td>1939.4</td><td>1655.20</td></tr><tr><td>48</td><td>2474.85</td><td>1569.70</td><td>2061.2</td><td>1715.10</td></tr><tr><td>50</td><td>2524.46</td><td>1679.60</td><td>2096.2</td><td>1888.80</td></tr><tr><td>52</td><td>2563.92</td><td>1742.90</td><td>2297</td><td>1933.70</td></tr><tr><td>53</td><td>2571.41</td><td>1775.90</td><td>2410.1</td><td>2146.80</td></tr></table>
The statistical analysis of correlation is conjugated from the variable Y as the dependent variable in this case the WorldClim data versus three independent variables in this case the data from the stations in Nicaragua, Costa Rica and Honduras. It starts from the following equation 1, see table 3.
$$
Y = b _ {0} + b _ {1} X _ {1} + b _ {2} X _ {2} + b _ {3} X _ {3} \mathrm {e q u a t i o n 1}
$$
Where:
$$
Y = WorldClim dependent variable
$$
$\mathsf{b}_0, \mathsf{b}_1, \mathsf{b}_2 =$ multipliers or correlation coefficient
$X_{1}, X_{2}, X_{3} =$ independent variables.
Table 3: Result of the combination of AND as Dependent Data WorldClim
<table><tr><td colspan="2">Regression Statistics</td></tr><tr><td>Multiple correlation coefficient</td><td>0.992616997</td></tr><tr><td>Determination coefficient R^2</td><td>0.985288502</td></tr><tr><td>R^2 adjusted</td><td>0.984387798</td></tr><tr><td>Typical error</td><td>18.51376303</td></tr><tr><td>Observations</td><td>53</td></tr><tr><td colspan="2">Coefficients</td></tr><tr><td>Interception</td><td>1692.141097</td></tr><tr><td>Variable X 1</td><td>0.070414031</td></tr><tr><td>Variable X 2</td><td>0.292750521</td></tr><tr><td>Variable X 3</td><td>0.045092026</td></tr></table>
Note: application of expression 1, the data was processed in Microsoft Excel In case two, the hypothesis of variables dependent on the data from the Nicaragua station is proposed, and the other databases as independent data. See table 4.
Where:
$$
Y = dependent variable Station Nicaragua
$$
$b_{0}, b_{1}, b_{2} =$ multipliers or correlation coefficient
$X_{1}, X_{2}, X_{3} =$ independent variables.
Table 4: Result of the Combination of Y as Dependent data Station Nicaragua
<table><tr><td colspan="2">Regression Statistics</td></tr><tr><td>Multiplecorrelationcoefficient</td><td>0.99080164</td></tr><tr><td>Determinationcoefficient R^2</td><td>0.9816879</td></tr><tr><td>R^2 adjusted</td><td>0.98056675</td></tr><tr><td>Typical error</td><td>36.6662142</td></tr><tr><td>Observations</td><td>53</td></tr><tr><td colspan="2">Coefficients</td></tr><tr><td>Interception</td><td>-212.430625</td></tr><tr><td>Variable X 1</td><td>0.27618618</td></tr><tr><td>Variable X 2</td><td>0.61337983</td></tr><tr><td>Variable X 3</td><td>-0.08863901</td></tr></table>
Note: application of expression 1, the data was processed in Microsoft Excel In case three, the hypothesis of dependent variables is proposed, the data from the Costa Rica station, and the other databases as independent data. See table 5.
Y = dependent variable Station Costa Rica
$b_{0}, b_{1}, b_{2} =$ multipliers or correlation coefficient
$X_{1}, X_{2}, X_{3} =$ independent variables.
Table 5: Result of the Combination of AND as Dependent Data Station Costa Rica
<table><tr><td colspan="2">Regression Statistics</td></tr><tr><td>Multiple correlation coefficient</td><td>0.996108937</td></tr><tr><td>Determination coefficient R^2</td><td>0.992233015</td></tr><tr><td>R^2 adjusted</td><td>0.991757485</td></tr><tr><td>Typical error</td><td>36.11292278</td></tr><tr><td>Observations</td><td>53</td></tr><tr><td colspan="2">Coefficients</td></tr><tr><td>Interception</td><td>-2136.585477</td></tr><tr><td>Variable X 1</td><td>0.595007754</td></tr><tr><td>Variable X 2</td><td>1.113867553</td></tr><tr><td>Variable X 3</td><td>0.279408289</td></tr></table>
Note: application of expression 1, the data was processed in Microsoft Excel
The last case proposes the hypothesis of variables dependent on the data from the Honduras station, and the other databases as independent data. See table 6.
Where:
$\mathsf{Y} =$ dependent variable Station Costa Rica $\mathsf{b}_0,\mathsf{b}_1,\mathsf{b}_2 =$ multipliers or correlation coefficient $X_{1},X_{2},X_{3} =$ independent variables.
Table 6: Result of the Combination of AND as Dependent Data Station Honduras
<table><tr><td colspan="2">Regression Statistics</td></tr><tr><td>Multiple correlation coefficient</td><td>0.980746102</td></tr><tr><td>Determination coefficient R^2</td><td>0.961862916</td></tr><tr><td>R^2 adjusted</td><td>0.959527993</td></tr><tr><td>Typical error</td><td>55.7493155</td></tr><tr><td>Observations</td><td>53</td></tr><tr><td colspan="2">Coefficients</td></tr><tr><td>Interception</td><td>-338.2848118</td></tr><tr><td>Variable X 1</td><td>0.408873935</td></tr><tr><td>Variable X 2</td><td>-0.204914086</td></tr><tr><td>Variable X 3</td><td>0.665875578</td></tr></table>
Note: application of expression 1, the data was processed in Microsoft Excel
Four possible combinations were produced, making Y the global data from WorldClim, the precipitation data from the Nicaragua station, the precipitation data from the Costa Rica station, and the precipitation data from the Honduras station, for each of the combinations made, an R2 correlation was obtained. fitted around 0.98, 0.98, 0.99, and 0.95 respectively, indicating a very precisely corrected measure of goodness-of-fit and that the model is collectively explained by all independent variables.
Regarding the typical error, a variation is observed for each of the combinations, which have the following magnitudes 18.51, 36.66, 36.11 and 55.74, this tells us how well the studied data fit, reaching a maximum value when deviating from the mean of the sample analyzed with respect to the mean of the total population.
Figures 2, 3, 4 and 5 can be seen to see the correlation trend.
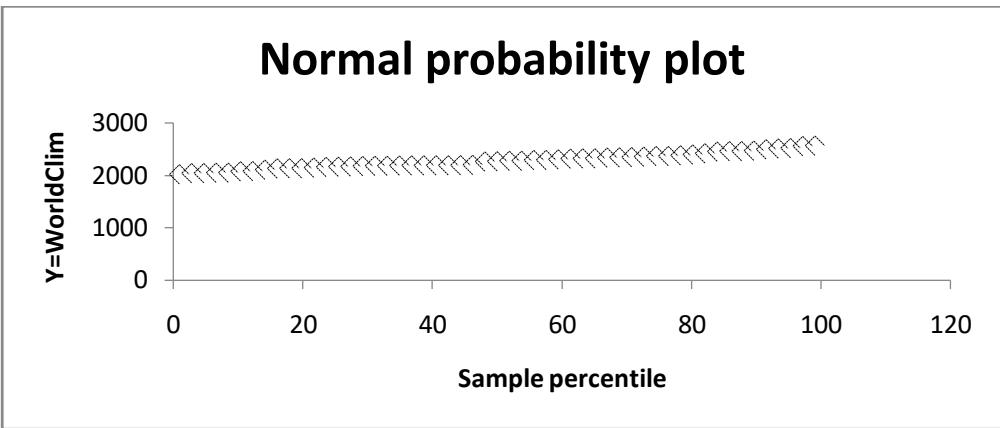
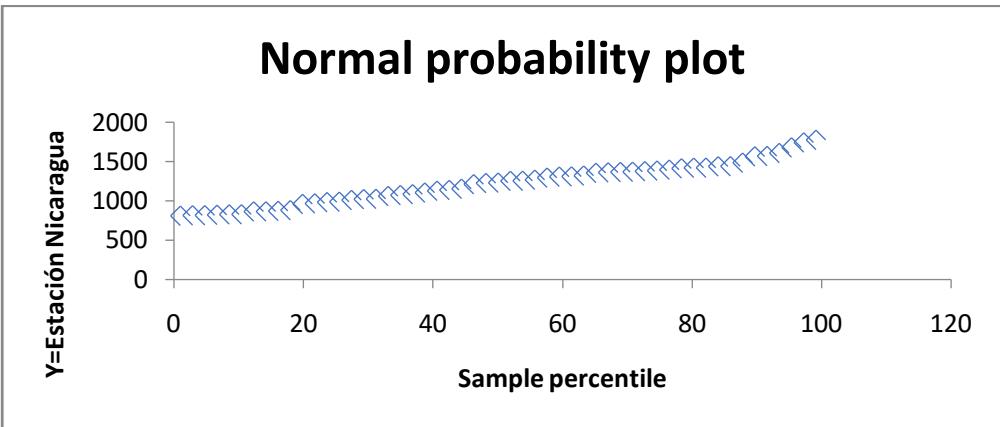 Figure 2: Behavior of the trend with the variable Y worldClim
Figure 3: Behavior of the Trend with the Variable Y Station Nicaragua
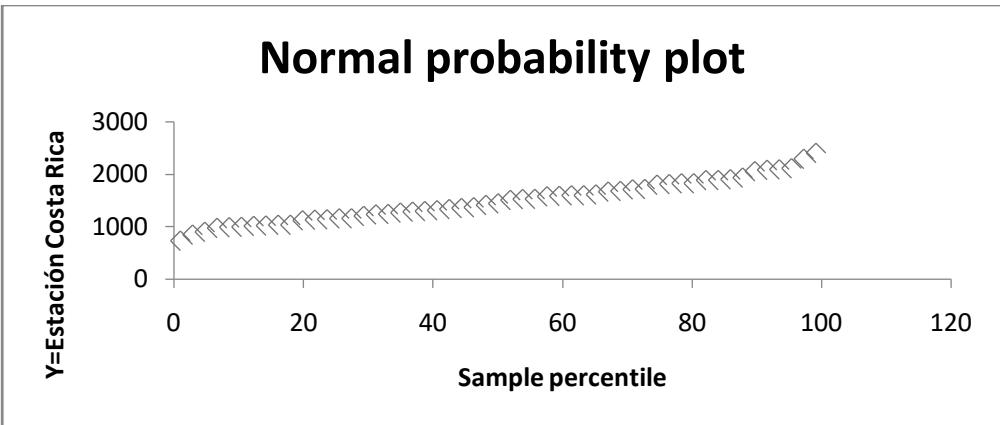 Figure 4: Behavior of the Trend with the Variable Y Station Costa Rica.
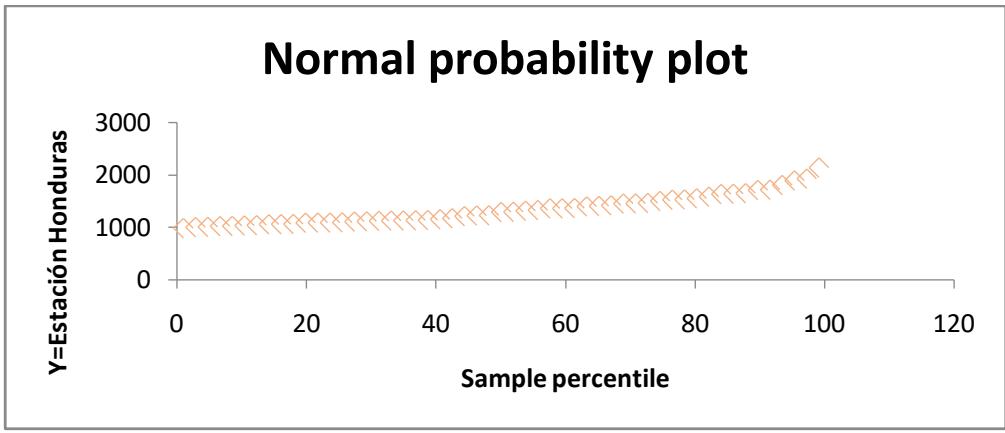 Figure 5: Behavior of the Trend with the Variable Y Station Honduras
The normal probability graphs for each of the combinations represent the behavior trend, its trend is linear. No variable momentum is observed that makes the data unscattered and maintains a strong correlation.
## VII. CONCLUSION
The analysis of the correlation of the historical precipitation variables of Nicaragua, Costa Rica, Honduras versus the global historical precipitation of WorldClim, produced four possible combinations using the multivariate statistical analysis technique of correlation analysis, where Y were the global data of WorldClim, the Nicaragua station data, the Costa Rica station data, and the Honduras station data, with correlation magnitudes of R2 098, 0.98, 0.99, and 0.95, respectively.
According to the results, the goodness-of-fit correlation measure indicates a lot of precision in the different combinations, and that the model is collectively explained by all the independent variables, being able to use the global historical data from WorldClim with two other random stations to be able to carry out a punctual hydrological analysis in the absence of information.
### Gratitude
First of all, to God, our father, who has given me a hand to continue on the right path and achieve my goals.
To my mother Beatrix Picado, for showing me the way to success.
To my sons Dafnedltziar Tirado Flores and Víctor Manuel Tirado Flores, I will always be their guide, to my grandson Ezio, welcome.
To my wife, Lisseth Carolina Blandón Chavarría, who trusts in my successes, thank you for being by my side.
To the American University (UAM) and the Directorate of Research and University Extension (DIEX), for opening the doors of knowledge in this new stage of my life.
Generating HTML Viewer...
References
5 Cites in Article
Cenaos (2023). Centro de Estudios Atmosféricos, Oceanográficos y Sísmicos.
I Entraigas,M Varni,M Gandini,E Usunoff (1996). Aplicación del análisis multivariado en el definción de regiones homogéneas de precipitación.
M García (2021). Conjunto de datos oceanográficos obtenido en monitoreo de calidad de aguas de la Bahía de Tumaco, Colombia. 2003.
H Sampieri,Fernández,C Collado,L Baptista (1999). Aplicación de análisis multivariado al campo de anomalías de precipitación en Centroamperica.
Worldclim (2023). Supplemental Information 3: Variables obtained from WorldClim v. 2.1..
No ethics committee approval was required for this article type.
Data Availability
Not applicable for this article.
How to Cite This Article
Victor Rogelio Tirado Picado. 2026. \u201cMultivariate Analysis of the Historical Precipitation of Nicaragua, Costa Rica, and Honduras with the Global Historical Precipitation from WorldClim.\u201d. Global Journal of Science Frontier Research - H: Environment & Environmental geology GJSFR-H Volume 23 (GJSFR Volume 23 Issue H3).
Explore published articles in an immersive Augmented Reality environment. Our platform converts research papers into interactive 3D books, allowing readers to view and interact with content using AR and VR compatible devices.
Your published article is automatically converted into a realistic 3D book. Flip through pages and read research papers in a more engaging and interactive format.
Our website is actively being updated, and changes may occur frequently. Please clear your browser cache if needed. For feedback or error reporting, please email [email protected]
Thank you for connecting with us. We will respond to you shortly.