Installing a phasor measurement unit (PMU) at each bus in the power system network is very costly. Thus, selecting the optimal PMU placement is essential to avoid the high cost of the PMU and its corresponding communication facilities. Most proposed efforts for the optimal PMU placement (OPP) considered only test systems without using any real systems which are more complicated. On the other hand, most researchers deal with the problem of PMU optimal placement as an optimization problem. Hence, solving the optimization problem may face difficulties such as the complicated analysis and the significant computational burden for the bulk large-scale networks. This paper proposed a method to identify the optimal PMU placement achieving full observability over the entire network while avoiding optimization difficulties. The proposed method is based on the Binary Particle Swarm Optimization (BPSO) technique and topological rules. The Omani power grid is utilized as a large-scale network to apply the proposed method. The OPP technique is carried out using DIgSILENT PowerFactory Programming language (DPL) and the results are validated on IEEE test systems, 14, 118 buses, and NE 39 bus.
## I. INTRODUCTION
The topic of optimal PMU (Phasor Measurement Unit) placement for a power system considering full observability is a critical aspect of ensuring the stability and reliability of the power grid. The PMU devices are mainly used for Wide Area Measurement (WAM) applications. Wide-area monitoring, Protection, and Control applications increased due to the growth of the Phasor Measurement Units (PMUs) in the electric network. PMUs provide an overview of the transient processes in the network by providing synchronously measured data of the voltage and current with high-speed rates up to 200Hz [1],[2]. Using the GPS, the data is generated with a common time reference with an accuracy of $1\mu s[3]$. In the past, PMUs were not widely used because of their high cost, however, nowadays it is common in the transmission network [4]. In terms of power protection applications, PMUs are mostly used on backup protection schemes, protection settings adaptation, and protection blocking [1].
The WAMS enables accurate measurements of the network parameters such as network impedances and conductor ratings. Moreover, it can be used for post-event analysis. In general, the main advantages of the WAMS are to provide real-time power system monitoring and to capture the power system dynamics where its applications can be divided into real-time applications, and offline applications [5]. For instance, state estimation (SE), model validation, protection, and closed-loop control are examples of the applications of WAMS [6].
The PMUs connected to any bus measure the voltage phasors and the current phasors of all the lines connected to that bus. Thus, PMUs installed in the system are expected to give a real-time view of the system as such measurements are to be used in the system monitoring, Protection, Automation, and Control (WAMPAC) applications. Thus, PMU should be in the system in such a way as to gain full system observability which means the availability of at least a single phasor voltage and current measurement at each system bus. However, for a such large network, placing a PMU on each bus of the network is not economical. As a result, it is essential to lower the cost of synchrophasor installation by minimizing the number of PMUs within the power network.
Hence, Optimal PMU Placement (OPP) is carried out to minimize the number of PMUs while maintaining full observability of the network. OPP is an optimization problem with the objective function of achieving complete system observability with a minimum number of PMUs [7,8].
As aforementioned, installing PMUs on every single bus provides redundant information which is good but not feasible due to several factors related to PMU device cost, installation cost, phasor data concentrator (PDC), communication infrastructure, upgrading of old substations, and PMU big data. In contrast, by installing PMUs at optimal buses only using OPP, it is possible to have complete network observability with minimum PMU devices [9].
Different conventional and non-conventional techniques are used to formulate OPP problems the most used techniques for OPP are linear programming (LP), particle swarm optimization (PSO), genetic algorithm (GA), and greedy search algorithm. A summary of different optimization techniques used in OPP is shown in Figure 1. Different objective functions, constraints, contingencies, and installation schemes are used in OPP problems [9].
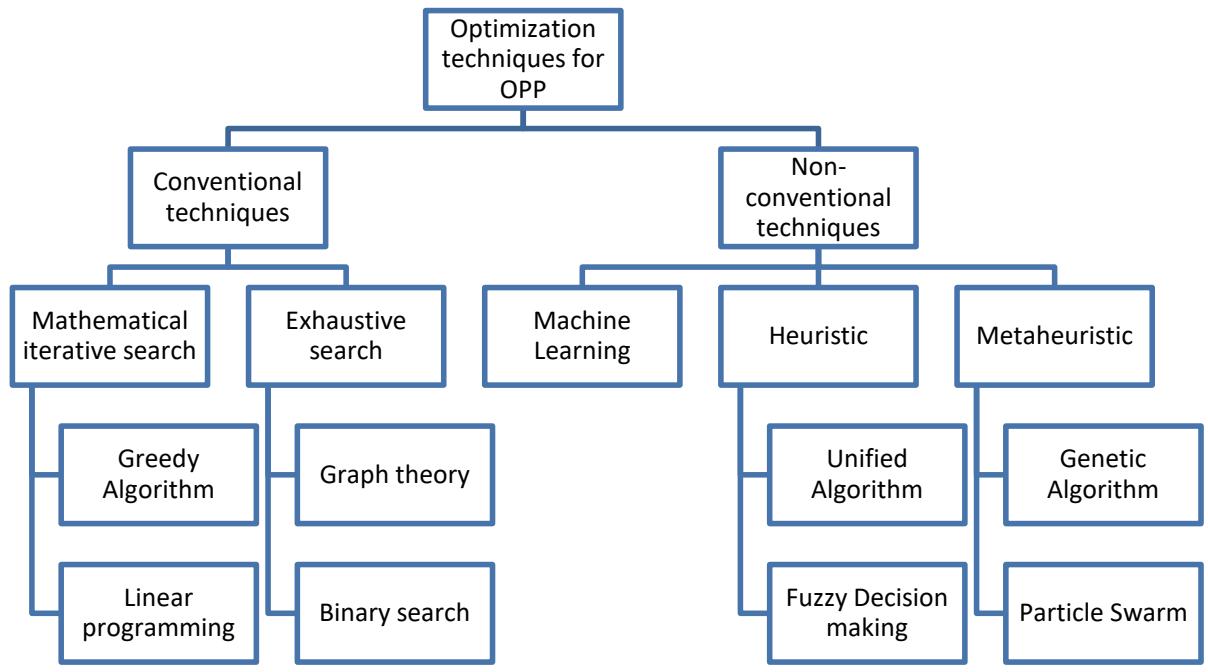 Figure 1: Some of the Optimization Techniques used in OPP [9]
Different optimization techniques with different benefits and drawbacks are used for OPP problems. For instance, in aiming for complete network observability, the linear programming technique is widely used because OPP is a linear problem in this case. However, for a nonlinear constraint, a linearization method is needed. Particle swarm optimization is easy to implement with more efficient control and fewer parameter adjustment problems. However, the computational time increases with the increased size of the solution. A genetic algorithm provides the best Pareto optimal solution instead of a single solution, but the execution time is long. The greedy search algorithm is good at providing the optimal local value with less computation, but it provides a global solution only in very few cases. Simulated annealing is good at giving complete observability as well as valuable dynamic data of the power system, but it takes a very high computation time. The artificial neural network provides many solutions that depend on the computational model but faces the problem of the complexity of network structure. In general, WAMS are increasingly needed to substitute SCADA systems as power networks become more unpredictable as a result of the integration of massive quantities of renewable energy. ILP, PSO, and GA are the more suitable techniques for solving OPP [9] [10] [11]. Different methods are presented in the literature for finding the minimum number and optimal placement of PMUs while making a power system fully observable. A new approach for OPP considering PMU loss and branch outages, maintaining observability during contingencies, is presented in reference [7]. Reference [12] presented optimal PMU placement using BPSO, aiming to achieve complete system observability with minimum PMUs and maximum measurement redundancy. The OPP is carried out using A modified BPSO algorithm is used for optimization. Improved topological observability analysis based on zero-injection buses is proposed. The integer linear programming technique is employed in reference [13] to solve the OPP problem. In this paper, a new integrated model is introduced to address the impact of zero injection buses (ZIBs) and conventional measurements on PMU placement. The proposed model takes into consideration the limitations caused by ZIBs, as well as two common contingencies: single branch outage and single PMU outage. Integer linear programming is used as an optimization tool to obtain the minimum number of PMUs in several references such as [14]-[17]. A modified Simulated Annealing (SA) algorithm is proposed in [18] with the consideration of the effect of the radial buses during the OPP problem. A placement set with the least number of PMUs and a higher system observability redundancy index is used to recognize the final placement group. OPP problems with Multiple optimal solutions are solved using the graph theory


algorithm in [19], [20]. Other algorithms such as Tabu search, Genetic Algorithm, Minimum Spanning Tree, and Greedy Algorithms are used for OPP such as in [21]–[23]. The majority of the OPP is carried out on standard test networks such as IEEE 14 bus, 39 bus, and 118 bus test systems. However, the authors in [24] propose a study on the Türkiye $400\mathrm{kV}$ Interconnected Power System. Two optimization techniques, Integer Linear Programming (ILP) and BPSO, are employed to determine the optimal locations and the number of PMU devices needed to monitor the entire system. Reference [25] proposed an algorithm through four stages: network fault simulation to obtain the post-fault change in voltage $(\Delta V)$ at each bus to build the network connectivity matrix, applying Pearson correlation coefficient, clustering the network into coherent zones, and PMU optimal locations are identified based on simple placement rules.
In this paper, PMU placement in the Omani power system is proposed by considering both full network observability and the cost of installing PMUs. The main objective of this paper is to determine the optimal locations for PMU installation in the Omani power system to improve the observability of the network and minimize the cost of PMU installation. The proposed approach is implemented and tested on the
Omani power system using simulated data. However, due to the relevance of WAM and wide area protection (WAP), OPP is carried out using one of the selected optimization techniques. The optimization has been carried out on DlgSILENT PowerFactory Programming language (DPL)).
The paper is organized as follows: Section 2 explains the phasor measurement techniques. Section 3 provides an overview of OPP problem formulation. Section 4 explains the methodology of the research and section 5 presents the Case Studies and Simulation Results. Finally, the conclusion in section 6.
## II. PHASOR MEASUREMENT TECHNIQUES
The PMU is a device that can measure the voltage and current phasors of the three-phase network with a reporting frequency of typically 10-120 values per second. PMUs come in a stand-alone device or as a function built-in on the protection relays. Some relay manufacturers such have made the PMU a standard feature in the relay since 2002, thus PMU functionality might exist in any existing network [26]. Table 1 shows the differences between the PMU-measured values and the conventional non-synchronized measurement of SCADA systems[2].
Table 1: Comparison of Synchrophasor and Conventional Measured Values [2]
<table><tr><td>Synchronphasors of the PMU</td><td>Measured Values from the Measuring Points (SCADA System)</td></tr><tr><td>Continuous updating measured values (high reporting rate).
• (Typically, 10-120 values per second)</td><td>Slow updating measured values (Slow reporting rate)
• (Typically, every 5 seconds)</td></tr><tr><td>Every measured value has a timestamp
(Synchronized measurement)</td><td>No timestamp for the measured values
(non-synchronized measurement)</td></tr><tr><td>Phasor values of current and voltage
(Amplitude and phase angle)</td><td>Only Amplitude
RMS values without phase angle</td></tr></table>
PMU measurements have a high precision timestamp and are transmitted to a central analysis station using standardized transmission protocol IEEE C37.118. The PMUs send the synchrophasor measurement in a continuous data stream to a station or a phasor data converter software.
All PMUs must follow a common standard to achieve interoperability among different PMUs. Different IEEE standards were issued regarding the accuracy, compatibility, and communication of PMUs. IEEE C37.118.1, Standard for Synchrophasor Measurements for Power Systems, has been updated several times since first issued in 2005. The updated version IEEE C37.118.1-2011 introduces several changes such as the addition of two performance classes, P class and M class where the P class is mainly for protection and control purposes, which requires fast response, minimum filtering, and minimum delay. On the other hand, the M class is used for measurements that require greater precision, and maximum filtering, and allow slower response and longer delay. Furthermore, in order to integrate PMUs with other communication protocols and to adapt synchrophasor measurements, the standard addresses real-time communication between PMUs, and other applications of synchrophasor networks such as power dispatching centers (PDCs). Moreover, IEEE and IEC worked on agreements that led to the creation of IEC TR 61850-90-5 which enables the use of IEC 61850 -communication protocols for intelligent electronic devices at electrical substations – to transmit synchrophasor information according to IEEE C37.118 [6].
The availability of the time stamp gives the possibility of the comparison between the measured values of other PMUs. It is possible to put the phasors of two signals that are miles apart on the same phasor diagram, by synchronizing their sampling processes, thus, allowing comparison and analysis. However, it is essential to have a source of accurate timing signals such as GPS in order to achieve a common timing reference for the synchrophasor acquisition process [6]. Nowadays, there are other systems like GPS such as Europe's GALILEO, Russia's Global Navigation Satellite System (GLONASS), and China's Beidou Navigation Satellite System. Moreover, fiber-optic systems can be used for synchronization, noting that the highest requirement for the accuracy of time synchronization in the power system is $1\mu s$ [6]. Synchronization accuracy is affected by a GPS timer and the precise correction of the time delay within the GPS receiver module, as well as by the optimal setup of the GPS antenna [2].
## III. OPTIMAL PMU PLACEMENT PROBLEM FORMULATION
The most common objective function used for OPP is minimizing the number of installed PMUs to minimize the cost and maximizing the redundancy by incorporating observability into the objective function.
$$
F _ {1} = \min \sum_ {i = 1} ^ {m} P _ {i} \times C _ {i} \quad 1
$$
Equation 3 shows the objective function of minimizing the number of PMUs where the variables $P_{i}$ and $C_{i}$ are the PMU device to be installed on bus i and the cost factor, respectively. Variable m is the total number of buses. $P_{i}$ is a binary decision variable that equals 1 if PMU P is installed on bus i and 0 if PMU P is not installed on bus i [8].
Equation 4 shows the objective function of maximizing the redundancy by incorporating observability in the objective function, where $O_{i}$ is the number of times bus $i$ is observed via installed PMUs [8].
$$
F _ {2} = \max \sum_ {i = 1} ^ {m} O _ {i}. \tag {2}
$$
However, both objective functions can be combined in a multi-objective problem.
Power system observability approaches can be classified as topological, numerical, or hybrid (combined topological and numerical) approaches with the most used constraint being topological observability [8].
$$
O = A X. \quad 3
$$
$$
O \geq u. 4
$$
Equations 5 and 6 give the complete topological observability of the network, under normal conditions. Where $O$ is the observability vector, $A$ is the connectivity matrix, with size $N \times N$, $X$ is a row vector of size $N \times 1$, and $u$ is a vector representing a bus observable by one PMU [8].
## IV. METHODOLOGY
In this section, the proposed approach for PMU placement is described, including the full observability analysis technique and the optimization algorithm used. Installing PMU at each system bus is not feasible. For a such big network like Oman Grid, OPP is carried out to minimize the number of PMUs while maintaining full observability of the network. The optimization is carried out in DlgSILENT Power Factory software using DlgSILENT Programming Language (DPL).
The algorithm could start by randomly selecting a set of potential PMU locations and evaluating the observability of the buses and the cost of PMU installation for each configuration. The algorithm would then use the results of this evaluation to guide the search for better PMU placement configurations in subsequent iterations.
In this paper, Binary Particle Swarm Optimization (BPSO) which is a PSO optimization technique in the binary domain, is used for solving the Optimal PMU Placement problem for the following reasons:
- Simplicity
- Fast convergence
- Approving results: PSO and BPSO are widely used for OPP problems and in general extensively used in power system optimization problems [8], [27].
Moreover, the proposed algorithm is tested and validated using different IEEE test systems, 14, 118, and NE 39 bus systems [28]. After that, it is applied to the Oman grid with the following assumptions:
- Low-voltage and medium-voltage buses are excluded from the evaluation process in order to limit the PMU installation on grid buses which are $132\mathrm{kV}$, $220\mathrm{kV}$, and $400\mathrm{kV}$ buses.
- Transformers with a secondary voltage of less than $132 \mathrm{kV}$ is assumed a load.
- No contingency is included in the optimization process.
- Normal operation of the system elements is assumed.
- The network observability is based on topological observability rules.
As mentioned above, network observability is assessed based on topological observability rules. There are several rules for network observability that help to minimize the number of PMUs needed for full system observability. Buses adjacent to the bus equipped with a PMU can have their voltage phasor and branch current values calculated using basic network analysis techniques. Thus, observability rules assume that the line impedance is known. Moreover, it should be noted, that a Zero-Injection Bus (ZIB), as depicted in Figure 4, is a terminology used to describe a bus in which its net power injection is zero. The Observability rules are [27], [29], [30]:
1. A bus that has a PMU installed on it will have its voltage phasor and all branches' currents injected to it measured.
2. The unmeasured voltage phasor at one end of the line can be calculated if the voltage and current phasors at another end of a line are measured.
3. The current phasor of a line can be calculated if the voltage phasors of both ends of a line are known.
4. If all line current phasors connected to a ZIB are known except one, then the current phasor of the unknown one can be calculated.
5. For unmeasured ZIB, If the voltage phasors of its adjacent buses are all known, then the voltage phasor of the ZIB can be obtained.
6. For a group of unmeasured ZIB(s) that is (are) adjacent to observable buses will be identified as observable by the node equation to obtain the voltage phasors.
 Figure 4: Zero-Injection Bus (ZIB) concept
### a) Binary Particle Swarm Optimization (BPSO)
PSO is a population-based optimization technique that uses initialization of the population of random solutions to give the optimal solution by updating the generations. BPSO is a form of PSO that uses the concepts of velocity and momentum from continuous PSO in a binary domain. BPSO or modified BPSO is widely used for PMU placement. BPSO algorithm evaluates the fitness of each particle in the search space with the objective function [7], [8].
The technique used in this work is basically PSO but transformed into binary one as shown in the following equations [27], [29].
$$
x_{p,i,j}^{itr} = P_best_{i,j}^{itr} \oplus x_{i,j}^{itr-1}.
$$
$$
x_{g,i,j}^{itr} = G_{best}_{i,j}^{itr} \oplus x_{i,j}^{itr-1}.
$$
$$
V_{i,j}^{itr} = c_1 \otimes x_{p,i,j}^{itr} + c_2 \otimes x_{g,i,j}^{itr}. \quad 7
$$
$$
\sum_{i=1}^{Nvar} V_{i,j}^{itr} \leq V_{j}^{max}. \tag{8}
$$
$$
x_{i,j}^{itr} = V_{i,j}^{itr} \oplus x_{i,j}^{itr-1}.
$$
$x_{i}$ represent the decision variable in the optimization, which - decision variables - is in this case, the number of targeted buses "Nvar". $j$ represents the particle of the population which depends on the selected population size. "itr" is the number of iterations of the optimization algorithm. $P\_best_{i,j}^{it}$ is personal best during each iteration for each particle and $G\_best_{i,j}^{it}$ is the global best position among all particles until iteration itr. $V_{i,j}^{it}$ is the velocity variable and $V_{j}^{max}$ is the maximum velocity. $\oplus$ and $\otimes$ represent binary XOR, and OR operations. $c_{1}$ and $c_{2}$ are binary numbers.
$V_{j}^{max}$ limits the velocity of particles in each iteration, so if $V_{j}^{max}$ is violated, the velocity is reduced to maximum velocity. Figure 2 shows a flowchart of BPSO implementation in DPL.
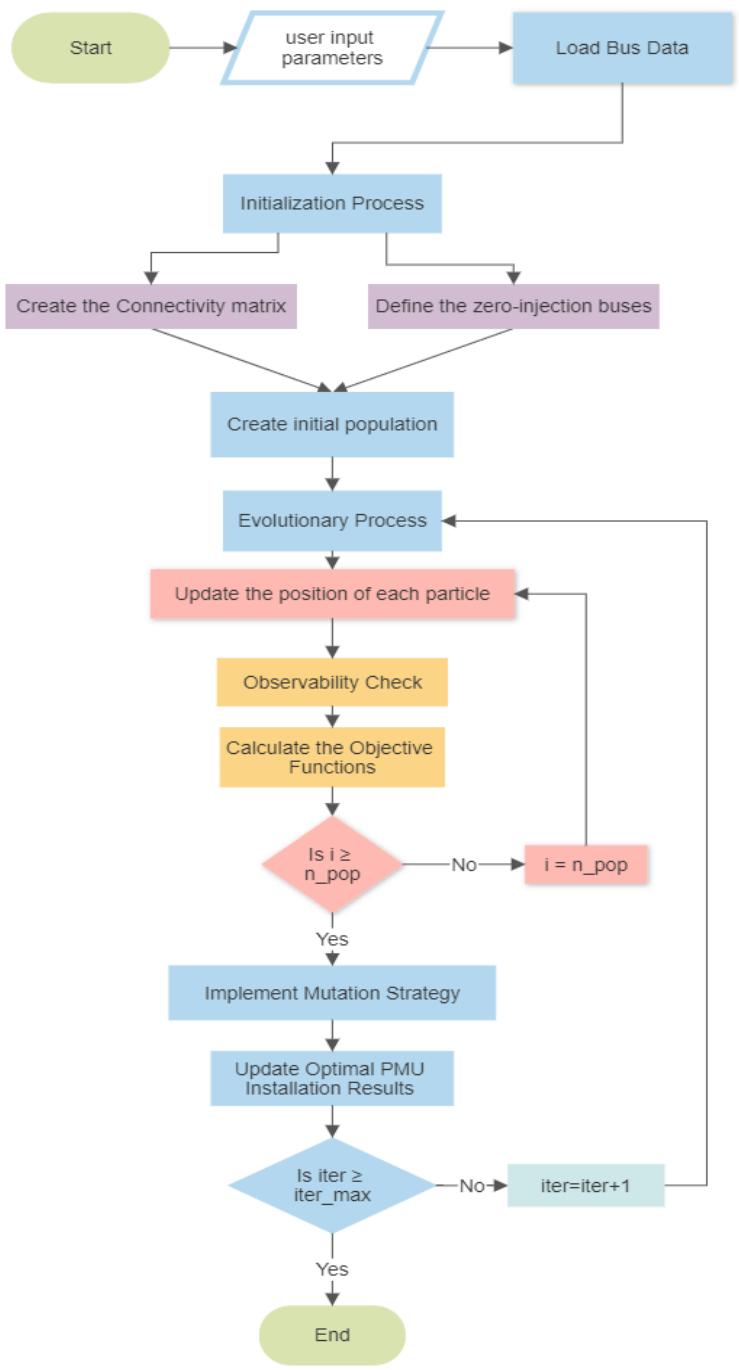 Figure 5: Flowchart of BPSO Implementation in DPL
At first, the number of candidate buses for PMU installation is determined by excluding all buses that are with voltage less than a predefined threshold voltage. These buses will be the decision variable for the optimization process.
After that, the initialization process is started as shown in Figure 4 where, the network connectivity matrix, and the Zero Injection Buses (ZIB) matrix, are generated. Next, an initial population of the BPSO is generated randomly with the initial velocity of each particle set to zero, and the probability of PMU installation in a bus is assumed to be less than $70\%$. Next, the fitness function which contains the objective function will be called for each particle. The particle with the best fitness function is saved in the global best matrix and the same will be updated sequentially in the evolutionary process [27]. This process is called the Initialization Process.
Next BPSO algorithm deploys an iterative evolutionary process to update the particles using the equation stated under "Binary Particle Swarm Optimization (BPSO)" and corresponding to the fitness function will be calculated for each particle [27].
BPSO such as other meta-heuristic techniques are suffering from premature convergence and entrapping in local optima. Thus, a Mutation Strategy is required to reach an optimal solution and avoid trapping in local optima.
The first part of the mutation strategy is a local search around the best population. In general, the mutation method tries to install the PMUs in different network buses randomly. The second part of the mutation strategy is a local search around each population. In this case, some variables of the solution will be changed or maintained randomly. Finally, the fitness function of the new solution is compared with the fitness function of the existing solution, the particle that provides the better fitness function will be kept [27].
The fitness function of the BPSO contains the objective functions of the optimization technique. The objective functions in such a case would be a summation of two evaluation functions which are the number of PMUs installed in the system and the system observability as given by the below equation [27][29]:
$$
f = c_1 * N_{PMU} + c_2 * N_{nobs} \dots \dots \dots \dots \dots \dots \dots \dots 10
$$
where $N_{PMU}$ and $N_{nobs}$ are the number of installed PMUs and the number of unobservable buses, respectively. $c_1$ and $c_2$ are constant coefficients (adjustable to control the contribution or balance between two evaluation functions.
In the simulations, the particle population size is selected as 100 for better results [31]. The iteration is 30. The coefficients of the objective function $c_2$ need to be higher than $c_1$ to give priority to the system's full observability above minimizing PMU numbers, hence the coefficients $c_1$ and $c_2$ are selected 1 and 2 respectively. The same is used in [29].
## V. CASE STUDIES AND SIMULATION RESULTS
In this section, the results of the proposed approach are presented, including the optimal PMU placement of Oman Grid and other test systems. Additionally, this section includes a result discussion, highlighting the key findings and the implications for power system operators and engineers.
### a) Simulation Results
The proposed PMU placement algorithm aims to provide optimal PMIU placement for the Oman Grid Network. However, to provide approved results, the algorithm is first tested on IEEE 14 and 118 bus test systems and 39 bus NE systems. The results of the simulation which are the identification of ZIB buses, and the optimal location of the PMU are shown in Table 2.
Table 2 shows a comparison of simulation results with other OPP methods available in the literature whether using BPSO or other optimization algorithms. The results are almost the same with minor changes in $\pm 1$ PMU. This state that the proposed optimization results are comparable to other published works. Approved based on the similarity of the results with other OPP methods. Moreover, Table 4 shows the location of the ZIB of the test systems in comparison with previous work by other researchers cited in the table. It is noted that the results of OPP show that the PMU placement is not a unique solution but most optimization will reach the same optimal number of PMUs with different arrangements. Looking into Oman Grid optimal PMU installation, the results show the need for 33 PMUs to achieve network full observability as shown in tables 2 and 4, which is less than $24\%$ of the system buses.
Table 2: Simulation Results Table 3: Comparison of Results Between Different Optimization Methods in Literature
<table><tr><td>Test system</td><td>No. of Buses</td><td>Location of Zero-Injection Buses (ZIB)</td><td>Number of ZIB</td><td>Optimal No. of PMUs</td><td>Optimal PMUs Location</td></tr><tr><td>IEEE 14-bus</td><td>14</td><td>7</td><td>1</td><td>3</td><td>2-6-9</td></tr><tr><td>NE 39-bus</td><td>39</td><td>1-2-5-6-9-10-11-13-14-17-19-22</td><td>12</td><td>8</td><td>8-13-16-18-20-23-25-29</td></tr><tr><td>IEEE 118-bus</td><td>118</td><td>5-9-30-37-38-63-64-68-71-81</td><td>10</td><td>29</td><td>3-10-11-12-19-21-27-31-32-36-40-43-46-49-52-56-62-65-72-75-77-80-85-86-91-94-101-105-110</td></tr><tr><td>Oman Grid</td><td>139</td><td>5-6-9-14-36-51-60-64-66-72-80-84-85-96-97-98-99-103-104-106-107-108-109-110-111-112-113-114-116-121-123-127-130-131-132-133-134-135-136-138</td><td>40</td><td>33</td><td>2-3-5-10-18-21-30-33-34-38-43-47-52-53-55-59-64-65-69-76-78-80-81-87-94-97-107-119-120-121-125-126-136</td></tr></table>
<table><tr><td>OPP method System</td><td>IEEE 14-bus</td><td>NE 39-bus</td><td>IEEE 118- bus</td></tr><tr><td>BPSO [23], [25]</td><td>3</td><td>8</td><td>28</td></tr><tr><td>Contingency constrained [7]</td><td>3</td><td>8</td><td>28</td></tr><tr><td>Dual search [7], [25]</td><td>3</td><td>N/A</td><td>29</td></tr><tr><td>Integer programming [25], [26]</td><td>3</td><td>8</td><td>28, 29</td></tr><tr><td>Genetic algorithm [7], [25]</td><td>3</td><td>N/A</td><td>29</td></tr><tr><td>Tabu search [7], [25]</td><td>3</td><td>10</td><td>N/A</td></tr><tr><td>Proposed method</td><td>3</td><td>8</td><td>29</td></tr></table>
Table 4: A comparison of Location of Zero-Injection Buses (ZIB) in Literature
<table><tr><td>System /Method</td><td>IEEE 14-bus</td><td>NE 39-bus</td><td>IEEE 118- bus</td></tr><tr><td>Proposed method</td><td>7</td><td>1-2-5-6-9-10-11-13-14-17-19-22</td><td>5-9-30-37-38-63-64-68-71-81</td></tr><tr><td>[23], [26]</td><td>7</td><td>1-2-5-6-9-10-11-13-14-17-19-22</td><td>5-9-30-37-38-63-64-68-71-81</td></tr></table>
Furthermore, the simulation shows, the existence of 40 ZIB in the Oman Network which makes sense since some stations are only step up or step down with no load or generation connected to them. Oman Grid has 139 buses, which is comparable to the 118 buses in the test system. Therefore, comparing the ratio of the optimal PMUs to the number of buses in both systems should produce results that are similar, but keep in mind that the installation of PMUs for full system observability depends not only on the number of buses but also on the number of ZIB and the network topology. However, the number of optimal PMUs to the number of buses, for 118 Bus system and Oman Grid are 0.24 and 0.23 respectively. Figure 3 illustrate the
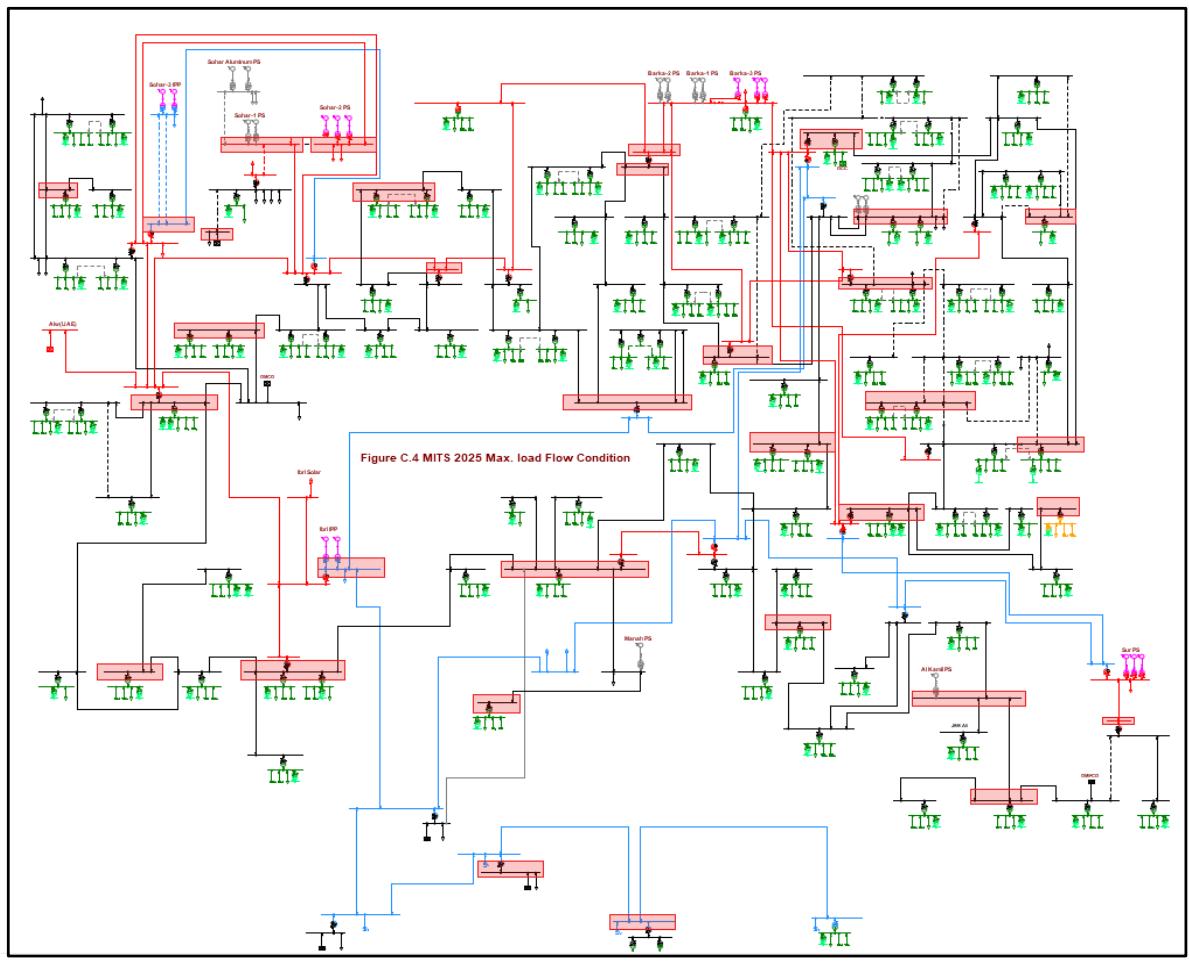
optimal number of PMUs in comparison with the full system buses. Figure 4 shows the optimal PMUs arrangement on the Oman Grid after considering all constraints.
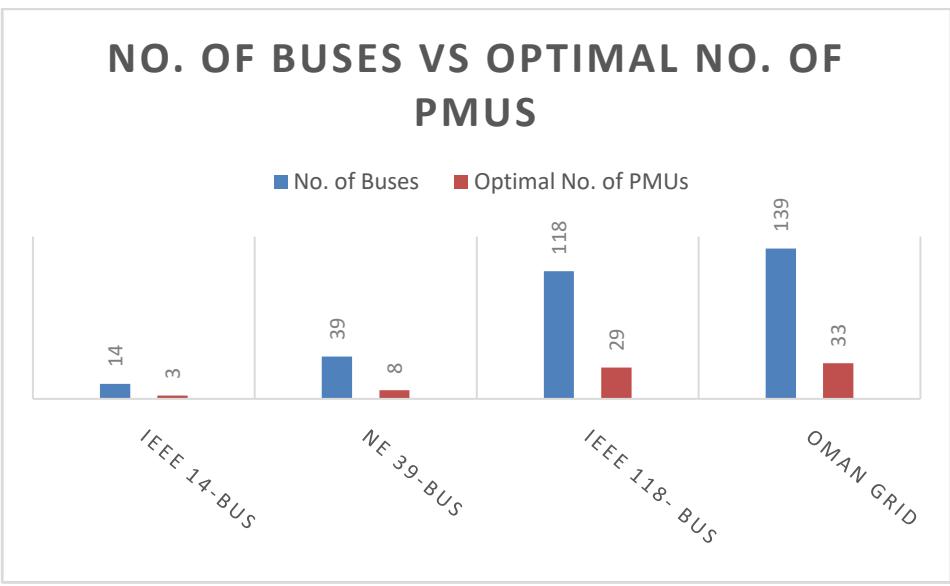
Figure 3: Number of Full System Buses vs Optimal Number of PMUs

Figure 4: Oman Grid Optimal PMUs Location, PMU Buses is Highlighted in Red

Figure 5 shows the objective function convergence which indicates the BPSO algorithm behaviour for Oman Grid compared with different IEEE system sizes, 14-bus, 39-bus and 118 bus systems. It also, with mentioning that the optimization process is an off-line procedure, so the convergence time is not of major importance considered.


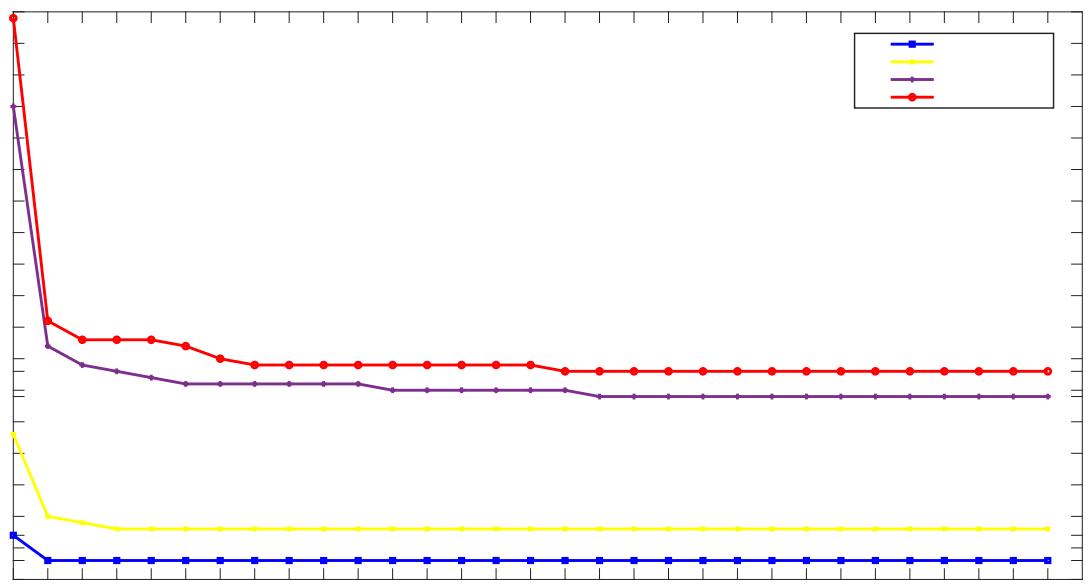 Figure 4: Objective Function Convergence
## VI. CONCLUSION
This section gives an optimal PMU placement for Oman Grid under full network observability consenting ZIB and topological observability rules. The proposed algorithm is based on the BPSO optimization technique and minimizing PMU number for full observability. Moreover, the algorithm utilizes the existing simulation of the Oman Grid in DlgSILENT PowerFactory software. The proposed algorithm shows approved results in comparison to other test system results in the literature. Oman grid simulation needs a minimum of 33 PMUs to achieve system full observability.
In conclusion, the optimization algorithm, using the network connectivity and the desired level of observability, as well as the cost of PMU installation, can help to determine the optimal PMU placement in the Oman transmission network, which is a combination of 400kV, 220kV, and 132kV buses.
### ACKNOWLEDGEMENT
The authors would like to acknowledge the support of the Sultan Qaboos University, the Ministry of Higher Education, Research and Innovation and Oman Electricity Transmission Company. This publication is a product of the project (RC/RG-ENG/ECED/19/03).
Generating HTML Viewer...
References
30 Cites in Article
Fangzhu Yu,Campbell Booth,Adam Dysko,Qiteng Hong (2019). Wide-area backup protection and protection performance analysis scheme using PMU data.
(2022). Phasor Measurement Unit.
Shalini,Subhransu Samantaray (2021). A Differential Voltage-Based Wide-Area Backup Protection Scheme for Transmission Network.
Ankush Saran (2013). Comparison between overcurrent relay and developed PMU based protection.
A Al-Maamari (2017). Strategic Development of Wide Area Monitoring On the Main Interconnected System in Oman.
Arun Phadke,Tianshu Bi (2018). Phasor measurement units, WAMS, and their applications in protection and control of power systems.
W Yuill,A Edwards,S Chowdhury,S Chowdhury (2011). Optimal PMU placement: A comprehensive literature review.
Muhammad Ahmed,Muhammad Amjad,Muhammad Qureshi,Kashif Imran,Zunaib Haider,Muhammad Khan (2022). A Critical Review of State-of-the-Art Optimal PMU Placement Techniques.
Amer Al-Hinai,Alireza Karami-Horestani,Hassan Alhelou (2023). A multi-objective optimal PMU placement considering fault-location topological observability of lengthy lines: A case study in OMAN grid.
Omar Abdalla,Hady Fayek (2023). WAMS-Based Fuzzy Logic PID Secondary Voltage Control of the Egyptian Grid.
T Menezes,P Barra,F Dizioli,V Lacerda,R Fernandes,D Coury (2023). A Survey on the Application of Phasor Measurement Units to the Protection of Transmission and Smart Distribution Systems.
Rohit Babu,Biplab Bhattacharyya (2015). Optimal placement of phasor measurement unit using binary particle swarm optimization in connected power network.
K Khajeh,E Bashar,A Rad,G Gharehpetian (2017). Integrated Model Considering Effects of Zero Injection Buses and Conventional Measurements on Optimal PMU Placement.
Muhammad Ahmed,Kashif Imran (2019). An Optimal PMU Placement Against N-1 Contingency of PMU Using Integer Linear Programming Approach.
Gaurav Khare,Nikhil Sahu,R Sunitha (2014). Optimal PMU placement using matrix modification based integer linear programming.
S Singh,S Singh (2014). Optimal PMU Placement in Power System Considering the Measurement Redundancy.
D Dua,S Dambhare,R Gajbhiye,S Soman (2008). Optimal Multistage Scheduling of PMU Placement: An ILP Approach.
Bishal Rimal,Nirmal Paudel,Aayush Bhattarai (2022). Optimal Placement of Phasor Measurement Units Ensuring Power System Observability.
Madhu Chejarla,Sailaja Matam (2021). Multiple Solutions for Optimal PMU Placement Using a Topology-Based Method.
Pronob Ghosh,Soumesh Chatterjee,Biman Saha Roy (2017). Optimal PMU placement solution: graph theory and MCDM‐based approach.
Jiangnan Peng,Yuanzhang Sun,H Wang (2006). Optimal PMU placement for full network observability using Tabu search algorithm.
M Devi,M Geethanjali (2020). Hybrid of Genetic Algorithm and Minimum Spanning Tree method for optimal PMU placements.
V Tran,H Zhang (2018). Optimal PMU Placement Using Modified Greedy Algorithm.
B Bozali,A Oztürk,S Tosun,B Hoş (2023). Optimal PMU Placement for Türkiye 400 kV Interconnected Power System Observability with Dragonfly Algorithm.
Moustafa Eissa,Amr Kassem (2018). Hierarchical Clustering based optimal PMU placement for power system fault observability.
Youmin Zhang (2012). Towards smarter, safer, more reliable and more resilient autonomous robotic systems.
F Gonzalez-Longatt,J Luis,R Torres (2018). Advanced Smart Grid Functionalities Based on PowerFactory.
Zuleika Dogson (2022). 2nd Test deposit Dec 10 2022.
M Hajian,A Ranjbar,T Amraee,A Shirani (2007). Optimal Placement of Phasor Measurement Units Particle Swarm Optimization Approach.
Nadia Rahman,Ahmed Zobaa (2016). Optimal PMU placement using topology transformation method in power systems.
No ethics committee approval was required for this article type.
Data Availability
Not applicable for this article.
How to Cite This Article
M. Al Maamari. 2026. \u201cOptimal PMU Placement for Transmission Power Systems Considering Full Network Observability\u201d. Global Journal of Research in Engineering - F: Electrical & Electronic GJRE-F Volume 23 (GJRE Volume 23 Issue F3): .
Explore published articles in an immersive Augmented Reality environment. Our platform converts research papers into interactive 3D books, allowing readers to view and interact with content using AR and VR compatible devices.
Your published article is automatically converted into a realistic 3D book. Flip through pages and read research papers in a more engaging and interactive format.
Installing a phasor measurement unit (PMU) at each bus in the power system network is very costly. Thus, selecting the optimal PMU placement is essential to avoid the high cost of the PMU and its corresponding communication facilities. Most proposed efforts for the optimal PMU placement (OPP) considered only test systems without using any real systems which are more complicated. On the other hand, most researchers deal with the problem of PMU optimal placement as an optimization problem. Hence, solving the optimization problem may face difficulties such as the complicated analysis and the significant computational burden for the bulk large-scale networks. This paper proposed a method to identify the optimal PMU placement achieving full observability over the entire network while avoiding optimization difficulties. The proposed method is based on the Binary Particle Swarm Optimization (BPSO) technique and topological rules. The Omani power grid is utilized as a large-scale network to apply the proposed method. The OPP technique is carried out using DIgSILENT PowerFactory Programming language (DPL) and the results are validated on IEEE test systems, 14, 118 buses, and NE 39 bus.
Our website is actively being updated, and changes may occur frequently. Please clear your browser cache if needed. For feedback or error reporting, please email [email protected]
Thank you for connecting with us. We will respond to you shortly.