I. INTRODUCTION
Poison ivy (a plant in the family Anacardiaceae, specifically Toxicodendron radicans) is well-known for causing bothersomersh and intense itching in sensitive individuals . The allergen in the plant causing the irritation, blistering, and inflammation has been documented as Urushiol (1, 2-benzenediol, 3-pentadactyl.). Touching the stem, root, or leaves of poison ivy results in direct skin contact with Urushiol oil, which causes itching. Urushiol is a lipophilic catechol with a 15 or 17 alkyl side chain either fully saturated or has 1-3 double bonds . A naming convention is usually adopted depending on the number of carbons and double bonds on the side chain. For example, a 15:0 indicates 15 carbon atoms with zero double bonds, and a 17:3 indicates 17 carbon atoms with three double bonds, etc. Structural activity studies have previously reported that the catechol ring and the side branching may be required for Urushiols' allergenicity. For example, the dimethylether derivative is not allergenic; however, Urushiol congeners with a higher degree of unsaturation in the side chain have higher allergenic potential . Sensitivity to Urushiol can develop anytime, and almost all parts of the human body are sensitive to the chemical.
High-performance liquid chromatography (HPLC) has a long history of operation in the reverse phase mode using a column and detectors such as UV, DAD, UV-DAD, fluorescence, or electrochemical detectors[7-11]. In cases where good separation is required, especially for separation and purification in natural product samples, techniques for the preparation of stationary phases may be required. Some investigations have utilized Urushiol as a stationary phase in an HPLC column to demonstrate good separation performance for studying natural product extracts[12]. Other analyses have used HPLC to separate, identify, and quantify lacquer saps containing catechol lipids[13]. An earlier approach by Yamauchi et al. has previously resolved the ten components in Japanese lacquer Urushiol by combining HPLC gel columns that utilize differences in the degree of unsaturation[14].
For identification purposes, mass spectrometry (MS) has long been used to decode organic structures . MS has been the most powerful detector for chromatographic systems, offering qualitative and quantitative information, providing high sensitivity, and distinguishing different substances with the same retention time. Liquid chromatography-mass spectrometry (LC-MS) can be a critical tool for guarding the safety of our food supply by monitoring toxic substances such as pesticide residues . The literature shows that the first chromatographic MS Urushiol analysis was a gas chromatography MS (GC-MS) analysis reported in . Draper et al. have employed HPLC/MS to determine Urushiol congeners . Urushiol was also identified in poison ivy without any sample preparation using leaf spray . MALDI mass spectrometry imaging (MALDI-MSI) was employed to analyze Urushiol in poison ivy stems. The result from the study indicates that the in situ localization of the Urushiol congeners with 15-carbon side chains is distinctly different from those with 17-carbon side chains in the stem tissue . Several other studies have investigated the HPLC-MS approach for analyzing Urushiol in different extracts .
Our study aims to develop, optimize, and validate an RP-HPLC method for determining Urushiol in poison ivy extract. We also aim to utilize ESI-MS to confirm the fragmentation patterns of Urushiol detected in the poison ivy extract. Our approach will be helpful for quality control authorities seeking to quantify active compounds in nutrition products.
II. EXPERIMENTAL SECTION
a) Materials and Reagent
Urushiol (15:2)CAS 83258-37-1 was purchased from MilliporeSigma (Atlanta, GA). HPLC water, LC-MS grade acetonitrile and methanol, and LC-MS optima formic acid were also purchased from Fisher Scientific LLC. The ESI tuning solution for the Advion CMS mass spectrometry was purchased from Agilent Technologies (Santa Clara, CA).
b) Poison Ivy Sample Pretreatment
Dried poison ivy on the train path behind the Wilveria Bass Atkinson Science Building on the Winston-Salem State University campus was ground in a mortar and pestle for approximately one minute, and was transferred into a clean KIMAX Kimble glass bottle. The sample was soaked in of methanol for three days. After the mixture was filtered with filter paper, all solvent was dried with a roto evaporator. The dried extract was weighed and dissolved in of methanol. The resulting solutions were then used to prepare of the sample. Solid-phase extraction (SPE) was used to clean the sample before analyzing it on an Agilent 1260 HPLC and Advionexpression CMS mass spectrometry (MS).
c) Urushiol Stock Solutions & Method Validation Studies
Stock solutions of the Urushiol (15:2) were prepared to 1000 ppm by accurately weighing 1 mg of analyte and dissolving in 1 mL ethanol. Subsequent serial dilutions from the stock using 9:1 were prepared between concentrations of 0.05 ppm to 150 ppm. Calibration studies were conducted by injecting three replicates of each concentration on the Agilent 1260 HPLC. Data from the calibration studies were used to determine method validation parameters. The method validation studies were conducted at 280 nm wavelength. A standard addition calibration curve corresponding to stock solutions of 0.1 to 150 ppm was generated to determine the content of Urushiol (15:2) in poison ivy extract.
d) Agilent 1260 LC & Advion CMS MS Instrumental Conditions
We analyze the poison ivyextract dissolved in methanol on an Agilent 1260 HPLC-DAD instrument and an Advion expression CMS MS. The experimental operating parameters developed on both instrumentations were published elsewhere .
HPLC conditions: Freshly prepared mobile phases (Solvent A; 0.1% Formic Acid in Water, Solvent B; 0.1% Formic Acid in Acetonitrile) were placed on the instrument weekly. The injection volume is , and the column temperature is . The mobile phase flow rate is . Hold at mobile phase A and mobile phase B for , then ramp to B over , ramp to B over the next , and hold at B for 0.01 min. Return to mobile phase A and mobile phase B over 2.89 min and hold for 3.0 min for re-equilibration. The total gradient program is 18.00 min long.
CMS MS: scan mode; CMS range, start m/z; 10.0 Da, end m/z; 600.0 Da, scan time; 1,000.0 ms, scan delay; 100 μs, delta background start time; 0, delta background end time; 10.0
III. RESULTS AND DISCUSSIONS
a) Agilent 1260 HPLC-DAD
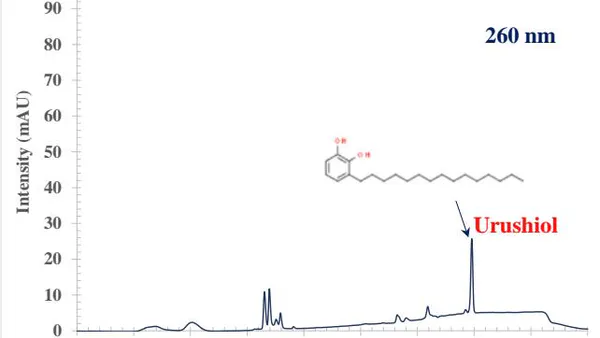
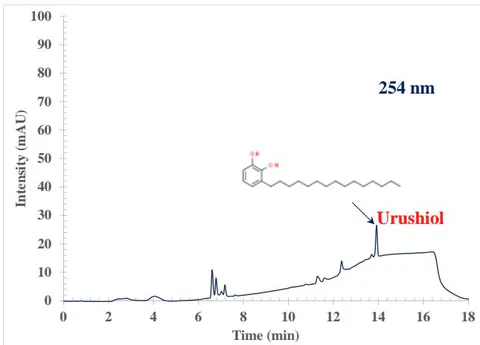
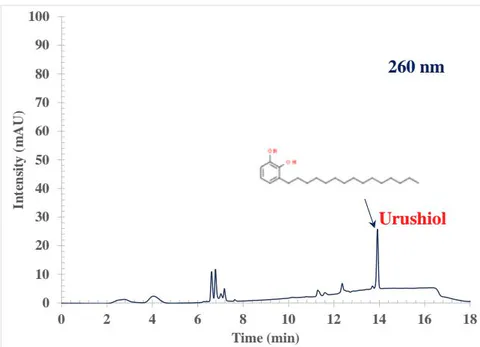
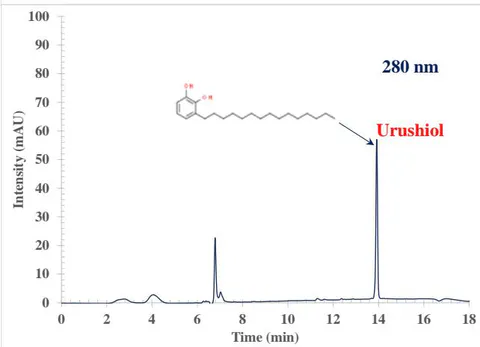
The high-performance liquid chromatography (HPLC) process involves forcing a high pressure through a closed column containing fine particles, resulting in a high-resolution separation . Two advantages consistently reported in the literature for HPLC are increased sensitivity and analysis without derivatization . The Agilent 1260 HPLC used in these studies consisted of an auto sampler, a solvent delivery system, a high-pressure chromatography column, and a DAD detector . The poison ivy sample was separated with a total run time of 18 min (including 1 min equilibration time), and the peaks were well resolved. Figure 1 shows example chromatograms of a poison ivy sample collected at 254, 260, and 280 nm, respectively. At 254 nm, the peaks detected distinct from the blank occurred at retention times, , , , , , , , and minutes. At 260 nm, the peaks detected distinct from the blank occurred at retention times, , , , , , , , and minutes. At 280 nm, the peaks detected distinct from the blank occurred at retention times, , , , , and minutes. At 280 nm, small signature peaks were seen between 6.138 and 6.558 minutes. That was due to the enhancement of the signal at 280 nm. The chromatographic behavior at the three wavelength studies was different. Above 6 minutes, the chromatographic baseline at 254 nm and 260 nm drifts to higher absorbance. That could be due to the acetonitrile contributing a higher absorbance at the lower wavelength of 254 nm and 260 nm during the gradient run. When the system returns to equilibration, the absorbance of acetonitrile drops back to the baseline. The same effect is seen at 260 nm but to a much lesser extent. At 280 nm, this effect disappears. Figure 1 shows that Urushiol gives a better response at the high wavelength of 280 nm. Most poison ivy contains an oil called Urushiol responsible for the allergic reaction to the plant. Using the Urushiol (15:2) pure standard, we confirmed that the peak at 13.91-13.92 minutes was the Urushiol (15:2) response in the poison ivy extract. With all peaks detected in the poison ivy extract fully resolved, the RP-HPLC with acetonitrile as the solvent used in this investigation demonstrated selectivity on conventional columns.
b) Advion Expression CMS MS
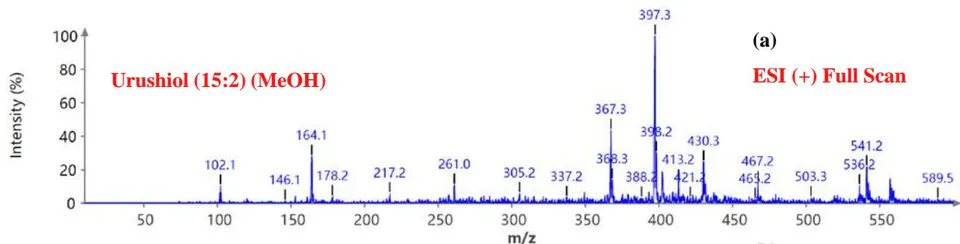
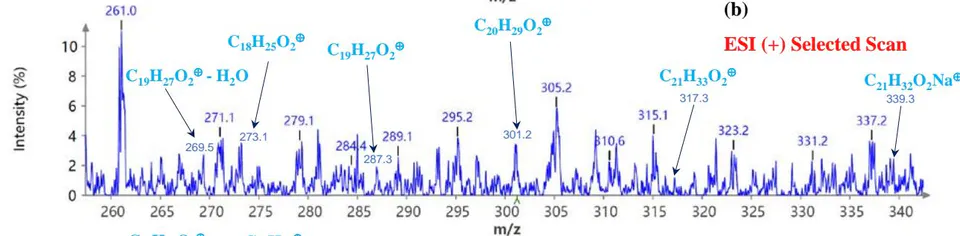
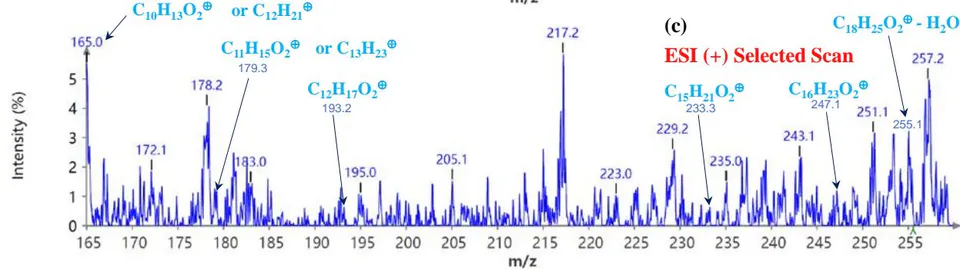
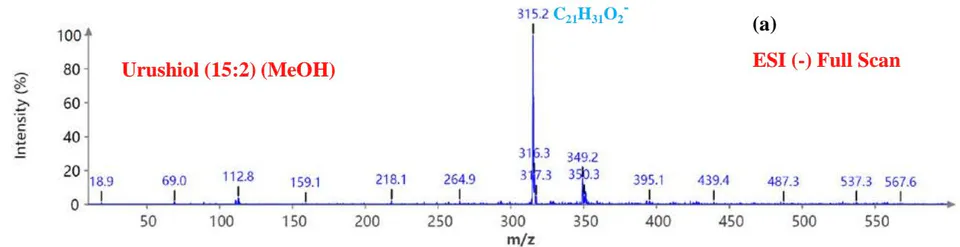
During the CMS MS studies, the instrument was attentively tuned daily in positive and negative ion detection modes. Masses identified for Urushiol-congenerin the poison ivy extracted with methanol are shown in Table 1. Figure 2 shows the structure of Urushiol (15:0, 15:1, and 15:2), demonstrating possible fragmentation sites. The pure standard we purchased from Millipore Sigma was Urushiol (15:2). The MS data shows several m/z detected for Urushiol (15:2), as shown in Table 1. The most critical masses that correspond to fragmentation from Urushiol (15:2) in the positive ion mode were 317.3 and 339.3, corresponding to the [M + H]+ (C21H33O2+) and [M + Na]+ (C21H32O2Na+) ions, respectively. Other fragmented ions include 123.4 (C7H7O2+ or C9H15+), 137.2 (C9H19O2+ or C10H17+), 151.1 (C9H11O2+ or C11H19+), 165.3 (C10H13O2+ or C12H21+), 179.3 (C11H15O2+), 193.3 (C12H17O2+), 233.3 (C15H21O2+), 247.1 (C16H23O2+), 273.1 (C18H25O2+), 287.3 (C19H27O2+), 299.3 (C21H31O+) and 301.2 (C22H29O+). The fragment observed at m/z 255.1 and 269.5 was attributed to fragments at 287.3 (C19H27O2+ - H2O) and 273.1 (C18H25O2+ - H2O) losing H2O. The base peak in the positive ion mode occurred at m/z 397.3, an unnamed peak. In the negative ion mode, the [M - H]− ion occurred at m/z 315.2 (C21H31O2−). Four other fragment ions of Urushiol (15:2) were observed at m/z 109.3 (C6H5O2− or C8H13−), 255.1 (C18H25O2− - H2O), 269.3 (C19H27O2− - H2O), and 299.3 (C21H31O−). The base peak in the negative ion mode was the C21H31O2−, at m/z 315.2. Figure 2 shows the mass spectra of Urushiol (15:2) pure standard in the positive ion mode. In Figure 3(a), we display the full scan mode spectra of the compounds, and in Figures 3(b and c), we display two zoomed-in selected scans that show how the fragments were mined in the data. Figure 4 shows the mass spectra of Urushiol pure standard in the negative ion mode. Identifying these fragments in Urushiol's (15:2) pure standard enabled us to elucidate poison ivy's full scan mode.
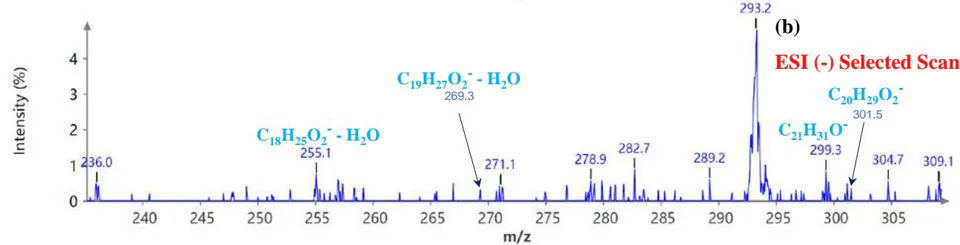
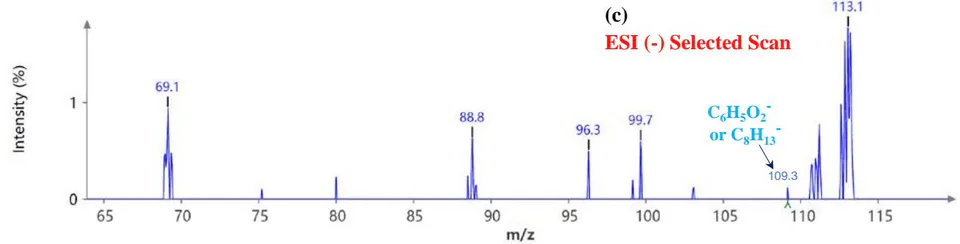
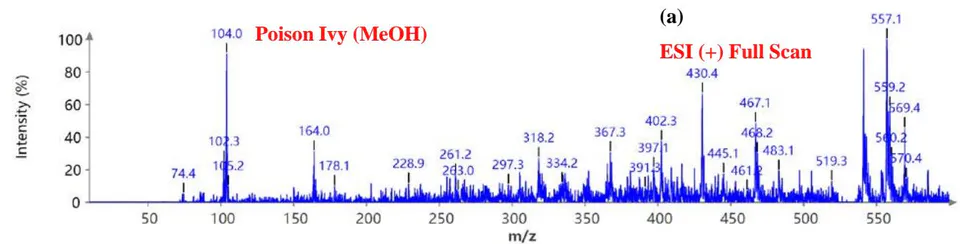
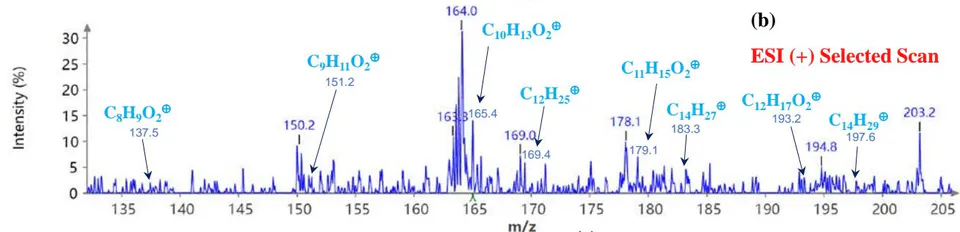
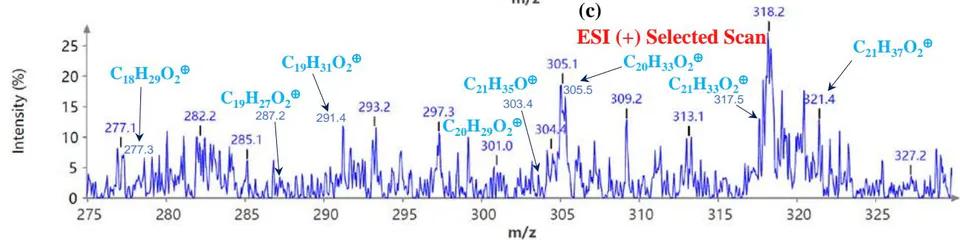
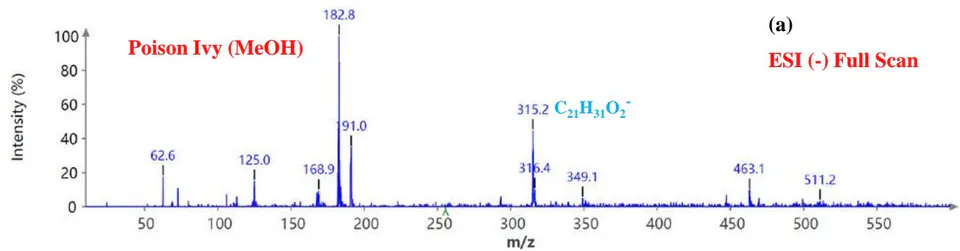
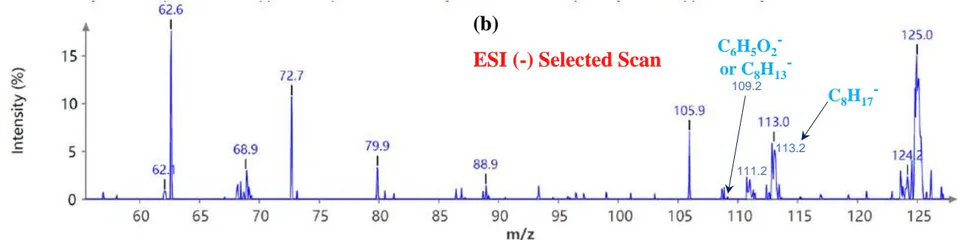
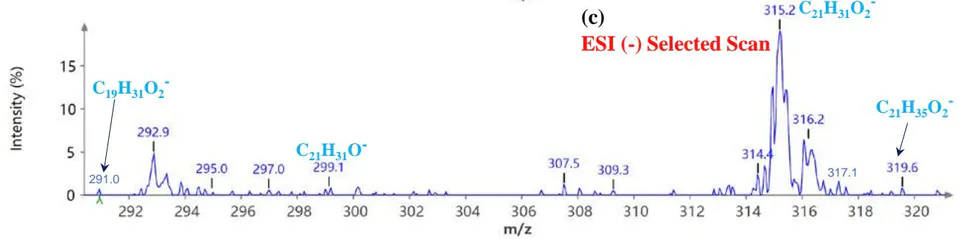
Figure 5(a) shows poison ivy's full scan mode mass spectra, whereas Figures 5(b and c) show selected scans of two data-mined spectra in the positive ion mode. Figure 6 shows the mass spectra of poison ivy in the negative ion mode. Note that the poison ivy HPLC chromatogram reveals several chromatographic signatures. This investigation focused on identifying the signature of Urushiol in poison ivy. Previous research reported seven Urushiol congeners in poison ivy ranging from C15:0-3 and C17:1-3 . We thus set out to mine the full scan mode mass spectra to reveal fragments that may be identical to the fragments identified to
Urushiol congeners previously reported in poison ivy. In the positive ion mode of poison ivy, a fragment at m/z 321.5 and 343.2 corresponded to the and ions, respectively, of Urushiol (15:0). The positive ion mode mass spectra reveal other fragments of 137.5 , 165.4 , 169.4 , 179.1 , 183.3 , 197.6 , 211.2 , 221.4 , 235.5 , 249.4 , 263.5 , 277.5 , 291.4 , 303.4 , and 305.5 . A fragment at m/z 273.5 was attributed to m/z 291.4 - losing . The base peak in the positive ion mode occurred at m/z 104.0, an unnamed peak. In the negative ion mode, the ion was small and occurred at m/z 319.6 . Four other fragment ions were observed in the negative ion mode of poison ivy, and these occurred at m/z 113.5 , 182.9 , 291.0 , and 303.3 . The base peak in the negative ion mode was also the at m/z 182.9. All these fragments confirmed the presence of Urushiol (15:0) congener in the poison ivy studied.
Mass and fragments for Urushiol (15:1) congener was also seen in the full scan mode mass spectra for poison ivy. In the positive ion mode of poison ivy, a fragment at m/z 319.1 and 341.4 corresponded to the and ions, respectively, of Urushiol (15:1). The positive ion mode mass spectra reveal other fragments of 123.2 , 137.5 , 151.2 , 165.4 , 179.1 , 193.2 , 195.3 , 233.3 , 247.9 , 261.2 , 275.5 , 289.5 , 301.0 , and 303.2 . A fragment at m/z 229.2 and 215.1 was attributed to fragments at m/z 247.9 and 233.3 losing . In the negative ion mode, the ion occurred at m/z 317.1 . Two other fragment ions were observed in the poison ivy's negative ion mode spectra, which occurred at m/z 109.2 , and 111.2 . These fragments correspond to fragmentation patterns found in Urushiol (15:1) congener.
The MS of poison ivy also indicates a strong presence of the Urushiol (15:2) congener. In the positive ion mode of poison ivy, a fragment at m/z 317.5 and 339.1 corresponded to the and ions, respectively, of Urushiol (15:2). Other fragmented ions include 123.2 or , 137.5 or , 151.2 or , 165.4 or , 179.1 , 193.2 , 233.3 , 247.1 , 273.2 , 287.2 , 299.3 and 301.0 , which were attributed to fragments at m/z 287.2 and 273.2
losing . In the negative ion mode, the ion occurred at m/z 315.2 . Four other fragment ions of Urushiol (15:2) congener in poison ivy was observed in the negative ion mode, and these occurred at m/z 109.2 or , 255.4 , 269.3 , and 299.3 . From all the fragment signatures identified compared to the pure Urushiol (15:2) standard, we can conclude that the identity of the peak in the HPLC profile between 13.91-13.92 minutes was Urushiol (15:2), one of the congeners responsible for the itching behavior of poison ivy.
Few signatures were observed in the MS that could be assigned to Urushiol (15:3) congener. However, many features exist in the MS, including the and , that could confirm the presence of Urushiol (17:1-3) congeners.
c) Method Validation Studies (Agilent 1260 HPLC-DAD)
The Urushiol (15:2) was purchased as a solid. Method validation studies typically utilize calibrations involving blanks and known standard concentration preparation. In this investigation, the blank was a solution containing all reagents and solvents used in the analysis with no deliberate added Urushiol (15:2). The blank used in this investigation for preparing all samples has the following ratio: 90:10 methanol: DI . We initially conducted percent recovery studies to ensure standards were being prepared accurately. A 2 ppm unspiked sample of Urushiol (15:2) was used to design the experiment and calculate standard recoveries. Spikes of 5 ppm (STD-1), 10 ppm (STD-2), 20 ppm (STD-3), and 150 ppm (STD-4) were added to each 2 ppm unspiked sample. The calibration study is shown in Table 2. Triplicate measurements were recorded for each peak area indicated in Table 2; thus, the data shown is the average of the three measurements. The percent recovery for each spiked sample was calculated using eq. 1.
The data shows an excellent recovery of within was obtained for each prepared concentration spiked on a 2 ppm Urushiol (15:2) sample, indicating that samples were prepared well and the instrument was functioning correctly.
Table 3 summarizes the calibration response data for Urushiol (15:2) investigated at . The calibration plot enables us to determine slope, intercept, correlation coefficient values, the limit of detection (LOD), and the limit of quantitation (LOD). We determine the LOD and LOQ by injecting replicate runs of the minimum detectable concentration of Urushiol. Each of the minimum Urushiol concentrations was discernable from the instrument noise. The LOD and LOQ were reported at ppb and ppb, respectively, with a sensitivity of mAU ppb . The value was 0.9998. (see Table 3).
The standard addition calibration method was applied to the Urushiol detected in the poison ivy methanol extract. The total content of Urushiol (15:2) detected in of poison ivy was of sample. One leaf of typical poison ivy weighs . This weight of poison ivy leaf is expected to contain of Urushiol (15:2).
IV. CONCLUSIONS
We report an improved RP-HPLC method for determining Urushiol (15:2) (1,2-benzenediol, 3-pentadactyl-) in poison ivy extract using a Luna 3u column. The HPLC chromatogram revealed other unidentified signature peaks. The mass spectra data show most of the fragmentation patterns of the Urushiol detected in the poison ivy extract. The validation indicates that the HPLC method is repeatable, reproducible, and sensitive. This method showed a successful optimization and validation, and Urushiol can be determined in the matrix of the poison ivy extract using the standard addition calibration method. The approach presents several advantages, including separation, identification, and improved chromatographic efficiency. It further shows the quantitation of Urushiol in complex mixtures. This same approach can be beneficial for analyzing other chemical components in food and different complex matrices.
ACKNOWLEDGMENTS
We gratefully acknowledge the support from the National Science Foundation (award no: 1900124, completed in September 2022) and the Intelligence Community Center of Academic Excellence (award no: HHM402-19-1-0007).
Boswell, P.G., Stoll, D.R., Carr, P.W., Nagel, M.L., Vitha, M.F., and Mabbott, GA (2013). An Advanced Interactive High-Performance Liquid Chromatography Simulator and Instructor Resources. J. Chem. Educ. 90: 198-202. doi: 10.1021/ed300117b.
Manousi, N., Tzanavaras, P. D., Zacharis, C.K. (2020). Bioanalytical HPLC Applications of In-Tube Solid Phase Microextraction: A Two-Decade
Nikolin, B., Imamović, B., Medanhodžić-Vuk, S., Sober, M. (2004). High-Performance Liquid Chromatography in Pharmaceutical Analyses. Bosn. J. of Basic Med. Sci. 4: 5-9. doi:10.17305/bjbms.2004.3405.
Harris, D.C. (2016). Quantitative Chemical Analysis. 9th Ed., New York, U.S.A: W. H. Freeman & Company, 678 p.
| Urushiol Pure Standard [15:2](MeOH) | |
| (+) m/z identified on Advion | 123.4, 137.2, 151.1, 165.3, 179.3, 193.3, 233.3, 247.1, 255.1, |
| CMS MS | 269.5, 273.1, 287.3, 299.3, 301.2, 317.3, 339.3 |
| (-) m/z identified on Advion | 109.3, 255.1, 269.3, 299.3, 315.2 |
| CMS MS | |
| Poison lvy (MeOH), m/z identified for Urushiol 15:0 | |
| (+) m/z identified on Advion | 137.5, 165.4, 169.4, 179.1, 183.3, 197.6, 211.2, 221.4, 235.5, |
| CMS MS | 249.4, 263.3, 273.5, 277.5, 291.4, 303.4, 305.5, 321.4, 343.2 |
| (-) m/z identified on Advion | 113.5, 182.9, 291.0, 303.3, 319.6 |
| CMS MS | |
| Poison lvy (MeOH), m/z identified for Urushiol 15:1 | |
| (+) m/z identified on Advion | 123.2, 137.5, 151.2, 165.4, 179.1, 193.2, 195.3, 215.1, 229.2, |
| CMS MS | 233.3, 247.9, 261.2, 275.5, 289.5, 301.0, 303.2, 319.1, 341.4 |
| (-) m/z identified on Advion | 109.2, 111.2, 317.1 |
| CMS MS | |
| Poison lvy (MeOH), m/z identified for Urushiol 15:2 | |
| (+) m/z identified on Advion | 123.2, 137.5, 151.2, 165.4, 179.1, 193.2, 233.3, 247.1, 255.2, |
| CMS MS | 269.2, 273.2, 287.2, 299.3, 301.0, 317.5, 339.1 |
| (-) m/z identified on Advion | 109.2, 255.4, 269.3, 299.3, 315.2 |
| CMS MS | |
| Standard Name | Peak Areaa (unspikedsample)b | Peak Area (added) | Peak Area (spiked sample) | % Recovery |
| Blank | 0 | 0 | 0 | NAd |
| STD-1 | 16.9968 | 42.1167 | 58.2645 | 98.0 |
| STD-2 | 17.1431 | 82.4076 | 98.9049 | 99.2 |
| STD-3 | 17.3241 | 254.8777 | 271.0746 | 99.6 |
| STD-4 | 16.8142 | 1682.7880 | 1700.0839 | 100.0 |
| Analyte | B1/ppm | Bo | R2 | LOD/ppb | LOQ/ppb |
| Urushiol | 0.110 ± 0.002 | 0.493 ± 0.003 | 0.9998 | 0.29 ± 0.03 | 0.97 ± 0.01 |
The following equation gives the calibration summary for the Urushiol response:
where is the intercept or noise, and is the sensitivity or slope.
Urushiol (15:0) [1,2-benzenediol, 3-pentadecyl-]
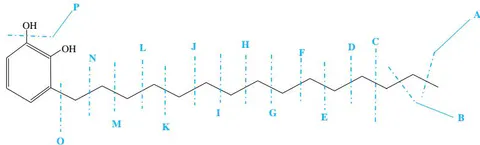
- 15.1 or - 305.4
- 127.1 or - 193.4
- 29.1 or - 291.4
or
- 43.1 or - 277.4
- 155.1 or - 165.4
- 57.1 or - 263.4
or
- 71.1 or - 249.4
- 183.1 or - 137.4
or
- 197.1 or - 123.4
- 99.1 or - 221.4
or
- 113.1 or - 207.4
- 17.1 or - 303.4
Urushiol (15:1) [3-(8Z-pentadecyl)-1,2-benzenediol] , 318.26 g/mole)
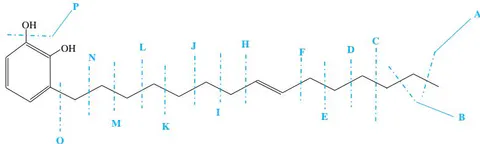
- 15.1 or - 303.3
- 121.1 or - 193.3
- 29.1 or - 289.3
- 139.1 or - 179.3
- 43.1 or - 275.3
or - 165.3
- 57.1 or - 261.4
or
or 247.3
181.1 or - 137.3
- 85.1 or - 233.3
- 195.1 or - 123.3
- 111.1 or - 207.3
- 209.1 or - 109.3
-17.1 or - 301.3
Urushiol (15:2) [3-(8Z-11Z-pentadecyl)-1,2-benzenediol]
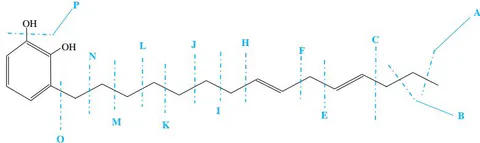
- 15.1 or - 301.3
- 123.1 or - 193.3
- 29.1 or - 287.3
- 137.1 or 179.3
- 43.1 or - 273.3
or - 165.3
- 69.1 or - 247.3
or
83.1 or -233.3
- 179.1 or - 137.3
- 109.1 or 207.3
- 193.1 or - 123.3
- 207.1 or - 109.3
-17.1 or -299.3