Power systems serve social communities that consist of residential, commercial, and industrial customers. The social behavior and degree of collaboration of all stakeholders, such as consumers, prosumers, and utilities, affect the level of preparedness, mitigation, recovery, adaptability, and, thus, power system resilience. Nonetheless, the literature pays scant attention to stakeholders’ social characteristics and collaborative efforts when confronted with a disaster and views the problem solely as a cyber-physical system. However, power system resilience, which is not a standalone discipline, is inherently a cyber-physical social problem, making it complex to address. To this end, in this paper we develop a socio-technical power system resilience model based on neuroscience, social science, and psychological theories and using the threshold model to simulate the behavior of power system stakeholders during a disaster.
## I. INTRODUCTION
The 2021 winter storm in Texas, which included three severe storms between 10 and 20 February, resulted in widespread power generation failure and blackouts. As a result, over 4.5 million homes and businesses lost power, leaving them without heat, water, or food for several days. Remarkably, during the storms numerous grocery stores have closed and some critical loads, such as hospitals, were short of electricity while experiencing power outages. Thus, the 2021 Texas power crisis had a detrimental effect on people's mental and physical health, resulting in a wave of widespread anger. On the other hand, because the power system managed by the Energy Reliability Council of Texas (ERCOT) is disconnected from the US Eastern and
Western interconnections, importing power from these interconnections was impossible during the winter storm. ERCOT issued bills to customers as high as $17,000 for less than a month of service, compared to prestorm prices of less than$ 60 per month. The power outages and high electricity prices were exacerbated by a lack of cooperation and empathy and inadequate winterization of the power infrastructure. This example demonstrates the effect of cooperation on the resilience of the power system.
A power system is inextricably linked to the social communities it serves. Indeed, making a power system resilient requires that all stakeholders, e.g., utilities, consumers, and prosumers, work together. The ultimate goal of the power system is to balance supply and demand. With the advent of the Internet and the energy of things, consumers can play a critical role in achieving the grid's objectives and assisting the generation side in increasing its operational efficiency, reliability, and resilience. For instance, the consumers may take an active role in demand management by reducing their consumption during disasters. Additionally, prosumers may store their electricity for use during times of peak demand, support critical loads, and share it with their neighbors during power outages. End-users willingness to assist the power utilities during and in the aftermath of a disaster is contingent upon their satisfaction and cooperation. Without collaboration, a power system may struggle to respond to and recover from a disaster as it was the case of the 2021 Texas winter storm. In the literature, a number of papers have proposed a variety of models for power system resilience. Although there are papers that discuss the effect of social factors on resilience, they have not modeled these social factors. The mathematical models focus exclusively on the cyber-physical aspects while ignoring the social aspects of resilience. Mili [1] elucidates the concept of the resilience of a power system and discusses its robustness, stability, reliability, and homeostasis. Panteli et al. [2] define operational metrics for power system resilience from an infrastructure perspective. Watson et al. [3] and Panteli et al. [4] provide an event-based fragility model for the electric grid's components in order to assess the vulnerability of the critical components to extreme events. To enhance power system resilience, Huang et al. [5] propose to integrate in the power system model generation re-dispatch, load shedding, and topology switching; Ma et al. [6] develop a model for backup distributed generators and automatic switches; and Mili et al. [7] and Panteli et al. [8] propose to utilize adaptive islanding.
Obviously, all the papers in the literature overlook the importance of mathematical modeling of the social component of power system resilience since they view the latter as a cyber-physical system, not as a cyber-physical-social system. The primary reasons for this lack of attention is the complexity of modeling the social component of power systems. To overcome this weakness, in this paper we present a socio-technical framework for modeling output-oriented power system resilience. To do so, we consider and model the behavior of consumers, prosumers, and utilities through the lens of computational social science. Additionally, we quantify socio-technical resilience characteristics for cross-validation purposes. Specifically, we propose a new method for assessing the social behaviors of power system stakeholders and then we calibrate and validate that model by extracting the social behavior characteristics from large-scale data sets, such as Twitter, while using the natural language processing and the text mining techniques.
The Main Contributions of the Paper are as follows:
- We propose a socio-technical model for power system resilience that leverages social science theories and computational social science to model the social behaviors of consumers, prosumers, and utilities during times of crisis. The proposed multi-agent-based model has the potential to be beneficial for detecting emergent patterns.
- We develop a new method to assess the consumer and presumed social behavior through the use of Natural Language Processing (NLP) and language psychology analysis tools, such as Linguistic Inquiry and Word Count (LIWC), as well as new approaches used in contemporary social science.
- We propose to use the threshold model based on the logistic function to consider the interdependence between socio-technical resilience-related features. This model is based on the theory of morphic resonance and formative causation initiated by Sheldrake [9].
- We investigate the impact of Hurricanes Irma and Harvey on socio-technical power system operation as real-world case studies. We retrieve tweets from Twitter's streaming API by leveraging hashtag
search on the terms #electricity, #power systems, #electric, #power utility, #electric utility, #power grid, from hurricane Harvey's 18,336,283 tweets and hurricane Irma's 17,227,935 tweets. Additionally, Google Trends is used as another social sensing.
- We apply M-estimators [10] to calibrate the proposed model by processing spatial-temporal data sets. Then, this model is validated using Tenfold cross-validation.
The remainder of this paper is organized as follows. Section II develops a socio-technical model of power system resilience through the application of computational social science. Section III provides a framework to validate the proposed model that makes use of modern social science and explains how consumers' and prosumers' behaviors can be quantified using spatial-temporal data sets. Section IV calibrates and validates the proposed socio-technical power system model using two real-world events, Hurricane Harvey and Hurricane Irma. Finally, Section V concludes the paper.
## II. SOCIO-TECHNICAL POWER SYSTEM RESILIENCE
To capture the dynamical change in consumer, prosumer, and utility behaviors in response to a disaster, we develop a multi-agent-based dynamical model. This socio-technical model is beneficial for capturing emergent processes and for analyzing the multi-dimensional aspects of power system resilience. Figure 1 illustrates the interdependence between disasters, generational factors, and end-user behavior. We consider dissatisfaction, cooperation, and physical health to be end-user social behaviors. Additionally, we consider two distinct types of electricity generation, namely, (1) severity dependent type as exemplified by electricity generated by utilities and cooperation-dependent type as exemplified by electricity generated by Microgrids (MGs) and Distributed Energy Resources (DERs). Indeed, the performance of the utility power system to serve the load decreases with the severity of the disaster since the latter typically damages part of the electric infrastructure. As for the MGs and DERs, they are less affected by the disaster and therefore, can cooperate with electric stakeholders and share electricity during time of shortages.
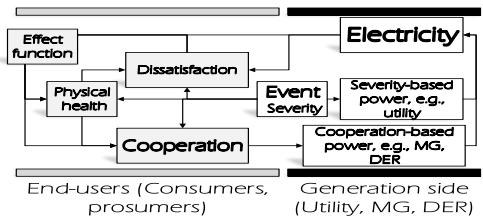 Fig. 1: Interdependence between Disasters, Generational Factors, and end-user Behavior
Prior to discussing the socio-technical power system resilience model, we will introduce next the threshold model using logistic function to consider the socio-technical effect, which is widely used in sociology, medicine, biology, ecology and neural networks [11], [12].
### a) Threshold Model using Logistic Function
The threshold model using logistic function allows us to set up thresholds beyond which the sociotechnical behavior changes [13], [14]. For instance, a power outage can result in consumer and prosumer dissatisfaction if the level of outages exceeds a given threshold, $\varphi(X)$. The logistic value, $\psi(X)$, of each factor on the resilience-related feature, $X$, is expressed as
$$
\psi(X) = \frac{1}{1 + e^{-\sigma^{X}(X_{ti} - \phi^{X})}}
$$
Additionally, we define $\psi'(X) = 1 - \psi(X)$.
### b) The Socio-Technical Power System Model
Eqs. 2-10 describe the dynamical changes in socio-technical behaviors. Note that all variables, parameters, and functions defined thus far take values between 0 and 1.
$$
\Delta \left(X _ {t i} ^ {E}\right) = \alpha_ {t i} ^ {\prime E} \left(f \left(\hat{X} _ {t i} ^ {E}, X _ {t i} ^ {E}\right) - X _ {t i} ^ {E}\right) \Delta t,
$$
$$
\alpha_{t i}^{' E} = \frac{\sum_{j} \alpha_{i j}^{E} X_{t j}^{E}}{\sum_{j} \alpha_{i j}^{E}} ,
$$
$$
f \left(\hat {X} _ {t i} ^ {E}, X _ {t i} ^ {E}\right) = \eta^ {E} \left[ X _ {t i} ^ {O} \left(1 - \left(1 - X _ {t i} ^ {E}\right) \left(1 - \hat {X} _ {t i} ^ {E}\right)\right) \right. \tag {4}
$$
$$
+ (1 - X _ {t i} ^ {O}) (\hat {X} _ {t i} ^ {E} X _ {t i} ^ {E}) ] + (1 - \eta^ {E}) \hat {X} _ {t i} ^ {E},
$$
$$
\hat {X} _ {t i} ^ {E} = w ^ {E E} \left(\frac {\sum_ {j} \alpha_ {t i j} ^ {E} X _ {t j} ^ {E}}{\sum_ {j} \alpha_ {t i j} ^ {E}}\right) + W ^ {E} \left(1 - X _ {t i} ^ {C} \quad \left(X _ {t i} ^ {C}\right)\right) \tag {5}
$$
$$
(1 - X _ {t i} ^ {P} (X _ {t i} ^ {P})) (1 - Q _ {t i} ^ {e} (Q _ {t i} ^ {e})) (X _ {t i} ^ {S} (X _ {t i} ^ {S}))
$$
$$
\Delta \left(X _ {t i} ^ {P}\right) = \eta^ {P} \psi^ {\prime} \left(X _ {t i} ^ {E}\right) \left[ Q _ {t i} ^ {e} \left(1 - X _ {t i} ^ {S}\right) - P _ {t i} \right] \Delta \tag {6}
$$
$$
\Delta \left(X _ {t i} ^ {C}\right) = \eta^ {C} \psi \left(X _ {t i} ^ {E}\right) \psi \left(X _ {t i} ^ {P}\right) \psi \left(X _ {t i} ^ {S}\right) \left[ X _ {t i} ^ {O} \left(1 - Q _ {t i} ^ {e}\right) - X _ {t i} ^ {C} \right] \Delta \tag {7}
$$
$$
\Delta \left(Q _ {t i} ^ {D E R}\right) = \alpha_ {t i} ^ {D E R} \left(\alpha_ {t i} ^ {D E R} - Q _ {t i} ^ {D E R}\right) \Delta t, \tag {8}
$$
$$
\alpha_{ti}^{DER} = \frac{\sum_{j} \alpha_{ij}^{E} X_{tj}^{C} Q_{tj}^{DER}}{\sum_{j} \alpha_{ij}^{E} X_{tj}^{C}}
$$
$$
Q_{ti}^{e} = \varpi Q_{ti}^{DER} + (1 - \varpi) X_{ti}^{S} \quad \left(X_{ti}^{S}\right) Q_{ti}^{U}.
$$
Eqs. 2-5 are related to the dynamical changes in enduser dissatisfaction levels, where $X_{ti}^{E}$ associated with the i-th consumer/prosumer dissatisfaction at time t with an incremental change, $\Delta (X_{ti}^{E})$. Note that a value of 0 or 1 for $X_{ti}^{E}$ indicates a low or a high level of dissatisfaction, respectively. Here, $f(\hat{X}_{ti}^{E},X_{ti}^{E})$ denotes the magnitude of the absorption and amplification's effect on the end-user emotion [15];
$\hat{X}_{ti}^{E}$ denotes the magnitude of the effect of dissatisfaction diffusion among consumers, prosumers, and external features on the end-user dissatisfaction. Additionally, $\alpha_{ti}^{\prime E}$ denotes the strength of the link between two consumers/prosumers i and j. A value of 1 for $\alpha_{ij}^{E}$ indicates a strong connection. In Eq. 3 $X_{ti}^{O}$ denotes an agent's optimism. A $X_{ti}^{O}$ value of 1 indicates that the consumer/prosumer is optimistic. The first term (with coefficient of $\eta^{E}$ represents the amplification effect while the final term (with coefficient of $(1 - \eta^{E})$ ) represents the absorption effect. The former effect is based on Fredrickson's broaden-and-build theory, and includes upwards and downwards spirals [15], [16]. If there is no external disaster within the group, the bottom-up absorption effect may be used. On the other hand, when an unexpected event occurs, the amplification effect should be considered as well. Combining the two effects makes sense for disaster resilience and planning. Eq. 5 consists of two components, namely the social diffusion and the impact of external factors. Social contagion or diffusion implies that end-users' dissatisfaction is contingent on the dissatisfaction of other consumers and prosumers. Additionally, the dissatisfaction is influenced by external factors, i.e., cooperation, $X_{ti}^{C}$, [17] physical health, $X_{ti}^{P}$, [18], and accessibility to electricity, $Q_{ti}^{e}$, [19] and severity of a disaster. $X_{ti}^{S}$. Eq. 6 is related to the dynamical changes in physical health, $\Delta(X_{ti}^{P})$ where $\eta^{P}$ denotes the dynamical coefficient of physical health. The latter is influenced by the level of dissatisfaction, the severity of a disaster, $X_{ti}^{S}$ and the access level to electricity, $Q_{ti}^{e}$, [20]. Eq. 7 is related to the dynamical changes in the level of consumer and producer cooperation, $\Delta(X_{ti}^{C})$. The level of cooperation is a function of the positive or negative emotion level based on the narrowing hypothesis of Fredrickson's broaden-and-build theory [21]. Indeed, cooperation is conditional on dissatisfaction [17], physical health [22], and the level of optimism among end-users [23], and access level to electricity by the end-users, $Q_{ti}^{e}$.
Eqs. 8-10 model the dynamical changes of accessibility to electricity by the end-users. The primary energy sources that supply electricity to consumers include utilities, MG, and DERs. Utilities are the primary suppliers of the demand of electricity. However, during disasters, some communities may lose access to utility-provided electricity. In this case, depending on their level of cooperation, end-users who own DERs, namely prosumers, may wish to share their electricity with consumers and critical loads that are not connected to the grid, but they are connected to them. Here, $\Delta(Q_{ti}^{DER})$ denotes the dynamical changes in accessibility to DER generated electricity. A value of 1 for $Q_{ti}^{DER}$ indicates that the consumer/prosumer makes full use of the DERs' capacity to meet its demand. Additionally, available electricity, $Q_{ti}^{e}$ is the total amount of electricity supplied by utilities and consumers, whereas $Q_{ti}^{U}$ is the amount of electricity generated by utilities, which varies according to the severity of a disaster. A value of 1 for $Q_{ti}^{U}$ indicates that utilities are fully utilizing their capacity to meet consumer/prosumer demand. Additionally, $\varpi$ is the fraction of an end-user's total electricity consumption that is supplied by DERs.
In this section, we have presented a mathematical model of the socio-technical power system resilience. In the following section, we discuss how to calibrate and validate that model using Tenfold cross-validation.
## III. ACTIVE DEMAND-SIDE MANAGEMENT AS ANCILLARY SERVICE
Meteorology organizations predict the weather. However, in general, weather is so nonlinear and impacts the power system states. There are five power system operation states: normal, alert, emergency, in extremes, and restoration. In an emergency condition, where the system starts to lose its stability, there is a requirement for corrective steps where consumers' roles and level of collaboration are inevitable to retain grid resilience.
In case of an approaching disaster, emergency services are informed and transmit a signal and required information to both utilities and consumers. In conventional power systems, the generation side deals with numerous issues, whereas in modern power systems, by grid modernization, the generation side is not alone anymore. Consumers can participate in active demand-side management and minimize their consumption during disasters in a decentralized power system. Decentralization is one of the main foundations for grid resiliency. In addition, the prosumers can share their electricity with their neighbors and assist critical loads. To have a resilient electricity system, the demand side plays a significant role. The consumer's desire to help power providers overcome a crisis hinges on customer satisfaction and cooperation. In addition, sharing electricity is interwoven with the level of cooperation of the community. There are four scenarios to keep grid resilience, voltage, and transient stability.
1. In real-time, it can send a signal through a communication system to consumers to turn off some of their devices, e.g., a computer, refrigerator during the event. One reason that motivates consumers to participate in active demand-side management is to prevent the automatic cutoff of electricity by utilities. In this circumstance, the level of collaboration and flexibility of consumers can affect grid resilience. Plus, numerous policies might be enacted to attract customers to engage. In this scenario, the consumers a day ahead (although it can be real-time) select they want to participate in active demand-side management and which
devices they only use to aid the utility to address grid resilience.
2. In the planning mode, the utility has a contract with consumers to turn off their devices during an event. Every device has a sensor and can be controlled by utilities. Here, the level of collaboration of consumers can help the utility to manage the incident.
3. In real-time, utilities can evaluate the risk of occurrences and turn off the electricity of consumer devices automatically without letting them know. In this instance, the consumer's satisfaction diminishes. In addition, some consumers like hospitals, while they are in desperate need of electricity, may be disconnected.
4. In addition, in the planning mode, prosumers and consumers can share their electricity with their neighborhoods and critical loads. We suppose that demand is $20 \mathrm{MW}$. In this scenario, if each home shares its electricity with only one neighborhood, the electricity demand reduces dramatically to $10 \mathrm{MW}$. In this scenario, the customers can respond to the utility signal that they share their electricity with n number/ KW of neighborhoods/consumers.
In all scenarios, a utility may set the level of disconnection based on different desired frequency thresholds. Utilities may view the 59-61 as a normal range of frequency fluctuations. In the case of three thresholds, we have the following scenarios:
a) If the frequency is lower than 59 HZ, the utility decrease the10 percent load to keep grid resilience.
b) If the frequency is lower than 55 HZ, the utility drops the 30 percent load to keep grid resilience
c) If the frequency is lower than $50\mathrm{Hz}$, the utility drops the 50 percent load to keep grid resilience.
Valinejad et al. [24] pioneered the development of an artificial society based on a power system's social demand response. They assumed that consumers could engage in demand response to achieve one of two goals: cost savings or increased system sustainability. Different communities and societies have distinct cultures and characteristics, which influence both dissatisfaction and cooperation. When the enduser's level of dissatisfaction and cooperation is as low as 0.5 and 0.1 in case 4, the proposed motivation price cannot meet the marginal level of load shaving of $20\%$. To achieve their goal in this situation, utilities must either increase the marginal level of load shaving to $30\%$, i.e., Case 5, or increase the motivation price by $20\%$, i.e., Case 6. Case 6 is more expensive for utilities. As can be seen, end-user behavior has an effect on utility costs and, consequently, on the reliability of power systems. When people's level of dissatisfaction is high, the situation becomes even worse. To accomplish its objectives, the utility must increase the motivation price by at least $40\%$ (appropriate level of load shaving).
## IV. CALIBRATING AND VALIDATING THE SOCIO-TECHNICAL POWER SYSTEM RESILIENCE MODEL
The process for calibrating and validating the sociotechnical power system resilience model proposed in Section II is depicted in Figure 2. Prior to validating the model, we measure the social behavior of the end-users. Social scientists and cognitive, personality, clinical, and social psychologists use surveys and direct qualitative questions to measure social behavior in conventional social science. While the surveys provide us with an appropriate dataset, they exhibit several significant drawbacks. In practice, they are costly and time consuming to execute. Typically, they are only composed of subsets of the society. Last but not least, individuals have varying interpretations of the level of social behavior. On the other hand, in the new era of language psychology, utilizing community communication via social media platforms such as Twitter and
Facebook can circumvent survey limitations and provide a rich dataset. This social media platform is being used to deduce linguistic and psychological patterns associated with social behavior. Due to the strong correlation between linguistic patterns and personality and psychological state in contemporary social science, social behavior is estimated using linguistic patterns. The words and language we use on a daily basis reflect our internal thoughts, our quality of life, our personality, our cognitive styles, our emotions, and our psychological and social behavior. Now, let us utilize the Twitter and Google Trend datasets in order to analyze the resiliency during Hurricanes Irma and Harvey. We retrieve tweets about the power system by filtering them and utilizing the hashtag search for #electricity, #power system, #electric, #DER, #power plant, #distributed generation, #micro grid, #power utility, #electric utility, #renewable energy, #blackout, #power grid, #power network.
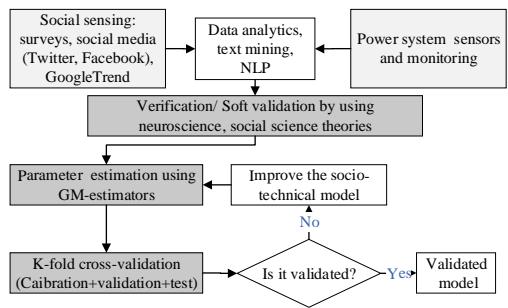 Fig. 2: Validation of the Cyber-Physical-Social Power System
Following the collection of the raw dataset, we employ psychology-based natural language processing, specifically the Linguistic Inquiry and Word Count (LIWC), to extract endusers social behavior, including dissatisfaction, cooperation, and physical health.
- Dissatisfaction: Disasters such as the 2021 Texas winter storm, Hurricane Irma, and Hurricane Harvey result in end-user dissatisfaction. The latter is caused by negative emotional traits, such as anxiety, sadness, and anger [25]– [27]. Using the Twitter dataset, we quantify spatial-temporal dissatisfaction by quantifying these features. The measure of dissatisfaction is calculated by averaging the normalized values of anxiety, sadness, and anger. By using the categories of the LIWC, the level of fear is obtained by -
$$
S^{E} = LIWC['anx']/LIWC['WC']
$$
where $LIWC['anx']$ means the category of "anx" from outputs of LIWC.
- Cooperation: According to psychological research on language, the more words used in communication, the greater the level of agreement and cooperation. The increased use of complex words and words with more than six letters implies a
decrease in communication efficiency, cooperation, and social interaction [28]. Additionally, the plural form of the first person indicates group interaction and cohesion [29]. Increasing the use of social process languages, such as family and friend-related terms, implies an increase in social interaction, engagement, and cooperation [30], [31]. Finally, assent-related language promotes group consensus, interaction, and cooperation [32]. Hence, the level of cooperation is obtained by
$$
\begin{array}{l} X _ {C} = \left(L I W C \left[ ^ {\prime} W C ^ {\prime} \right] - L I W C \left[ ^ {\prime} S i x l t r ^ {\prime} \right] + L I W C \left[ ^ {\prime} w e ^ {\prime} \right]\right) \\+ L I W C [ ^ {\prime} s o c i a l ^ {\prime} ] L I W C [ ^ {\prime} f a m i l y ^ {\prime} ] L I W C [ ^ {\prime} f r i e n d ^ {\prime} ] + \\L I W C [ ^ {\prime} a s s e n t ^ {\prime} ]) / (L I W C [ ^ {\prime} W C ^ {\prime} ]) \\\end{array}
$$
- Physical Health: According to psychological research on language, increased use of the first-person singular can imply physical pain [33]. Individuals who are physically ill frequently draw attention to themselves. The increased use of motion, leisure, and work-related terms reflect an increase in physical activity and health. Additionally, the more health-related words a person uses, the better their physical health. The increased use of positive body-related terms implies physical health
[34]–[37]. By using the categories of the LIWC, the level of physical health is obtained by
$$
S ^ {P} = \left(- L I W C [ ^ {\prime} i ^ {\prime} ] + L I W C [ ^ {\prime} h e a l t ^ {\prime} ] + L I W C [ ^ {\prime} l e i s u r e ^ {\prime} ] + \right.
$$
$$
\begin{array}{l} L I W C [ ^ {\prime} w o r k ^ {\prime} ] + L I W C [ ^ {\prime} b o d y ^ {\prime} ] + L I W C [ ^ {\prime} m o t i o n ^ {\prime} ]) / L I W C \\\left[ ^ {\prime} W C ^ {\prime} \right] \\\end{array}
$$
The Calibration and Validation Process can be Summarized as follows.
Step1) Amassing disaster-related data on power systems: First, we collect all tweets about the considered disaster. Then, we retrieve tweets about the power system via a hashtag or related word search. Additionally, we utilize Google Trend as a second social sensing tool.
Step 3) Measuring Social Behavior: We leverage language psychology analysis tools, such as LIWC, to assess social behavior from the cleaned text. We look for social patterns associated with resilience using the following categories: anxiety, sadness, anger, First-person singular, health, leisure, work, body, motion, word count, words $>6$ lettersfirst -person plural, social process, family, friends, exclusive, and assent.
By using the categories of the LIWC, the level of fear is obtained by
$$
S^{E} = LIWC['anx']/LIWC['WC']
$$
where $LIWC['anx']$ means the category of "anx" from outputs of LIWC.
Hence, the level of cooperation is obtained by-
$$
\begin{array}{l} X _ {C} = \left(L I W C ^ {\prime} W C ^ {\prime}\right) - L I W C ^ {\prime} S i x l t r ^ {\prime}) + L I W C ^ {\prime} w e ^ {\prime}) + \\L I W C [ ^ {\prime} s o c i a l ^ {\prime} ] \quad + \quad L I W C [ ^ {\prime} f a m i l y ^ {\prime} ] \quad + \quad L I W C [ ^ {\prime} f r i e n d ^ {\prime} ] \\\left. L I W C \left[ ^ {\prime} a s s e n t ^ {\prime} \right]\right) / \left(L I W C \left[ ^ {\prime} W C ^ {\prime} \right]\right) \\\end{array}
$$
By using the categories of the LIWC, the level of physical health is obtained by
$$
S^{P} = (-LIWC[\prime i \prime] + LIWC[\prime health \prime] + LIWC[\prime leisure \prime] + LIWC[\prime work \prime] + LIWC[\prime body \prime] + LIWC[\prime motion \prime])/LIWC[\prime WC \prime]
$$
Step 4) Concluding Social Behavior: We begin this step by dealing with missing values via an interpolation approach. In order to fairly consider each category to estimate community resilience, we normalize the measure of each category using min-max scaling. Given a feature $x(t)$, an arbitrary interval of values, i.e., $[ \alpha, \beta ]$ based on min-max scaling, a normalized measure is obtained by:
$$
x ^ {\prime} (t) = \alpha + \frac {(x (t) - x _ {\operatorname* {m i n}} (t))) (\beta - \alpha)}{x _ {\operatorname* {m a x}} - x _ {\operatorname* {m i n}}}, \tag {11}
$$
where we set $\alpha = 0$ and $\beta = 1$ and $x_{\mathrm{max}}$ and $x_{\mathrm{min}}$ are the maximum and minimum measure collected during the period considered, and is $x^{\prime}(t)$ a normalized measure as a real number in [0,1]. After that, we deduce spatial-temporal trends in end-user social behavior during a disaster.
Step 5) Soft validation: We verify the model using soft validation.
Step 6) Parameter estimation: We calibrate the model using a Huber M-estimator. The Huber loss are as follows:
$$
\theta = \operatorname{argmin} (\sum \log (f (x))) = \operatorname{argmin} (\sum \rho (x _ {i}, \theta))
$$
and
$$
\rho \left(x _ {i}, \theta\right) = \left\{ \begin{array}{l l} \frac{1}{2} x _ {i} ^ {2} & | x _ {i} | \leq \sigma \\ \sigma \left(| x _ {i} | - \frac{1}{2} \sigma\right) & \text{otherwise} \end{array} \right. \tag{12}
$$
Step 7) Validation by cross-validation: We validate the model using tenfold cross-validation. We classify $60\%$ of data as calibration data, $20\%$ as validation data, and $20\%$ as test data.
Step 8) Updating the Model: If the proposed sociotechnical power system resilience model does not perform well after cross-validation, we modify the model accordingly.
## V. CALIBRATING AND VALIDATION THE MODEL BY USING DATASETS FROM HURRICANES HARVEY AND IRMA
We collect a variety of data samples for Hurricanes Harvey and Irma. We retrieve power-system-related tweets from Twitter's streaming Application Programming Interface (API) by leveraging hashtag search on the hashtag search on #electricity, #power system, #electric, #DER, #power plant, #distributed generation, #micro grid, #power utility, #electric utility, #renewable energy, #blackout, #power grid, #power network, from 18,336,283 tweets of Hurricane Harvey and 17,227,935 tweets of Hurricane Irma for validation purpose. We use the same words as hashtags for word-related searches. We also use Google Trend as another social sensing. Table I provides a summary of 5 samples for each hurricane.
Hurricane Harvey and Irma's tracks, in-hurricane power plants, Tweets, and severity are depicted in Figure 3.
The following is a summary of the impact of these hurricanes.
Hurricane Harvey in Texas: Between 08/25/2017 and 09/11/2017, Hurricane Harvey struck Texas and the ERCOT
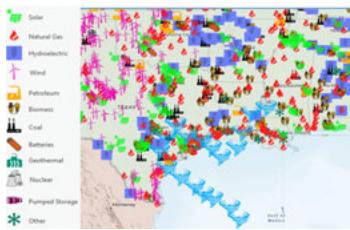
(a) Harvey track
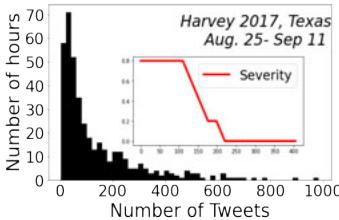
(b) Harvey Tweets
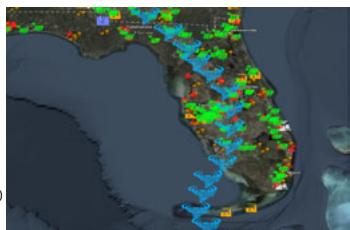
(c) Irma track
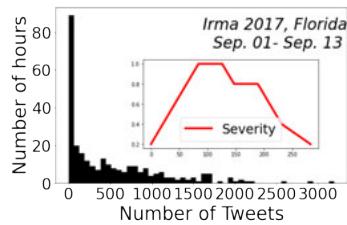
(d) Irma Tweets Fig. 3: Hurricane Harvey and Irma's Tracks, in-Hurricane Power Plants, Tweets Frequency, and Hurricane Severity
Table I: The summary of samples for Hurricanes Harvey and Irma
<table><tr><td>Sample</td><td>Social sensing</td><td>Type of search</td><td>Harvey Tweets IDs</td><td>Irma Tweets IDs</td></tr><tr><td>1</td><td>Twitter</td><td>Hashtag</td><td>217</td><td>271</td></tr><tr><td>2</td><td>Twitter</td><td>Word related</td><td>11500</td><td>54100</td></tr><tr><td>3</td><td>Twitter</td><td>Event related</td><td>20000</td><td>30000</td></tr><tr><td>4</td><td>Twitter</td><td>Word related</td><td>82000</td><td>245000</td></tr><tr><td>5</td><td>GoogleTrend</td><td>Word related</td><td>-</td><td>-</td></tr></table>
territory. On 08/25/2017, it strengthened to Category 4. Like Hurricane Katrina, this hurricane is the most expensive tropical cyclone in the US history. In Texas, 1168 MW of wind energy capacity and 5679 MW of solar energy capacity in ERCOT became unavailable and energy production fell by $21\%$. As a result, power systems throughout ERCOT's territory experienced outages between 08/25/2017 and 08/29/2017, leaving many people without power or water. The maximum number of outages reached 309204, which affected two of ERCOT's major utilities, namely AEP Texas North Company (#20404) and AEP Texas Central Company (#3278). For these power utilities, the total number of meters, including smart and nonsmart meters, is 1028900. It took about two weeks, namely from 08/29/2017 to 09/12/2017, for the power system to be restored. We extract various samples of tweets about Hurricane Harvey from the Table I. Between 2:00 p.m. and 11:00 p.m. on 08/30/2017, the customer outage dataset contains missing values due to the loss of an entity website.
Hurricane Irma in Florida: Between 09/01/2017 and 09/13/2017, Hurricane Irma made landfall primarily in Florida and to a lesser extent in Georgia and South Carolina. Between 09/06/2017 and 09/08/2017, this storm was a Category 5 hurricane. Hurricane Irma was downgraded to a Category 3 storm before making landfall in Florida on 09/09/2017. However, on 09/10/2017, it was upgraded to a Category 4 hurricane. Hurricane Irma was then downgraded to Category 1 status on 09/11/2017. Between 09/09/2017 and 09/11/2017, power systems faced outages. It damaged several utilities, including the City of Tallahassee (TAL#18445), the Jacksonville Electric Authority (JEA#9617), Gainesville Regional Utilities (GVL#6909), the City of New Smyrna Beach (NSB#13485), Florida Power Corp. (FPC#6457), Tampa Electric Co. (TEC#18454), Seminole Electric Cooperative (SEC),
Florida Municipal Power (FMPP#19804), and Florida Power & (SOCO). The recovery of the power system began on 09/11/2017 and lasted 12 days.
### a) Results for the First Sample
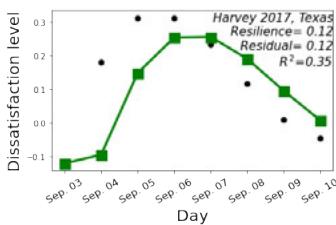
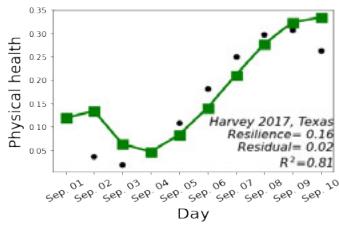
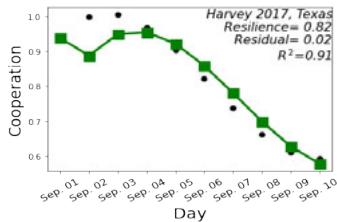
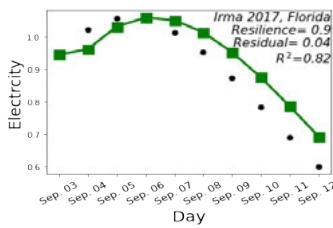
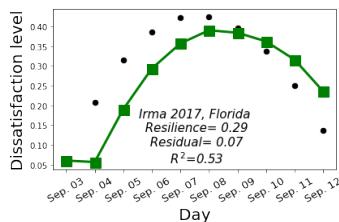
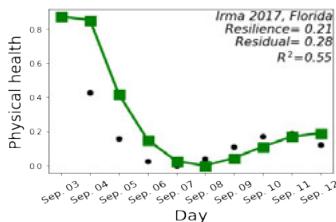
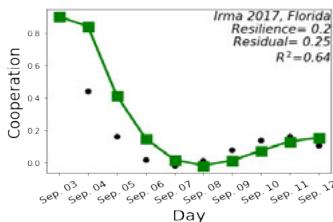
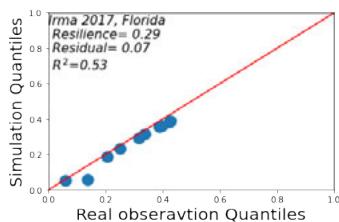
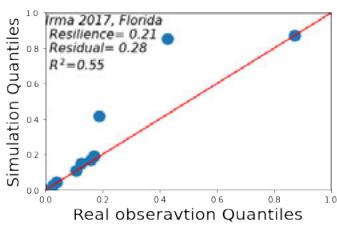
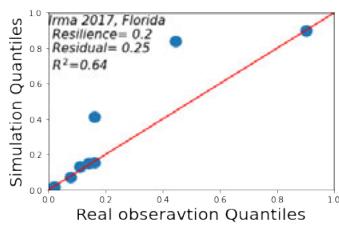
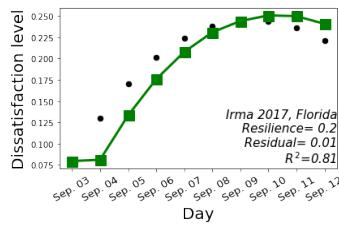
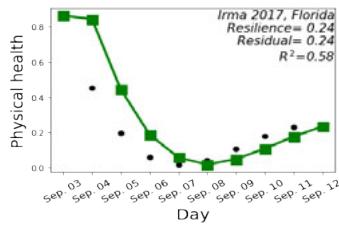
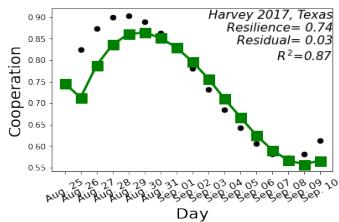
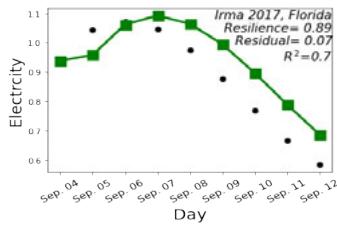
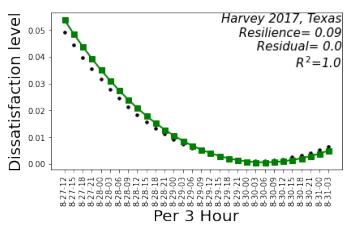
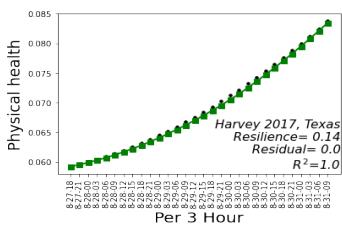
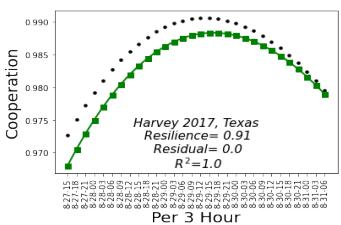
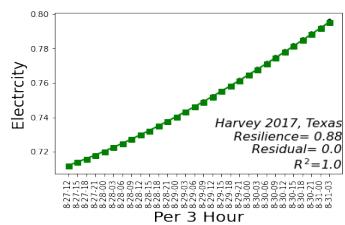
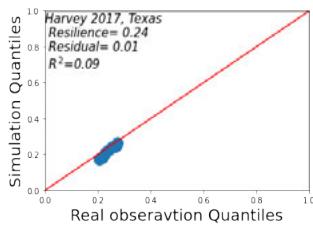
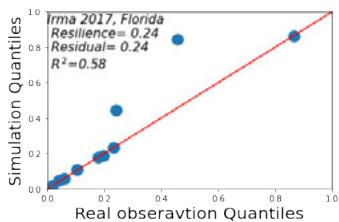
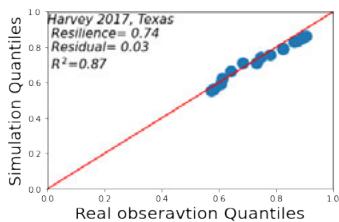
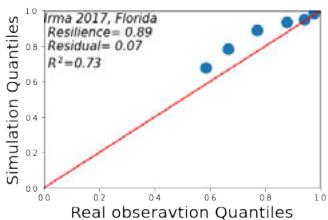
The results of a 10-fold cross-validation of the socio technical power system resilience model using the Huber Mestimator for the first sample are displayed in Fig. 4. This graph depicts consumer/prosumer dissatisfaction, physical health, cooperation, and the cooperation/severity-dependent electricity using real datasets. The figure also show simulation results related to various scenarios used for calibration, validation, and testing of multi-agent-based model. Each sub figure contains information about the type of event, its resilience level, value of $R^2 = 1 - (RSS / TSS)$ where $RSS = \sum (y - \bar{y})^2$, and $TSS = \sum (y - \bar{y})^2$. We calibrate and validate the model using data obtained from both Hurricanes Irma and Harvey. Additionally, we calibrate and validate the model for Hurricanes Irma and Harvey separately. The estimated threshold level at which cooperation among end-users has an effect on diss at is factionise qualto 0.5. Similarly, the estimated threshold levels are 0.500002, 0.500017, and 0.500071 for the effects of physical health, electricity, and disaster severity on consumer/prosumer dissatisfaction, respectively. The estimated threshold levels of electricity and severity on dissatisfaction among Florida end-users are equal to 0.499355 and 0.501454, respectively. These estimated threshold levels for ERCOT areas are equal to 0.500039 and 0.499944, respectively. Additionally, the amplification and absorption effects on the level of dissatisfaction are 0.501797 and 0.498203, respectively. The end users in the ERCOT area and Florida have an optimistic attitude of up to 0.502206. Florida end-users and utilities are less optimistic than their counterparts in Texas with an optimistic level estimated to 0.478854 versus 0.498893 for Texas. For both areas, the estimated threshold level for the effect of dissatisfaction on physical health is equal to 0.415647. Additionally, this threshold is equal to 0.494225, 0.493983, and 0.495111 for the effect of dissatisfaction, physical health, and severity on cooperation, respectively. The estimated threshold level for the effect of severity on electric utility services is equal to 0.458197. This means that if the hurricane is a category three or higher, it has a detrimental effect on the utility's performance. Additionally, approximately $100\%$ of electricity services are cooperatively provided. The estimated threshold level for the effect of severity on ERCOT is 0.457566, while that of Florida is 0.479339. Additionally, $76\%$ of electricity services in ERCOT is of a cooperative-type while $24\%$ are severity- type. Indeed, ERCOT is more vulnerable to hurricane damage than Florida utilities.
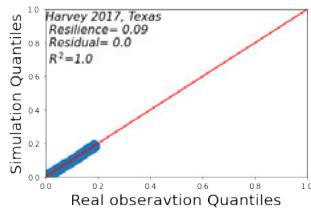
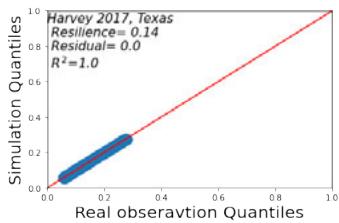
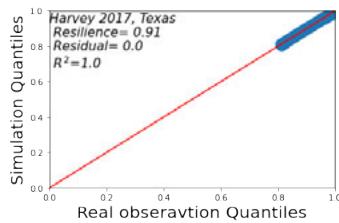
Fig. 5 illustrates the QQ-plot for the test dataset's various socio-technical resilience-related features. It demonstrates that the simulation and the real datasets have a similar distribution. The distributions of dissatisfaction and cooperation/severity dependent electricity for the simulation case are more similar to the real case than the physical health and cooperation of the end-users.
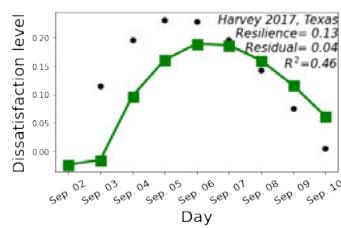
Real observation (Calibration) —— Simulation(Calibration by using Huber M-estimator) (a) Dissatisfaction
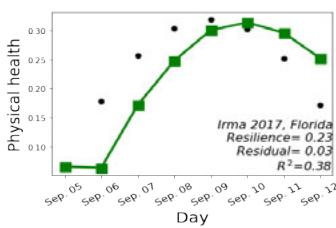
(b) Physical health
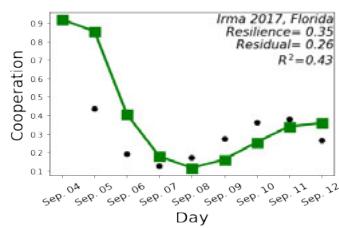
(c) Cooperation
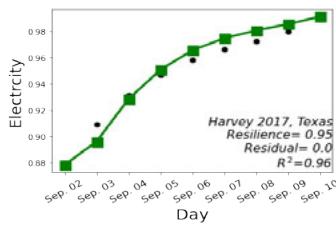
(d) Electricity
Real observation (Validation) —— Simulation(Validation by using Huber M-estimator) (e) Dissatisfaction
(f) Physical health
(g) Cooperation
(h) Electricity
Real observation (Test) (i) Dissatisfaction
(j) Physical health
Simulation(Test by using Huber M-estimator) (k) Cooperation
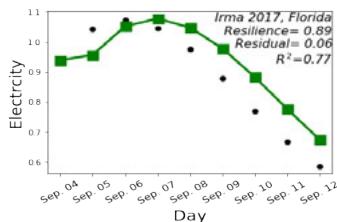
(I) Electricity Fig. 4: Consumers' and Prosumers' Level of Dissatisfaction, Physical Health, Cooperation, and the Cooperation/Severity-Dependent Level of Electricity. These are Determined using 10-Fold Cross-Validation, which Included Calibration, Validation, and Test. The Socio-Technical Power System Resilience Model is Calibrated using a Huber M-Estimator and Data Obtained from Hurricanes Irma and Harvey
(a) Dissatisfaction
(b) Physical health
(c) Cooperation
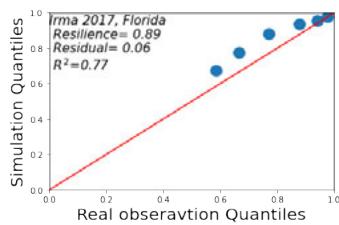
(d) Electricity Fig. 5: The QQ-Plot Depicts the Level of Dissatisfaction, Physical Health, and Cooperation of Consumers, Prosumers, and the Level of Cooperation/Severity-Dependent Electricity of Socio-Technical Power Systems Resilience for the Test Data Set
Table II shows the results of the statistical analysis using real-world and simulation datasets for calibration, validation, and test scenarios. The Shapiro-Wilk normality test demonstrates that the majority of cases follow the normal distribution except for cooperation during calibration and testing, as well as the physical health of end-users in the test scenario. Indeed, 0.75 of features exhibit normal distribution behavior. Additionally, the Pearson and Kendall tau correlations demonstrate the high degree of correlation between the simulation and the real datasets. Additionally, Student's t-test p-values (as parametric statistical hypothesis test) and Mann-Whitney U test p-values (as non-parametric statistical hypothesis test) indicate that the distribution of the socio-technical resilience-related features obtained from the real data set and simulation outputs are similar in all cases.
### b) Summary Results for all Samples
Fig. 6 provides the graphs of the tenfold cross-validation of the socio-technical power system resilience model using the median estimated values of five samples and a three-hourly based dataset for the real and simulated datasets. The results indicate that the socio-technical resilience-related features in the three-hourly-based dataset have a higher R2 value. In other words, the 10-fold cross-validation produces more precise results than the daily datasets. This is because we calibrate the model with more data for the former case. Using the median estimated values of five samples, we found that the level of optimism is equal to 0.537192. The estimated threshold levels for the effect of electricity and disaster severity on the level of dissatisfaction among power system stakeholders are respectively 0.499162 and 0.498763. Additionally, the estimated threshold level of the effect of severity on electricity is equal to 0.45721. On the other hand, using 10-fold cross-validation on a three-hourly basis, the estimated level of optimism among the end-users is equal to 0.594039. The estimated threshold levels for the effect of electricity and disaster severity on dissatisfaction among stakeholders in the power system is 0.475009 and 0.538839, respectively. The amplification effect, as defined by the broaden-and-build theory, accounts for $67\%$ of the dissatisfaction level, while the absorption effect, as defined by the bottom-up emotion theory, accounts for $33\%$. When we use a daily-based dataset, these values are $50\%$ and $50\%$. The estimated threshold values for the effect of severity on electricity is equal to 0.458702 in three-hourlybased analyses. Additionally, $76\%$ of electricity services are cooperation-based while $24\%$ are severity-based. As illustrated in Fig. 7, there is a greater similarity in the distributions of three-hourly-based datasets than in the daily-based dataset.
Table II: Results of The Statistical Analysis of Socio-Technical Power Systems Resilience Including Shapiro-Wilk Normality Test, Pearson Correlation, Kendall Tau Correlation, Parametric Statistical Hypothesis Tests (Student's T-Test), and Non-Parametric Statistical Hypothesis Tests (Mann-Whitney U Test). Note that in the Table, the Gaussian Probability Distribution is Denoted as "Gauss." and the Dependence Between the Simulation and Real Datasets is Denoted as "Dep."
<table><tr><td>10-fold Cross-validation</td><td colspan="4">Calibration</td><td colspan="4">Validation</td><td colspan="4">Test</td></tr><tr><td>Statistic test</td><td>\(X_{ti}^{E}\)</td><td>\(X_{ti}^{P}\)</td><td>\(X_{ti}^{C}\)</td><td>\(Q_{ti}^{e}\)</td><td>\(X_{ti}^{E}\)</td><td>\(X_{ti}^{P}\)</td><td>\(X_{ti}^{C}\)</td><td>\(Q_{ti}^{e}\)</td><td>\(X_{ti}^{E}\)</td><td>\(X_{ti}^{P}\)</td><td>\(X_{ti}^{C}\)</td><td>\(Q_{ti}^{e}\)</td></tr><tr><td>Real data set p-value</td><td>0.3(Gauss.)</td><td>0.24(Gauss.)</td><td>0.012(not Gauss.)</td><td>0.45(Gauss.)</td><td>0.52(Gauss.)</td><td>0.22(Gauss.)</td><td>0.16(Gauss.)</td><td>0.15(Gauss.)</td><td>0.27(Gauss.)</td><td>0.002(not Gauss.)</td><td>0.002(not Gauss.)</td><td>0.28(Gauss.)</td></tr><tr><td>Simulation P-value</td><td>0.17(Gauss.)</td><td>0.07(Gauss.)</td><td>0.036(not Gauss.)</td><td>0.16(Gauss.)</td><td>0.34(Gauss.)</td><td>0.21(Gauss.)</td><td>0.09(Gauss.)</td><td>0.16(Gauss.)</td><td>0.07(Gauss.)</td><td>0.007(not Gauss.)</td><td>0.006(not Gauss.)</td><td>0.32(Gauss.)</td></tr><tr><td>Pearson corr</td><td>0.74(Dep.)</td><td>0.77(Dep.)</td><td>0.81(Dep.)</td><td>0.99(Dep.)</td><td>0.67(Dep.)</td><td>0.91(Dep.)</td><td>0.96(Dep.)</td><td>0.96(Dep.)</td><td>0.8(Dep.)</td><td>0.88(Dep.)</td><td>0.89(Dep.)</td><td>0.93(Dep.)</td></tr><tr><td>kendalltau corr</td><td>0.61</td><td>0.43</td><td>0.5</td><td>1</td><td>0.57</td><td>0.73</td><td>0.82</td><td>0.78</td><td>0.64</td><td>0.64</td><td>0.68</td><td>0.77</td></tr><tr><td>Student'st-test p value</td><td>0.54(same)</td><td>0.72(same)</td><td>0.69(same)</td><td>0.9(same)</td><td>0.68(same)</td><td>0.84(same)</td><td>0.95(same)</td><td>0.55(same)</td><td>0.61(same)</td><td>0.59(same)</td><td>0.63(same)</td><td>0.57(same)</td></tr><tr><td>Mann-Whitney U Test p value</td><td>0.2(same)</td><td>0.26(same)</td><td>0.48(same)</td><td>0.38(same)</td><td>0.34(same)</td><td>0.33(same)</td><td>0.38(same)</td><td>0.27(same)</td><td>0.22(same)</td><td>0.41(same)</td><td>0.5(same)</td><td>0.22(same)</td></tr></table>
Real observation (Test) (a) Dissatisfaction
(b) Physical health
(c) Cooperation
(d) Electricity
Real observation (Test) (e) Dissatisfaction
(f) Physical health
(g) Cooperation
(h) Electricity Fig. 6: Graphs of the Level of Dissatisfaction, Physical Health, and Cooperation of Consumers and Prosumers, and the level of Cooperation/Severity-Dependent Electricity in the Socio-Technical Power Systems Resilience Model for two Scenarios: 1) Median of All Samples and 2) Three-Hourly-Based Data Set
## VI. CONCLUSIONS
In this paper, we use neuroscience and social science theories to model the complex collective behavior of consumers and prosumers during a disaster. The proposed socio-technical power system resilience model is beneficial for observing emergent processes and developing new hypotheses that can be tested in real-world scenarios. We propose an approach for assessing the behavior of power system stakeholders through the use of social sensing tools such as Twitter and Google Trend. We increase the proposed model's reliability by validating it using cross-validation and data sets related to Hurricanes Harvey and Irma. It should be noted that the approach proposed in this paper for model validation can be applied to a wide variety of socio-technical power system problems.
(a) Dissatisfaction
(b) Physical health
(c) Cooperation
(d) Electricity
(e) Dissatisfaction
(f) Physical health
(g) Cooperation
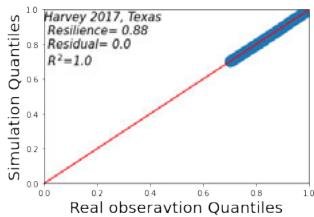
(h) Electricity Fig. 7: The QQ-Plot of Consumers' and Prosumers' Level of Dissatisfaction, Physical Health, and Cooperation, as Well as Cooperation/Severity dependent Level of Electricity, Using the Median of All Samples (Figures A-D) and Three-Hourly-Based Data (Figures E-H).
Generating HTML Viewer...
References
34 Cites in Article
L Mili (2011). Taxonomy of the characteristics of power system operating states.
M Panteli,P Mancarella,D Trakas,E Kyriakides,N Hatziargyriou (2017). Metrics and quantification of operational and infrastructure resilience in power systems.
Eileen Watson,Amir Etemadi (2020). Modeling Electrical Grid Resilience Under Hurricane Wind Conditions With Increased Solar and Wind Power Generation.
Mathaios Panteli,Cassandra Pickering,Sean Wilkinson,Richard Dawson,Pierluigi Mancarella (2017). Power System Resilience to Extreme Weather: Fragility Modeling, Probabilistic Impact Assessment, and Adaptation Measures.
Gang Huang,Jianhui Wang,Chen Chen,Junjian Qi,Chuangxin Guo (2017). Integration of Preventive and Emergency Responses for Power Grid Resilience Enhancement.
Shanshan Ma,Liu Su,Zhaoyu Wang,Feng Qiu,Ge Guo (2018). Resilience Enhancement of Distribution Grids Against Extreme Weather Events.
L Mili,K Triantis,A Greer (2018). Integrating community resilience in power system planning.
M Panteli,D Trakas,P Mancarella,N Hatziargyriou (2016). Boosting the power grid resilience to extreme weather events using defensive islanding.
R Sheldrake (2011). The presence of the past: morphic resonance and the habits of nature.
L Mili,M Cheniae,N Vichare,P Rousseeuw (1996). Robust state estimation based on projection statistics [of power systems].
F Gaol (2014). Interdisciplinary Behavior and Social Sciences: Proceedings of the 3rd International Congress on Interdisciplinary Behavior and Social Science 2014 (ICIBSoS 2014).
D Champion (1970). Basic statistics for social research.
B Haig,C Evers (2015). Haig Fund.
Tibor Bosse,Mark Hoogendoorn,Michel Klein,Jan Treur,C Van Der Wal,Arlette Van Wissen (2013). Modelling collective decision making in groups and crowds: Integrating social contagion and interacting emotions, beliefs and intentions.
Mark Hoogendoorn,Jan Treur,C Van Der Wal,Arlette Van Wissen (2010). Modelling the Emergence of Group Decisions Based on Mirroring and Somatic Marking.
Jaber Valinejad,Lamine Mili,C Van Der Wal,Michael Von Spakovsky,Yijun Xu (2021). Multi-Dimensional Output-Oriented Power System Resilience based on Degraded Functionality.
David Rand,June Gruber (2014). Positive Emotion and (Dis)Inhibition Interact to Predict Cooperative Behavior.
Julius Ohrnberger,Eleonora Fichera,Matt Sutton (2017). The relationship between physical and mental health: A mediation analysis.
Abdallah Ibrahim,Genevieve Aryeetey,Emmanuel Asampong,Duah Dwomoh,Justice Nonvignon (2016). Erratic electricity supply (Dumsor) and anxiety disorders among university students in Ghana: a cross sectional study.
C Liddell,C Guiney (2015). Living in a cold and damp home: frameworks for understanding impacts on mental well-being.
R.-M H¨am¨ Al¨ainen,A Aro,C Lau,D Rus,L Cori,A Syed (2016). Cross-sector cooperation in health-enhancing physical activity policymaking: more potential than achievements?.
Sang-Eun Byun,Siyuan Han,Hyejeong Kim,Carol Centrallo (2020). US small retail businesses’ perception of competition: Looking through a lens of fear, confidence, or cooperation.
Jaber Valinejad,Lamine Mili,C Van Der Wal,Yijun Xu (2021). Environomic-Based Social Demand Response in Cyber-Physical-Social Power Systems.
Anne Krendl,Brea Perry (2021). The Impact of Sheltering in Place During the COVID-19 Pandemic on Older Adults’ Social and Mental Well-Being.
Lien Faelens,Kristof Hoorelbeke,Bart Soenens,Kyle Van Gaeveren,Lieven De Marez,Rudi De Raedt,Ernst Koster (2021). Social media use and well-being: A prospective experience-sampling study.
Mario Paredes,Vanessa Apaolaza,Cristóbal Fernandez-Robin,Patrick Hartmann,Diego Yañez-Martinez (2021). The impact of the COVID-19 pandemic on subjective mental well-being: The interplay of perceived threat, future anxiety and resilience.
M Mehl,S Gosling,J Pennebaker (2006). Personality in its natural habitat: Manifestations and implicit folk theories of personality in daily life.
Rachel Simmons,Peter Gordon,Dianne Chambless (2005). Pronouns in Marital Interaction.
E Lazega (2001). The collegial phenomenon: The social mechanisms of cooperation among peers in a corporate law partnership.
Matthew Newman,Carla Groom,Lori Handelman,James Pennebaker (2008). Gender Differences in Language Use: An Analysis of 14,000 Text Samples.
J Sexton,Robert Helmreich (2000). Analyzing Cockpit Communications: The Links Between Language, Performance, Error, and Workload.
Stephanie Rude,Eva-Maria Gortner,James Pennebaker (2004). Language use of depressed and depression-vulnerable college students.
G Wendel-Vos,A Schuit,M Tijhuis,D Kromhout (2004). Leisure time physical activity and healthrelated quality of life: cross-sectional and longitudinal associations.
No ethics committee approval was required for this article type.
Data Availability
Not applicable for this article.
How to Cite This Article
Jaber Valinejad. 2026. \u201cSocio-Technical Power System Resilience\u201d. Global Journal of Computer Science and Technology - E: Network, Web & Security GJCST-E Volume 23 (GJCST Volume 23 Issue E2).
Explore published articles in an immersive Augmented Reality environment. Our platform converts research papers into interactive 3D books, allowing readers to view and interact with content using AR and VR compatible devices.
Your published article is automatically converted into a realistic 3D book. Flip through pages and read research papers in a more engaging and interactive format.
Our website is actively being updated, and changes may occur frequently. Please clear your browser cache if needed. For feedback or error reporting, please email [email protected]
Thank you for connecting with us. We will respond to you shortly.