Wood density (WD) is not only a key element in tropical forest ecology to estimate tree biomass but also an indicator of timber quality, and it integrates many aspects of tree mechanical properties and functioning. Notably, contrasting patterns of radial variation of WD have been demonstrated and are related to regeneration guilds (light-demanding vs. shadebearing) but haven’t been demonstrated to be related to leaf phenology (deciduous vs. evergreen). With the destructive method and the “archimed” principle, we investigated the WD radial variation of nine timber tree species harvested in the eastern region of Cameroon. The result showed that WD differed significantly among these nine species (P > 0.05).
## I. INTRODUCTION
Reduction of tropical forest areas has a great impact on the amount of carbon dioxide stored in the atmosphere (Houghton 1985) because the forest is a great essential source of the world producing oxygen $(\mathrm{O}_2)$ and storing carbon dioxide $(\mathrm{CO}_2)$. Importantly, $\mathrm{CO}_2$ is an influential gas leading to climate change. Estimating the aboveground biomass (AGB) content is necessary for considering the total carbon content stored in the forest ecosystem (Ketterings et al. 2001; Chave et al., 2004). This AGB is generally estimated by using allometric equations, the variables involved in such equations are the diameter at breast height, total height, and wood density (WD) or more conventionally the wood-specific gravity (WSG). Chave et al. (2005; 2014) showed that this calculation is used in the majority of studies involving allometric models. WD is one of the most important variables in forest and wood science as it is crucial for understanding tree structures and functions, and is relevant for timber properties and the energy content of the material. WD is calculated by dividing the oven-dry mass of a sample by the mass of a volume of water equal to the volume of the sample at a particular moisture content (ASTM 2011). According to Panshin & de Zeeuw 1980; Chave et al. 2009, it is a major predictor of wood's mechanical properties and is also a trait distinguished by chemical and anatomical traits (Lachenbruch & McCulloh 2014). A key source of information on tree adaptation is the variety in wood anatomy (Beeckman 2016; Tarelkin et al. 2016).
The anatomical structure of wood, which includes the features of the vessels and fibres, can be used to describe the density fluctuations inside a tree (Roque & Filho 2007). In hardwood species, the ratio or quantity of various cell types and their spatial patterns determine this WD variation. These cell types include axial parenchyma, vessels, fibres, and rays (Panshin & de Zeeuw 1970). De Mil et al. (2018) shown that whereas vessels and parenchyma are adversely connected to the WD of the tree growth rate during ontogeny, fibres with thicker walls and flattened lumina increase WD. DRYAD is a global repository from which the average WD values at the species or genus level have been derived (Zanne et al. 2009). Using these repositories (Zanne et al. 2009; Chave et al. 2009) could result in an overestimation of WD for the species community of roughly $16\%$. (Ramananantoandro et al. 2015). Also according to these archives, tropical WD (for light- to heavy-wood) range from 0.1 to 1.5 g.cm-3 (Zanne et al. 2009; Chave et al. 2009). In the tropical regions of the planet, this variety has been well preserved (Detienne & Chanson, 1996; Turner, 2001). Nonetheless, the majority of species have values that are quite near to the mean (Detienne & Chanson 1996). It was demonstrated by Chave et al. (2006) and Maniatis et al. (2011) that species differences in WD were bigger than those between them. With differences between shade-tolerant and light-demanding species (Chave et al. 2009; King et al. 2005). Light-demanding species are thought to require investment in denser wood to survive in a mature forest when there is greater competition for light since they are so sensitive to light exposure (Nock et al. 2009; Wiemann & Williamson 1988). In general, the fast growth of light-demanding species in the early stages is often associated with the production of softwood with low density (Woodcock & Shier 2002; Nock et al. 2009), in contrast with shade-tolerant species produced denser wood and grow very slowly (Woodcock & Shier 2002). Thought to offer a competitive edge, this relationship between density and growth can actually shorten a tree's lifespan (Wiemann & Williamson 1988). Greater resistance to physical harm and dangerous infections is induced by high values of WD (Putz et al. 1983; King et al. 2006; Chao et al. 2008). Together with a tree's vertical profile (Henry et al. 2010; Wassenberg et al. 2014) and radial profile, WD can also reveal changes inside the tree (Henry et al. 2010; Plourde et al. 2015; Osazuwa-Peters et al. 2014; Lehnebach et al.2018). Within specific trees, WD can also vary radially from pith to bark (Wiemann & Williamson 1988; 1989; Henry et al. 2010; Hietz et al. 2013). These density variations across a pith-to-bark profile are thus a good indicator of the variations of the fibres' anatomy and the abruptness of the change in wood anatomical structure.
The three goals of this study were to: (1) compare wood density (WD) between and within nine harvested tropical tree species; (2) find out how leaf phenology and shade tolerance may affect potential changes in WD; and (3) assess the discrepancy between estimated WD and database values.
## II. MATERIALS AND METHODS
### a) Study Site
The study was conducted around the city of Gari-Gombo in the eastern region of Cameroon. Stem discs were collected inside the 2013 cutting block in the Forest Management Unit (FMU) 10 025 of the "Societe Forestiere Industrielle de la Lokoundjié (SFIL)" of the Decolvenaere Group Cameroon (DC). This FMU has been partially or fully exploited previously (1990-1997); its approximate boundaries are $3^{\circ}30'$ N and $3^{\circ}55'$ N latitudes and $14^{\circ}45'$ E and $15^{\circ}00'$ E longitudes. Its area is 49 595 ha, and the area of the 2013 cutting block (3-3) is 1586 ha (SFIL 2009). Soils are mainly ferralitic type, reddish-brown to yellow (Jones et al. 2013), and rest on a geological base consisting of metamorphic rocks with a high content of clay oxides iron and aluminum, formed from materials such as mica schists and chlorous schists (Martin & Segalen 1966). The climate of the site is equatorial rainforest, fully humid (Koppen 1936), with a unimodal rainfall distribution and a dry season from December to February: monthly rainfall less than 60mm (Worbes 1995). Rainfall amounts vary between nearby weather stations. The Yokadouma (85 km to the southeast of the study area) has four seasons, including a long dry season (mid-November to mid-March). The average annual rainfall is 1471.78 mm, and the annual average temperature is about 24 °C (21.94-24.56 °C). The annual average air humidity is 80 percent, with ranges of elevation between 600 and 680 meters above sea level. (Fig. 1.)
 Fig. 1: a. Map of Study Site: 2013 cutting block (hatched) of Forest Management Unit 10 025 (wheat), the neighboring Forest Management Unit (pink), and the major village are also shown, b. the climate diagram for the meteorological station in Yokadouma town (1961-2013), c. the inlay shows the location of the study site in Cameroon
The vegetation of the region is the Guineocongolese dense forest (White 1983). For Letouzey (1968), FMU 10 025 is in the transition zone between dense, moist evergreen forest and semi-evergreen forest. This FMU was certified by the Forest Stewardship Council (FSC) until 2014, and now it only has a traceability and legality certificate. This study concerned nine legally harvested tree species. In 2013 cutting block of Forest Management Unit 10 025 of SFIL-GDC logging company (SFIL 2009). The selection of these species was based on their commercial potential, the availability of the resource, and the visibility of growth rings among the eighteen species harvested
### b) Study Species
The following species were examined: Afzelia bipendensis Harms, Cyllicodiscus gabunensis Harms, Erythrophleum suaveolens A. Chev. and Pterocarpus soyauxii Taub. (Fabaceae); Entandrophragma cylindricum Sprague and Entandrophragma utile (Dawe & Sprague) Sprague (Meliaceae); Milicia exselsa (Welw.) C. C. Berg (Moraceae); Mansonia altissima (A. Chev.) A. Chev. and Triplochiton scleroxylon K.Schum (Malvaceae) (Amougou et al. 2022). The specific wood density was extracted from the Global Wood Density Database (Chave et al. 2009; Zanne et al. 2009). Leaf phenology at the adult stage, regeneration guilds (Hawthrone 1995; Bénédet et al. 2019), and dispersal mode (Hawthrone 1995) at the species level.
### c) Tree Logging and Sample Collection
Tree DBH was measured before trees were felled by a diameter tape. One stem disc was collected at the base of the trunk of each tree (around $0.5\mathrm{m}$ from the ground or more if buttresses were observed). All stem discs were collected with a chainsaw and immediately they were divided into two halves and each half was divided into three fragments by ensuring that all parts of the stem discs were taken (pith-to-bark). Randomly, a total of 20 fragments of stem discs were collected: 3 fragments of stem discs for M. excelsa, P. soyauxii, and T. scleroxylon; 2 for A. bipendensis, C. gabunensis, E. cylindricum, E. ivorensis, and 1 for E. utile. The samples were transported by plane to the Royal Museum of Central Africa in Tervuren, Belgium, where they received unique Tervuren wood (Tw) identification numbers and were stored in the Xylarium. (Table 1).
Table 1: List of the 9 Studied Species with Their Botanical Family, Commercial Name, and Local Name, Tervuren Wood Identification Number (Tw); Diameter at Breast Height (DBH) of the Sampled Tree; Wood Density at the Species Level (Zanne et al. 2009), Dispersal Mode (Meunier et al. 2015), for the Regeneration Guild, P: Pioneer, NPLD: Non-Pioneer Light Demander, and SB: Shade Bearer, and for the Leaf Phenology, Dec.: Deciduous, Brevi: Brevideciduous, and ev.: Evergreen (Bénédet et al. 2019)
<table><tr><td>Species</td><td>Family</td><td>Commercial/Local name</td><td>Tw number</td><td>DBH (cm)</td><td>Specific wood density (g.cm3)</td><td>Dispersa I mode</td><td>Regenerati on guild</td><td>Phenology</td></tr><tr><td>Afzelia bipendensis</td><td>Fabaceae</td><td>Doussié/M'banga</td><td>Tw65080, Tw69081</td><td>85</td><td>0.73 ± 0.05</td><td>Animal</td><td>NPLD</td><td>Dec.</td></tr><tr><td>Cylicodiscus gabunensis</td><td>Fabaceae</td><td>Okan/Adoum</td><td>Tw65078, Tw69079</td><td>65</td><td>0.79 ± 0.07</td><td>Wind</td><td>NPLD</td><td>Brevi.</td></tr><tr><td>Entandrophrag ma cylindricum</td><td>Meliaceae</td><td>Sapele/Assié</td><td>Tw65076, Tw69077</td><td>115</td><td>0.57 ± 0.04</td><td>Wind</td><td>NPLD</td><td>Dec.</td></tr><tr><td>Entandrophrag ma utile</td><td>Meliaceae</td><td>Sipo/Asseng-Assié</td><td>Tw65086</td><td>84</td><td>0.54 ± 0.04</td><td>Wind</td><td>NPLD</td><td>Dec.</td></tr><tr><td>Erythropleum suaveolens</td><td>Fabaceae</td><td>Tali/Elon</td><td>Tw65082, Tw65083</td><td>52</td><td>0.77 ± 0.06</td><td>Unassiste d</td><td>P</td><td>Dec.</td></tr><tr><td>Mansonia altissima</td><td>Malvaceae</td><td>Bêté/Koul</td><td>Tw65084, Tw69085</td><td>64</td><td>0.56 ± 0.03</td><td>Wind</td><td>NPLD</td><td>Dec.</td></tr><tr><td>Milicia excelsa</td><td>Moraceae</td><td>Iroko/Abang</td><td>Tw65067, Tw67068, Tw67069</td><td>102</td><td>0.58 ± 0.06</td><td>Animal</td><td>P</td><td>Dec.</td></tr><tr><td>Pterocarpus soyauxii</td><td>Fabaceae</td><td>Padouk/Mbel</td><td>Tw65073,Tw65 074, Tw65075</td><td>62</td><td>0.66 ± 0.07</td><td>Wind</td><td>NPLD</td><td>Brevi.</td></tr><tr><td>Triplochiton scleroxylon</td><td>Malvaceae</td><td>Ayous/Ayus</td><td>Tw65070, Tw69071, Tw69072</td><td>92.1</td><td>0.33 ± 0.03</td><td>Wind</td><td>P</td><td>Dec.</td></tr></table>
### d) Assignment of radial position
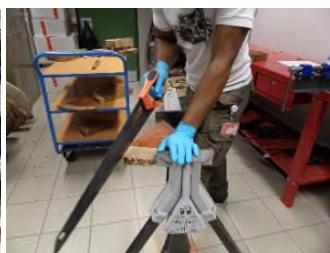
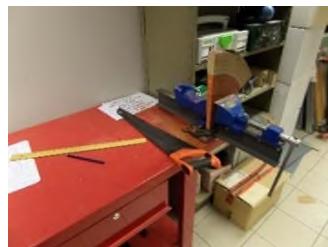
On the longest radius section of the fixed fragment of the stem disc (i.e., bark to pith), a piece of 1 cm wide wood was extracted from each stem disc using different hand saws (basic, flat, Japanese, splitter, hack, coping, and square) and two clamps (fixed and mobile) (Fig. 2.a, b, c). This piece of 1 cm was immobilized in a fixed clamp and cut using the same saws into ten (10) small pieces of roughly the same size, reporting the Tw number of the stem disc followed by the numbers 1 (at the bark piece) to 10 (at the pith piece) from the bark-to-the-pith for the ten small pieces (Fig. 2.d). Finally, using chisels and a wooden mallet, these small pieces were finely carved on the sides to have uniform pieces (Fig. 2.d.).
 Panel label: a.
 Panel label: b.
 Panel label: C.
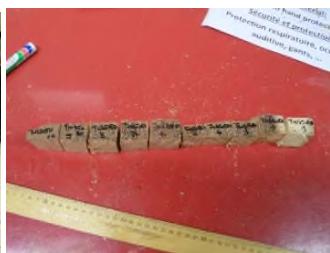 d Fig. 2: Preparation of Wood Fragments for Density Testing, a. Various Saws and a Fixed Clamp, b. Removal using a Saw of a 1 cm Fragment Lamella on the Longest Section Held Fixed on a Mobile Clamp, C. Removal Using a Saw of a 1 cm Fragment Lamella on the Longest Section of a Fragment of Stem Disc Held Fixed on an Immobile Clamp, and d. 1 cm Fragment Slice Taken, Subdivided, and Numbered from 1 to 10 in Direction (Bark-to-Pith)
### e) Density Determination
Density tests were performed on these smaller fragments (pieces). The methodology used for these tests was water displacement, and it was based on the Archimedes principle by displacement water: the volume of a sample is estimated by the mass of the volume that is moved while the sample is immersed in deionized water, according to (Olesen 1971; Williamson & Wiemann 2010). This method is also called the hydrostatic method.
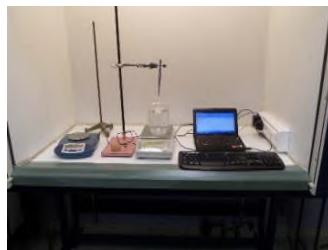
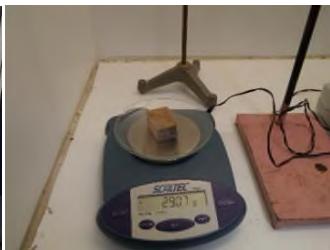
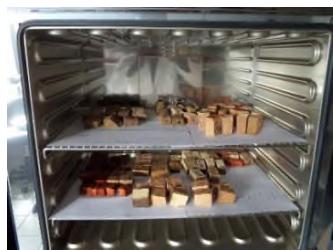
To regain its green condition, the small piece of wood (that had naturally dried) was immersed or soaked in a container filled with demineralized water for a few minutes to the point of saturation of the fibers. This container was under a digital balance, SCLATECSPB53 (max. 610; 0.01 g precision), and was calibrated and tared before and after measurement in the digital balance (Fig.3. a, b.). And those samples were immediately weighed. Then the dry weight or mass was obtained by introducing the samples to a Memmert UN75 oven for $48\mathrm{h}$ (2 h at $60^{\circ}\mathrm{C}$, 4 h at $80^{\circ}\mathrm{C}$, and 42 h at $103^{\circ}\mathrm{C}$ ) (Fig.3.b,c.). To achieve constant mass, the oven temperature is gradually increased. To avoid the risks of burst or cracked samples, the dry weights were immediately taken out of the oven. At ambient moisture within the wood laboratory in the RMCA-Tervuren, it was 8 percent. To avoid a constant dry weight, samples were measured on a digital balance $\mathrm{KERN}_{572}$ (up to 2,100 g; 0.1 g) three times successively (Fig. 3.a.).
 Panel label: a.
 Panel label: b.
 Panel label: C.
 d Fig. 3: Process of Density Tests a. Experimental Apparatus; b. Weighing Of Sub-Fragments To Obtain Fresh Mass; c. Removal of Fragments Dried in an Oven for Weighing of Dry Mass; and d. Drying of Wood Fragments in an Oven for 48 Hours
Using the formula, wood-specific gravity was computed as the ratio of each wood's dry mass to its corrected dry volume (Williamson & Wiemann 2010a).
$$
\operatorname{WSG}(8\%) = (\operatorname{Md}) / (\operatorname{Vcd})
$$
$$
\left\llbracket W_{\mathrm{SG}}\right\rrbracket_{(8\%)} = (M_{\mathrm{d}}) / (V_{\mathrm{cd}})
$$
Where Wsd is the wood-specific gravity in g/cm3, Md is the anhydrous weight in g, and Vcd is the corrected dry volume in cm3.
## III. RESULTS
### a) Wood Density Intra and Inter-Radial Variation
ANOVA test results $(P > 0.05)$ showed that there was radial variation in wood density (WD) for each tree species and between tree species. These inter- and intra-specific radial variations in WD were as follows: A. bipendensis range, 0.65-0.75 g.cm3; and the average were $0.70 \pm 0.05$ g.cm3; C. gabunensis range, 0.65-0.93 g.cm3; and the average were $0.79 \pm 0.14$ g.cm3; E. cylindricum range, 0.64-0.74 and the average were 0.
$69 \pm 0.05 \, \text{g.cm}^3$; $E$. utile range, 0.51-0.58 and the average were $0.55 \pm 0.03 \, \text{g.cm}^3$; $E$. suaveolens range, 0.78-0.84 $\text{g.cm}^3$ and the average were $0.81 \pm 0.03 \, \text{g.cm}^3$; $M$. altissima range, 0.61-0.65 $\text{g.cm}^3$ and the average were $0.63 \pm 0.08 \, \text{g.cm}^3$; $M$. excelsa range, 0.45-0.73 $\text{g.cm}^3$ and the average were $0.65 \pm 0.08 \, \text{g.cm}^3$; $P$. soyauxii range, 0.59-0.69 $\text{g.cm}^3$ and the average were $0.64 \pm 0.05 \, \text{g.cm}^3$ and finally for $T$. scleroxylon range, 0.37 - 0.63 $\text{g.cm}^3$ and the average were $0.44 \pm 0.07 \, \text{g.cm}^3$ (Fig.2).
The observation of variations in WD from bark-to-pith enabled three qualitative types of radial patterns to be distinguished (Fig. 2.). Type 1 was represented by a tree species in which WD increased from bark to pith: A. bipendensis. Type 2 corresponded to tree species in which WD decreased from the bark to the pith: C. gabunensis; E. cylindricum; E. utile; E.suaveolens; M. excelsa; and P. soyauxii. And type 3 was represented by tree species in which WD values were substantially equal from bark-to-pith: M. altissima and T. scleroxylon (Figure 3, Table 2).
At the family species level, there was a significant difference between the WD of Fabaceae: $E.$ suaveolens, with a WD of $0.81 \pm 0.03 \, \text{g.cm}^3$, was less similar to the WD of $C.$ gabunensis $(0.79 \pm 0.14 \, \text{g.cm}^3)$, and those two timber tree species were not similar with WD of $A.$ bipendensis $(0.70 \pm 0.05 \, \text{g.cm}^3)$ and with WD of $P.$ soyauxii $(0.64 \pm 0.05 \, \text{g.cm})$, who is less dense wood species in this family. There was also a significant difference in the WD of Meliaceae: $E.$ cylindricum with a WD of $(0.69 \pm 0.05 \, \text{g.cm}^3)$ which was not similar to the WD of $E.$ utile $(0.55 \pm 0.03 \, \text{g.cm}^3)$. The WD of Moraceae was only for $M.$ excelsa $(0.65 \pm 0.08 \, \text{g.cm}^3)$. And finally, there was also a significant difference between WD Malvaceae (M. altissima with a WSG of $0.63 \pm 0.02 \, \text{g.cm}^3)$ and WD T. scleroxylon $(0.44 \pm 0.07 \, \text{g.cm}^3)$ (Figure 3).
These timber tree species were classified into three leaf phenological types: brevidiciduous, deciduous, and evergreen for drought tolerance (Bénédet et al. 2019). All these nine timber tree species were deciduous and were classified as heavy for the lower WSG: E. suaveolens $(0.81 \pm 0.03 \mathrm{~g} \cdot \mathrm{cm}^{3})$; C. gabunensis $(0.79 \pm 0.14 \mathrm{~g} \cdot \mathrm{cm}^{3})$; A. bipendensis $(0.70 \pm 0.05 \mathrm{~g} \cdot \mathrm{cm}^{3})$; E. cylindricum $(0.69 \pm 0.05)$; P. soyauxii $(0.64 \pm 0.05 \mathrm{~g} \cdot \mathrm{cm}^{3})$; M. altissima $(0.63 \pm 0.02)$; M. exselsa $(0.58 \pm 0.06 \mathrm{~g} \cdot \mathrm{cm}^{3})$; E. utile $(0.55 \pm 0.03 \mathrm{~g} \cdot \mathrm{cm}^{3})$; and T. scleroxylon $(0.44 \pm 0.07 \mathrm{~g} \cdot \mathrm{cm}^{3})$. Particularly A. bipendensis, C. gabunensis, E. cylindricum, E. utile, and E. suaveolens were all deciduous; meanwhile, C. gabunensis and P. soyauxii were brevidiciduous (Table 1; Table 2).
At the level of light requirement succession, these timber tree species were classified into three regeneration guilds: pioneer, non-pioneer light demander, and shade bearer (Hawthrone 1995; Bénédet et al. 2019). The pioneer species were: E. suaveolens, with its highest wood density $(0.81 \pm 0.03\mathrm{g.cm}^3)$; M. excelsa, with its medium wood density $(0.65 \pm 0.08\mathrm{g/cm}^3)$; and T. scleroxylon, with its weakest wood density $(0.44 \pm 0.07\mathrm{g.cm}^3)$. And non-pioneer light demander species were: C. gabunensis, with its very highest wood density $(0.79 \pm 0.14\mathrm{g.cm}^3)$; A. bipendensis, with its highest wood density $(0.70 \pm 0.05\mathrm{g.cm}^3)$; E. cylindricum, with its highest wood density $(0.69 \pm 0.05\mathrm{g.cm}^3)$; P. soyauxii, with its medium wood density $(0.64 \pm 0.05\mathrm{g.cm}^3)$; M. altissima, with its medium wood density $(0.63 \pm 0.02\mathrm{g.cm}^3)$ and E. utile, with its lowest wood density $(0.55 \pm 0.03\mathrm{g.cm}^3)$ (Table 1; Table 2)
### c) Comparison between Estimated Wood Density and Database Values
The difference was not significant between the calculated and measured WD and those of the Global Wood Density Database (Zane et al. 2009), particularly for tree species who's calculated WD were lower than the WD of the GWDD base: A. bipendensis, $0.70 \pm 0.05 / 0.73 \pm 0.05\mathrm{g.cm}^3$; P. soyauxii, $0.64 \pm 0.05 / 0.66 \pm 0.07\mathrm{g.cm}^3$. The calculated WD were greater than the WD value of the GWDD: E. utile, $0.55 \pm 0.03 / 0.54 \pm 0.04\mathrm{g.cm}^3$. And the calculated WSG were equal to the WD of the GWDD: C. gabunensis, $0.79 \pm 0.14 / 0.79 \pm 0.07\mathrm{g.cm}^3$. In contrast, the difference was very significant for the following species: E. cylindricum 0.69 $\pm 0.05 / 0.57 \pm 0.04\mathrm{g.cm}^3$; E. suaveolens $0.81 \pm 0.03 / 0.77 \pm 0.06\mathrm{g.cm}^3$; M. altissima $0.63 \pm 0.02 / 0.56 \pm 0.03\mathrm{g.cm}^3$; M. excelsa $0.65 \pm 0.08 / 0.58 \pm 0.06\mathrm{g.cm}^3$ and T.scleroxylon $0.44 \pm 0.07 / 0.33 \pm 0.03\mathrm{g.cm}^3$ (Table 2).
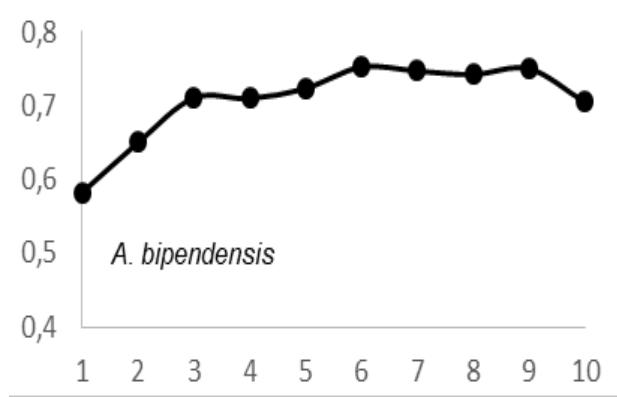
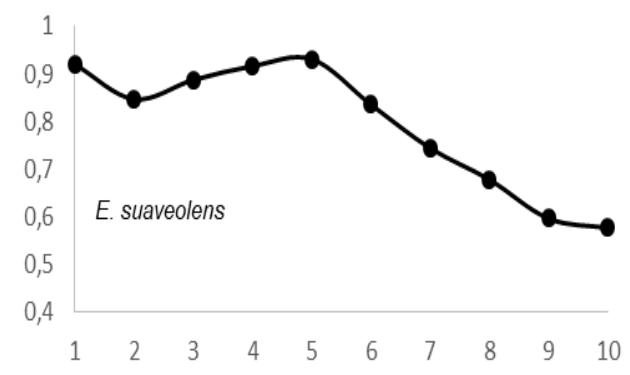
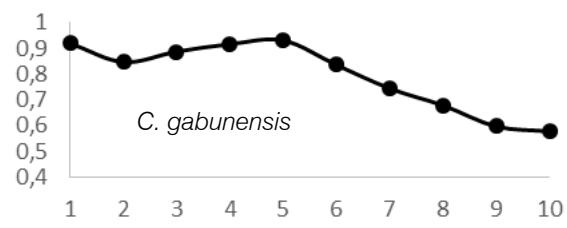

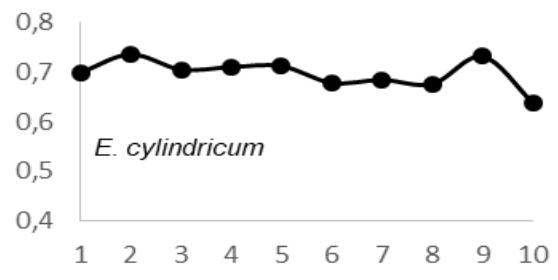
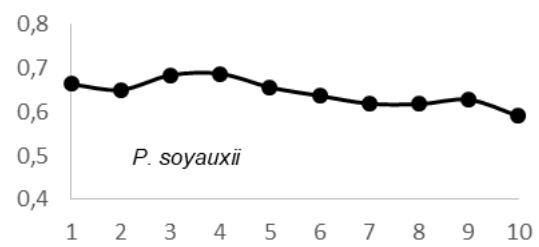
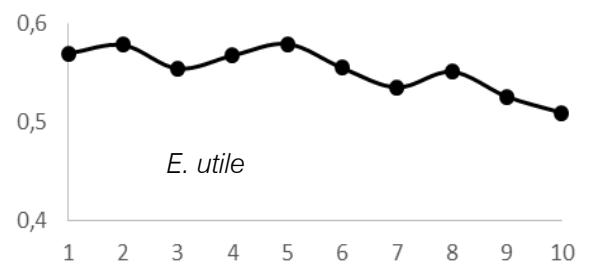
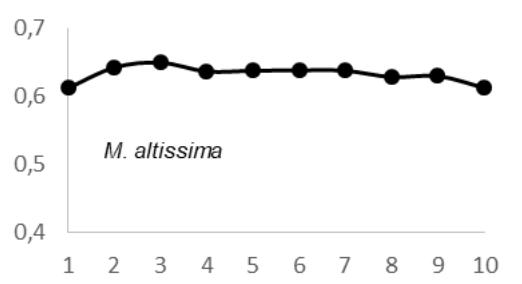
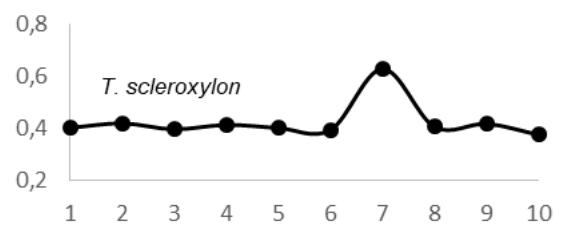 Fig. 4: Variation in Wood Density Measured (G.Cm- $^{3}$ ) at 8 Percent Moisture Content Along the Distance from Bark (1) to Pith (10) for the 09 Species Investigated in SFIL, Cameroon
### d) Comparison between Estimated Wood Density and Database Values
The difference was not significant between the calculated/measured WD and those of the Global Wood Density Database (Zane et al. 2009), particularly for tree species who's calculated WD were lower than the WD of the GWDD base: A. bipendensis 0.70 ( $\pm 0.05$ ) / 0.73 $\pm 0.05$ g.cm $^3$; P. soyauxii 0.64 ( $\pm 0.05$ ) / 0.66 $\pm 0.07$ g.cm $^3$; the calculated WD were greater than the WD of the GWDD and E.utile 0.55 ( $\pm 0.03$ ) / 0.54 $\pm 0.04$ g.cm $^3$ and the calculated WSG were equal to the WD of the GWDD C. gabunensis 0.79 ( $\pm 0.14$ ) / 0.79 $\pm 0.07$
g.cm3. And in contrast, the difference was very significant for the following species: E. cylindricum 0.69 (± 0.05) / 0.57 ± 0.04; E. suaveolens 0.81 (± 0.03) / 0.77 ± 0.06 g.cm3; M. altissima 0.63 (± 0.02) / 0.56 ± 0.03 g.cm3; M. excelsa 0.65 (± 0.08) / 0.58 ± 0.06 g.cm3 and T. sclexylon 0.44 (± 0.07) / 0.33 ± 0.03 g.cm3 (Table 2).
Table 2: WD of the Measured Samples Per Species Compared to the WD Values in the GWDD. WD Values from the GWDD Were Taken for Species Occurring in Africa, as the Measured Species all Originate From Central Africa. an Asterisk (\*) Next to a Species Name Indicates a Significant Difference (P < 0.05) Between the Mean of the Measured Values and the Mean of That Species in the GWDD
<table><tr><td>Species</td><td>No. Samples/Ste m discs measured</td><td>Average WD ± STD (g.cm-3) at humidity 8%</td><td>Range WD (g.cm-3) [Min-Max]</td><td>No. values are given in GWDD</td><td>WD value GWDD ± STD (g.cm-3)</td><td>WD value GWDD ran ge (g.cm-3)</td></tr><tr><td>Afzelia bipendensis(Fabaceae)</td><td>01/02</td><td>0.70 (±0,05)</td><td>[0.65 - 0.75]</td><td>11</td><td>0.73 ± 0.05</td><td>0.66 - 0.82</td></tr><tr><td>Cyllicodiscus gabunensis(Fabaceae)</td><td>01/02</td><td>0.79 (±0.14)</td><td>[0.65 - 0.93]</td><td>18</td><td>0.79 ± 0.07</td><td>0.62 - 0.97</td></tr><tr><td>Entandrophragma cylindricum(Meliaceae)*</td><td>01/02</td><td>0.69 (±0.05)</td><td>[0.64 - 0.74]</td><td>16</td><td>0.57 ± 0.04</td><td>0.50 - 0.63</td></tr><tr><td>Entandrophragma utile(Meliaceae)</td><td>01/01</td><td>0.55 (±0.03)</td><td>[0.51 - 0.58]</td><td>18</td><td>0.54 ± 0.04</td><td>0.44 - 0.58</td></tr><tr><td>Erythropheum suaveolens(Fabaceae)*</td><td>01/02</td><td>0.81 (±0.03)</td><td>[0.78 - 0.84]</td><td>20</td><td>0.77 ± 0.06</td><td>0.69 - 0.87</td></tr><tr><td>Mansonia altissima(Malvaceae)*</td><td>01/03</td><td>0.63 (±0.02)</td><td>[0.61 - 0.65]</td><td>23</td><td>0.56 ± 0.03</td><td>0.47 - 0.63</td></tr><tr><td>Milicia excelsa(Moraceae)*</td><td>01/03</td><td>0.65 (±0.08)</td><td>[0.45 - 0.73]</td><td>24</td><td>0.58 ± 0.06</td><td>0.44 - 0.67</td></tr><tr><td>Pterocarpus soyauxii(Fabaceae)</td><td>01/03</td><td>0.64 (±0.05)</td><td>[0.59 - 0.69]</td><td>14</td><td>0.66 ± 0.07</td><td>0.57 - 0.81</td></tr><tr><td>Triplochiton scleroxylon(Malvaceae)*</td><td>01/03</td><td>0.44 (±0.07)</td><td>[0.37 - 0.63]</td><td>24</td><td>0.33 ± 0.03</td><td>0.28 -0.41</td></tr></table>
## IV. DISCUSSION
### a) Wood Density Intra and Inter-Radial Variation
The first aim of our study was to compare the variation in WD among and within nine harvested tropical tree species, including radial variation within individuals. At the light of this analysis conducted on stem discs. This results show that specie's explained most wood density radial variance whereas individuals explained only a minor part from pith-to-bark. These results were consistent with previous observations in different part of world (Parolin 2002 Woodcock & Sheir 2002; Nock et al. 2009; Onada et al. 2010; Hietz et al. 2013; Osazuwa-Peters et al. 2014; Bastin et al. 2015; Plourde et al. 2015; Lehnebach et al. 2019). And globally among tropical tree species (Zanne et al. 2009). Importantly, the WD values between 0.44 and $0.81\mathrm{g.cm}^{-3}$ from this present study were within the range (0.11 to $1.39\mathrm{g.cm}^{-3}$ ) reported for 2,456 tropical forest tree species (Chave et al. 2006). The differences in WD between our study and other studies may be due to aspects of the growing environment (biotic and abiotic) factors.
Particularly, the observation of variations in WD from bark to pith enabled three qualitative types of radial patterns to be distinguished. Type 1 was represented by a tree species in which WD increased from bark to pith: A. bipendensis. Type 2 corresponded to tree species in which WD decreased from the bark to the pith: C. gabunensis; E. cylindricum; E. utile; E.suaveolens; M. excelsa; and P. soyauxii. And type 3 was represented by tree species in which WD values were substantially equal from bark-to-pith: M. altissima and T. scleroxylon. These results confirms the effect of heartwood on WD radial variations already suspected (Parolin 2002; Hietz et al. 2013).
These findings contrast with the bulk of studies on WD radial variations (Parolin 2002; Woodcock & Sheir 2002; Nock et al. 2009; Hietz et al. 2013; Osazuwa-Peters et al. 2014; Plourde et al. 2015), which reported both negative and positive gradients. We presume that this difference is mainly due to the failure to take into account the presence of heartwood that was previously hypothesized by several authors (Parolin 2002; Hietz et al. 2013).
Wood density profiles with a decreasing trend from bark to pith and a low wood density were not systematic for pioneer and non-pioneer light-demanding species, but our results demonstrated that the pioneer species $E$ suaveolens showed the very highest wood density value, the second highest wood density value was for $C$ gabunensis, and the lowest wood density value was found for the pioneer species $T$ sceroxylon. For the nine tree species studied, this assertion was true For the nine tree species studied, this assertion was true for Type 2: C. gabunensis; E. cylindricum; E. utile; E. suaveolens; M. excelsa and P.soyauxii. The opposite shade-tolerant species systematically showed high wood density values. In our study, shade-tolerant species were not available. But Chao et al. (2008) and King et al. (2006) formulated the hypothesis that slow-growing species that invest in dense wood were shade-tolerant, in particular during the early stages of their lives. Other studies also reported that shade tolerant species tend to have a much higher WD than do pioneer species (King et al. 2006; Ramananantoandro et al. 2016). One explanation were that pioneer species produce a low WD to grow taller than their neighbors, thereby acquiring more resources (i.e., light) quickly (Woodcock & Shier 2002). The observations of these six listed tree species were unlikely to persist in old-growth forests, supporting the assumption that strictly light-demanding species present decreasing trends in wood density from bark to pith (Nock et al. 2009; Wiemann & Williamson 1988). Type 1: A. bipendensis presents an increasing trend in wood density from bark-to-pith. This observation was confirmed by Woodcock & Shier (2002), who corroborated that the increase in wood density from bark-to-pith is often attributed to increased light exposure and improved growth conditions in the later stages. With possible access to the canopy for some trees during ontogeny (Brienen & Zuidema 2006). All of this supports the idea that a species' regeneration guild may differ between places (Hawthorne 1985) and should only be assigned with care. This finding emphasises the significant correlation between wood density and regeneration guild and backs up the notion of a comprehensive wood economic spectrum (Chave et al. 009).
It's clear that the evergreen species invest in denser wood, the production of this denser wood induct the difficulty of detection of tree ring boundaries in wood samples of this species. And the evergreen species growth in entire year and during the drought periods. All these nine studied timber tree specie's, were deciduous, and there were no a significant difference between them (brevidecidious and deciduous). Only two: C. gabunensis and $P$ soyauxii were brevidecidious with a second highest density for C. gabunensis: $0.79 \pm 0.14$ g.cm3. The other seven timber tree species were deciduous with highest density for E. suaveolens $0.81 \pm 0.03$ g.cm3; and lowest density for T. scleroxylon $0.44 \pm 0.07$ g.cm3. At the light of this exception and results, it's appeared clear that brevidecidious present more heavy wood than deciduous species.
### c) Comparison between Different Wood Densities
The specific wood density of A. bipendensis in this study is 83 percent lower than the value obtained by (Sallenave 1964; 1971), 96 percent lower than that obtained by Zanne et al. (2009), and 106 percent higher than that obtained by Fayolle et al. (2013). For C. gabunensis, these values were 94 percent lower than those of Sallenave (1955) and were equal to the value obtained by Zanne et al. (2009). In $E$ cylindricum, they were equal to the value obtained by Sallenave (1955), 113 percent higher than those of Fayolle et al. (2013), and 121 percent higher than those of Zanne et al. (2009). For $E$ utile, the value obtained was 80 percent lower than that of Sallenave (1955), 91 percent lower than that of Sallenave (1964), and 101 percent higher than that of Zanne et al. (2009). The WD value of $E$ suaveolens was 102 percent higher than Sallenave (1971), 82 percent lower than the value of Fayolle et al. (2013), and 105 percent higher than the value of Zanne et al. (2009). In $M$ altissima, the WD values obtained in this study were 106 percent higher than those of Sallenave (1964), 85 percent lower than those of Fayolle et al. (2013), and 112 percent higher than the value of Zanne et al. (2009). In $M$ excelsa, they were 103 percent higher than those of Sallenave (1964) and 112 percent higher than those of Zanne et al. (2009). The WD value in $P$ soyauxii was 95 percent lower than that of Sallenave (1964) and 97 percent lower than that of Zanne et al. (2009). Finally, the WD values obtained in $T$ scleroxylon were 118 percent higher than those of Sallenave (1955), 125 percent higher, and 133 percent higher, respectively, than those of Fayolle et al. (2013) and Zanne et al. (2009).
## V. CONCLUSION
In this study, we characterised detailed bark-topith WD profiles between and within nine harvested tropical tree species. Our study on WD radial gradients in Congo Basin tropical tree species showed an exclusively significant positive, neutral, and negative pith-to-bark WD gradient. These unique, site-specific details are not included in the global databases that are currently in use, which could result in assessments of species' functional attributes and estimates of tree biomass that are inadequate and erroneous.
We advise extreme caution when performing meta-analyses based on global functional trait databases to prevent mistakes brought on by insufficient data collection and storage. Regional biomass estimates will be improved, and our understanding of the functional strategies and successional behaviour of tropical tree species will be increased by future studies documenting trends in WD variance in new locations and forest types.
Particularly, this study recommends that future studies of wood density include the analysis of the effect of vertical variation with long-term phenological data and anatomical analysis in the same species and use a large sampling size including individuals of both the same and different species to facilitate the analysis of the radial and vertical structure.
### ACKNOWLEDGEMENTS
The authors are greatly thankful to the SFIL-GDC logging company for their support during the study. Particularly, we would like to thank the owner's brothers Guy and Freddy Decolvenaere. We also thank the SFIL-GDC staff in Ndeng, especially Jean Claude Bounougou Zibi and Isaac Hayache whose efforts substantially facilitated our fieldwork campaigns. This study was supported by the Royal Museum for Central Africa (RMCA) funded by Belgian Development Cooperation.
Generating HTML Viewer...
References
57 Cites in Article
Amougou Ndi,Y Mbolo,M,Amougou Amougou,F,Ndongo Din (2022). Potentiel d'analyse des cernes de croissance: cas de 09 essences forestières en Afrique Centrale.
(2011). ASTM D2395 -07ae1 Standard test methods for specific gravity of wood and wood-based materials.
Jean-François Bastin,Adeline Fayolle,Yegor Tarelkin,Jan Van Den Bulcke,Thales De Haulleville,Frederic Mortier,Hans Beeckman,Joris Van Acker,Adeline Serckx,Jan Bogaert,Charles De Cannière (2015). Wood Specific Gravity Variations and Biomass of Central African Tree Species: The Simple Choice of the Outer Wood.
Hans Beeckman (2016). WOOD ANATOMY AND TRAIT-BASED ECOLOGY.
F Bénédet,J Doucet,A Fayolle,S Gourlet-Fleury,D Vincke (2019). Cofortraits, African Plant Traits Information Database.
Roel Brienen,Pieter Zuidema (2006). Lifetime growth patterns and ages of Bolivian rain forest trees obtained by tree ring analysis.
Kuo‐jung Chao,Oliver Phillips,Emanuel Gloor,Abel Monteagudo,Armando Torres‐lezama,Rodolfo Martínez (2008). Growth and wood density predict tree mortality in Amazon forests.
J Chave,C Andalo,S Brown,M Cairns,J Chambers,D Eamus,H Fölster,F Fromard,N Higuchi,T Kira,J-P Lescure,B Nelson,H Ogawa,H Puig,B Riéra,T Yamakura (2005). Tree allometry and improved estimation of carbon stocks and balance in tropical forests.
Jerome Chave,Richard Condit,Salomon Aguilar,Andres Hernandez,Suzanne Lao,Rolando Perez (2004). Error propagation and scaling for tropical forest biomass estimates.
Jerome Chave,David Coomes,Steven Jansen,Simon Lewis,Nathan Swenson,Amy Zanne (2009). Towards a worldwide wood economics spectrum.
Jérôme Chave,Helene Muller-Landau,Timothy Baker,Tomás Easdale,Hans Steege,Campbell Webb (2006). REGIONAL AND PHYLOGENETIC VARIATION OF WOOD DENSITY ACROSS 2456 NEOTROPICAL TREE SPECIES.
T De Mil,Y Tarelkin,S Hahn,W Hubeau,V Deklerck,O Debeir,Van Acker,J,De Cannière,C Beeckman,H Van Den Bulcke,Jan (2018). Wood density profiles and their corresponding tissue fractions in tropical angiosperm trees.
Pierre Détienne,Bernard Chanson (1996). L'éventail de la densité du bois des feuillus. Comparaison entre différentes régions du monde.
A Fayolle,J Doucet,J Gillet,N Bourland,P Lejeune (2013). Tree allometry in Central Africa: Testing the validity of pantropical multi-species allometric equations for estimating biomass and carbon stocks.
W Hawthorne (1995). Burtt Davy, Joseph, (7 March 1870–20 Aug. 1940), Mem. Soc. Bot. France; Mem. Linn. Soc. Lyon; Mem. Linn. Soc. Bordeaux; University Demonstrator in Forestry, Oxford; Lecturer in Tropical Forest Botany, Imperial Forestry Institute, Oxford.
Peter Hietz,Renato Valencia,S Joseph Wright (2013). Strong radial variation in wood density follows a uniform pattern in two neotropical rain forests.
M Henry,A Besnard,W Asante,J Eshun,S Adu-Bredu,R Valentini,M Bernoux,M Saint-André (2010). Wood density, phytomass variations within and among trees, and allometric equations in a tropical rainforest of Africa.
R Houghton,R Boone,J Melillo,C Palm,G Woodwell,N Myers,B Moore,D Skole (1985). Net flux of carbon dioxide from tropical forests in 1980.
A Jones,H Breuning-Madsen,M Brossard,A Dampha,J Deckers,O Dewitte,T Gallali,S Hallett,R Jones,M Kilasara (2013). Soil atlas of Africa.
Q Ketterings,R Coe,M Van Noordwijk,Y Ambagau,C Palm (2001). Reducing uncertainty in the use of allometric biomass equations for predicting above-ground tree biomass in mixed secondary forests.
D King,S Davies,Mnn Supardi,S Tan (2005). Tree growth is related to light interception and wood density in two mixed dipterocarp forests of Malaysia.
D King,S Davies,S Tan,Nsmd Noor (2006). The role of wood density and stem support costs in the growth and mortality of tropical trees.
W Köppen (1936). Die Klimate der Erde.
Barbara Lachenbruch,Katherine Mcculloh (2014). Traits, properties, and performance: how woody plants combine hydraulic and mechanical functions in a cell, tissue, or whole plant.
Romain Lehnebach,Julie Bossu,Stéphanie Va,Hélène Morel,Nadine Amusant,Eric Nicolini,Jacques Beauchêne (2018). Wood Density Variations of Legume Trees in French Guiana along the Shade Tolerance Continuum: Heartwood Effects on Radial Patterns and Gradients.
René-Gustave Letouzey (1968). Étude phytogéographique du Cameroun.
D Maniatis,L Saint André,M Temmerman,Y Malhi,H Beeckman (2011). The potential of using xylarium wood samples for wood density calculations: a comparison of approaches for volume measurement.
D Martin,P Segalen (1966). Notice explicative.
Mbassieyebe Josephalaure,Damarisenyegue Mandob,Noandouaclaude Cyrille (2017). PRÉVALENCE, CONNAISSANCES ATTITUDES ET RELATIVES A L’OBÉSITÉ DES FEMMES ENCEINTES PENDANT LES VISITES PRÉNATALES AU CENTRE DE SANTÉ MARIE IMMACULÉE D’ÉTOUG-ÉBÉ (YAOUNDÉ-CAMEROUN)..
Q Meunier,C Moumbogou,J Doucet (2015). Les Arbres Utiles du Gabon.
Charles Nock,Daniela Geihofer,Michael Grabner,Patrick Baker,Sarayudh Bunyavejchewin,Peter Hietz (2009). Wood density and its radial variation in six canopy tree species differing in shade-tolerance in western Thailand.
P Olesen (1971). The water displacement method: a fast and accurate method of determining the green volume of wood samples.
Yusuke Onoda,Anna Richards,Mark Westoby (2010). The relationship between stem biomechanics and wood density is modified by rainfall in 32 Australian woody plant species.
Oyomoare Osazuwa‐peters,S Wright,Amy Zanne (2014). Radial variation in wood specific gravity of tropical tree species differing in growth–mortality strategies.
A Panshin,C De Zeeuw (1970). Textbook of wood technology, Volume 1: structure, identification, properties, and uses of the commercial woods of the United States and Canada.
A Panshin,C De Zeeuw (1980). Textbook of wood technology: structure, identification, properties, and uses of the commercial woods of the United States and Canada.
Pia Parolin (2002). RADIAL GRADIENTS IN WOOD SPECIFIC GRAVITY IN TREES OF CENTRAL AMAZONIAN FLOODPLAINS.
Benjamin Plourde,Vanessa Boukili,Robin Chazdon (2015). Radial changes in wood specific gravity of tropical trees: inter‐ and intraspecific variation during secondary succession.
F Putz,P Coley,K Lu,A Montalvo,A Aiello (1983). Uprooting and snapping of trees: Structural determinants and ecological consequences.
Tahiana Ramananantoandro,Herimanitra Rafidimanantsoa,Miora Ramanakoto (2015). Forest aboveground biomass estimates in a tropical rainforest in Madagascar: new insights from the use of wood specific gravity data.
Tahiana Ramananantoandro,Miora Ramanakoto,Gabrielle Rajoelison,Jean Randriamboavonjy,Herimanitra Rafidimanantsoa (2016). Influence of tree species, tree diameter and soil types on wood density and its radial variation in a mid-altitude rainforest in Madagascar.
R Roque,M Filho (2007). Relationships between anatomical features and intra-ring wood density profiles in Gmelina arborea applying x-ray densitometry.
P Sallenave (1971). Propriétés Physiques et Mécaniques des Bois Tropicaux.
P Sallenave (1955). Propriétés Physiques et Mécaniques des Bois Tropicaux de l'Union Française.
P Sallenave (1964). Propriétés Physiques et Mécaniques des Bois Tropicaux.
H Aboubakar,J Ndongo,P Nyouma,M Aboubakar,P Biangoup Nyamsi,J Mare Njoya,K Mbassi Ndocko,S Ebana Mvogo,G Koki (2009). Résultats fonctionnels de la chirurgie de la cataracte dans quatre hôpitaux de référence à Douala au Cameroun.
Yegor Tarelkin,Thomas El Berkani,Hans Beeckman,Maaike De Ridder,Charles De Cannière,Claire Delvaux (2016). GROWTH-RING DISTINCTNESS AND BOUNDARY ANATOMY VARIABILITY IN TROPICAL TREES.
I Turner (2001). The Ecology of Trees in the Tropical Rain Forest.
M Wassenberg,H-S Chiu,W Guo,H Spiecker (2014). Analysis of wood density profiles of tree stems: incorporating vertical variations to optimize wood sampling strategies for density and biomass estimations.
F White (1983). The Vegetation of Africa. A Descriptive Memoir to accompany the UNESCO/AETFAT/UNSO Vegetation Map of Africa.
M Wiemann,G Williamson (1988). Extreme radial changes in wood specific gravity in some tropical pioneers.
M Wiemann,G Williamson (1989). Radial gradients in the specific gravity of wood in some tropical and temperate trees.
G Williamson,Michael Wiemann (2010). Measuring wood specific gravity…Correctly.
D Woodcock,A Shier (2002). Wood specific gravity and its radial variations: the many ways to make a tree.
Martin Worbes (1995). How to Measure Growth Dynamics in Tropical Trees a Review.
A Zanne,G Lopez-Gonzalez,D Coomes,J Ilic,S Jansen,S Lewis,R Miller,N Swenson,M Wiemann,J Chave (2009). Global wood density database.
No ethics committee approval was required for this article type.
Data Availability
Not applicable for this article.
How to Cite This Article
Yves Achille Amougou Ndi. 2026. \u201cWood Density Variations of Tropical Trees Differing in Shade-Tolerance and Leaf Phenology of the Congo Basin\u201d. Global Journal of Science Frontier Research - H: Environment & Environmental geology GJSFR-H Volume 23 (GJSFR Volume 23 Issue H2): .
Explore published articles in an immersive Augmented Reality environment. Our platform converts research papers into interactive 3D books, allowing readers to view and interact with content using AR and VR compatible devices.
Your published article is automatically converted into a realistic 3D book. Flip through pages and read research papers in a more engaging and interactive format.
Wood density (WD) is not only a key element in tropical forest ecology to estimate tree biomass but also an indicator of timber quality, and it integrates many aspects of tree mechanical properties and functioning. Notably, contrasting patterns of radial variation of WD have been demonstrated and are related to regeneration guilds (light-demanding vs. shadebearing) but haven’t been demonstrated to be related to leaf phenology (deciduous vs. evergreen). With the destructive method and the “archimed” principle, we investigated the WD radial variation of nine timber tree species harvested in the eastern region of Cameroon. The result showed that WD differed significantly among these nine species (P > 0.05).
Our website is actively being updated, and changes may occur frequently. Please clear your browser cache if needed. For feedback or error reporting, please email [email protected]
Thank you for connecting with us. We will respond to you shortly.