Earthquake prediction is a difficult task. Constrained within a certain spatiotemporal range, earthquakes are only a probability event. In a large area, predicting earthquakes based on geographical events that have already occurred is reliable. Predicting the duration of aftershocks under the condition that a major earthquake has already occurred is the research content of this article. Extract 6 features from seismic phase data to predict the aftershock period. We constructed a convolutional neural network model, sorted out 855 data from 1351 data, and trained the network. The accuracy of training verification reaches 90%, and the accuracy of testing reaches 100%. After further refinement, this model can be used to predict the duration of aftershocks in earthquakes. Provide data guidance for earthquake rescue.
## I. INTRODUCTION
An earthquake is a random event. A large number of earthquakes events have left behind rich observational data. With our understanding of natural laws, we may be able to identify the patterns of earthquakes from big data. Cattania et al. [Cattania, 2019] believe that earthquakes cannot be considered as an isolated event for research. To study the possibility of earthquakes occurring within a larger regional space. Chang Qing Li [Chang-Qing Li, 2018] used the LSTM model to predict the location and direction of fractures in granite fracture experiments conducted in the laboratory. Sehrish et al. believe that neural networks can express the mapping relationship between earthquake occurrence signs and probabilities. They use BAT-ANN networks to avoid the algorithm falling into local optima and missing out on global optima. Asmae Berhich et al. predicted the likelihood of earthquakes based on their time, location, and magnitude.
We believe that the aftershock period can be predicted on the premise that the earthquake has already occurred. Obviously, neural networks are currently the best tool available. In order to prevent overfitting of the model, we chose the convolutional model. In order to make the data more comprehensive, we selected 856 data from 2351 data of an earthquake. In order to make the data features more comprehensive, we selected 7 feature data from the seismic phase data block to form the input vector.
## II. RELATE WORKS
Helene et al. [Helene, 2018] conducted research on earthquake prediction. In the early days, seismologists believed that prediction was the logical goal of earthquake research. For most of the 20th century, optimism towards predicting earthquakes persisted. As bonuses flow into seismology, it drives predictive research towards conclusions. China seems to have successfully predicted earthquakes, which makes the development of earthquake prediction methods imminent. The goal of seismological research is to predict without any problems, but it should be carried out under the premise of rational and correct use of information and understanding of inherent difficulties. The public's response to earthquake prediction shows that $60 - 85\%$ of people believe that earthquakes can be predicted.
Asmae Berhich et al. [Berhich, 2020] divided the Chilean earthquake dataset into two types: large earthquakes and small earthquakes. They believe that there are four methods for predicting earthquakes, namely precursor signals, statistical algorithms, machine learning, and deep learning. They take latitude, longitude, depth, year, month, day, hour, minute, second, and magnitude as 10 characteristic parameters from the seismic dataset. Large earthquakes with magnitudes greater than 5.0 are considered major earthquakes, while earthquakes with magnitudes 0.2 to 5.0 are considered minor earthquakes. By constructing an LSTM network with 10 neurons, four prediction results are output: magnitude, latitude, longitude, and year. Normalize the input data to [0,1]. Take $80\%$ of the dataset for training and $20\%$ for testing. The experimental results were evaluated using MAE and MSE.
Saba Sehrish et al. [Sehrish, 2017] divided earthquake prediction into three categories. Mathematical statistics, artificial intelligence, and hybrid methods. Input time and seismic signals to the ANN network to predict earthquake magnitudes. The evaluation algorithms are MAE and MSE. They believe that different technologies can predict earthquakes. Continuous improvement can lead to more accurate results. Among all technologies, neural networks exhibit better possibilities. It can achieve complex mapping relationships between input and output. Adding the BAT algorithm to ANN can effectively avoid overfitting of the network.
Chang Qing Li et al. [Chang-Qing Li, 2018] conducted fracture tests on granite in the laboratory. Analyze using six parameters: dry density, statistical friction coefficient, Young coefficient, general force, loading rate, and shear force. Obtain digital images through a two-dimensional mapping scanner. Study the transmission characteristics of sound waves during granite fracture process. Explain the mechanism of earthquake occurrence.
Molchan et al. [Molchan, 2017] believe that there is no standard method for earthquake prediction and evaluation. It is necessary to carefully examine the theoretical analysis. One important point to emphasize is that algorithms based on early warning mechanisms are not trustworthy.
Cattania et al. [Cattania, 2019] proposed that the prediction of large earthquakes should be studied in a large spatiotemporal space. Relatively speaking, small earthquakes are caused by the slow rupture of isolated convex bodies while large earthquakes have already occurred. These fractures are periodically repeated and can be predicted. They conducted research on earthquake prediction from a temporal and spatial perspective.
Qianlong W et al. [Qianlong W, 2020] constructed a two-dimensional input LSTM to reveal the spatiotemporal relationship of historical earthquakes. Divide LSTM into small parts to reduce algorithm complexity. They noticed that most neural network algorithms use different feature inputs. Not fully considering the spatiotemporal relationship of earthquakes. In the time domain, there seems to be a reasonable pattern of seismic activity. In the spatial domain, adjacent geographical activities can trigger each other. RNN is not suitable for handling long-term time dependence. LSTM uses functions to store information, replacing memory units. The unit state is transmitted along the entire path, only undergoing some linear interaction in the middle, and the information can be well maintained to the output end. Compared with one-dimensional input, the algorithm verification accuracy has improved from $79.6\%$ to $87.8\%$.
Gitis et al. [Gitis, 2021] believe that a dense network of GPS receiving stations can monitor the movement of the Earth's surface. Can these measurement data be effectively used for system earthquake prediction. The paper studied data from
Japan and California. Propose the minimum alarm area method to analyze the daily time series of horizontal displacement on the Earth's surface. Clearly distinguish the spatial and temporal regions of the location before the epicenter of a strong earthquake. Reflecting abnormal changes in seismic structures and geodynamic processes can be predicted.
Rui L et al. [Rui L, 2020] divided earthquake sequences into multiple learning samples and precursor patterns. Based on these patterns and samples, eight dominant features are extracted, while implicit features are also extracted. Based on the attention mechanism, combine explicit and implicit features. A dynamic loss function was designed in the model optimization using a small batch gradient descent optimization method. Adapting to different training data and balancing different categories of algorithms by combining explicit and implicit features is an effective earthquake prediction method.
William et al. [William, 2019] wrote a collection of 20 papers. It is divided into seven parts, including historical earthquake phenomena, physical models, precursor earthquakes, surface geochemistry, seismic related atmosphere signals, ionospheric processes, and interdisciplinary earthquake prediction methods. Believing that earthquake warning can promote building standards. Build buildings and facilities that can withstand earthquakes. It can reduce the cost of future earthquakes and reduce the number of injuries and deaths.
Danijel et al. [Danijel, 2018] pointed out that CSEP is a global network infrastructure used for prospective evaluation of earthquake prediction models and algorithms. The global CSEP collaboration has been conducting predictive experiments in various tectonic environments worldwide. The experiment provides a large number of results, providing information for operable earthquake prediction systems and earthquake disaster models. New and surprising insights have been provided on the predictability of earthquakes.
Gualberto et al. [Gualberto, 2016] explored seismic indicators on the Chilean National Earthquake Service dataset. After fully adjusting these indicators, the accuracy of prediction can be improved. The results indicate that by adjusting the input appropriately, the predictive ability of the classifier is significantly exceeded. Optimize and develop adaptive systems that utilize all available information, discover new metrics to provide more information to the system.
Elshin Oleg et al. [Oleg, 2020] introduced Terra Seismic, which can predict most major earthquakes 2-5 months in advance. The geological pattern and pressure accumulation of earthquake development are usually the same. Terra Seismic currently provides earthquake prediction for 25 key earthquake prone areas. Successfully detected approximately $90\%$ of major earthquakes in the past 50 years.
The above literature shows that aftershocks can be predicted. Neural networks are the most suitable method to establish corresponding prediction models.
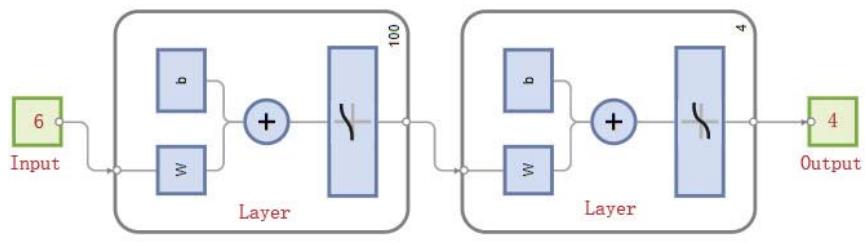 III. PROPOSED METHOD Figure 1: Network Structure
Using a forward propagation network, input the RxQ1 matrix. Q1 input vector containing R elements. The output is the SNxQ2 matrix. Q2 target vectors containing SN elements. Adopting a three-layer structure as figure 1. The hidden layer has 100 neurons, with an input layer width of 7 and an output width of 4. The transfer function takes the S-shaped transformation function Logig and the hyperbolic tangent S-shaped function transig, respectively. Try not to use linear functions. The gradient descent function adopts training dx, which is an adaptive learning rate training function. The weight of the input layer is determined by the input, and the hidden layer may come from the input layer. The weights of each layer are updated by the learning function. Training is performed by the training function. Performance is measured by a performance function.
 Figure 2: Training State
The learning rate is taken as 0.01. Display intermediate results every 50 rounds. The target error of neural network training is taken as 0.01. The maximum number of iterations is taken as 50000.
Training State is as figure 2.
## IV. EXPERIMENT AND RESULTS
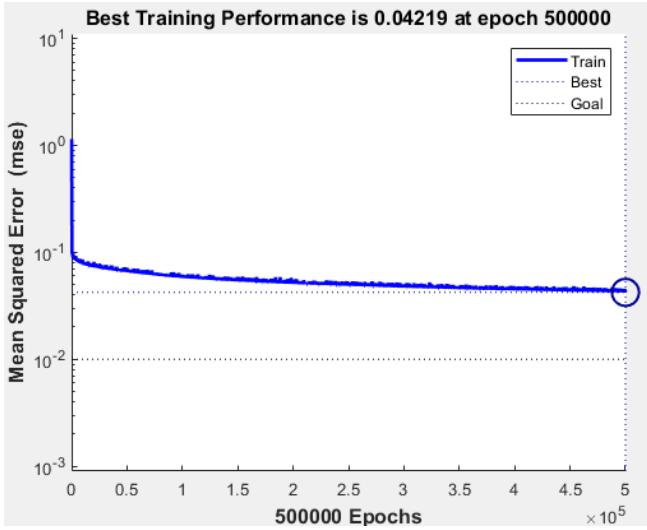
The data is from China Earthquake Networks Center and National Seismological Science Data Center (http://data-earthquake.cn). We selected the seismic phase data block DPB from the Qinghai Maduo 7.9 magnitude earthquake phase dataset on May 22, 2021 at 02:04. Original data shows in figure4.There are 1351 recorders. Training performance shows as figure 3.
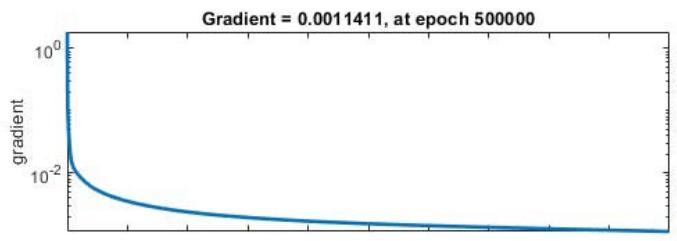
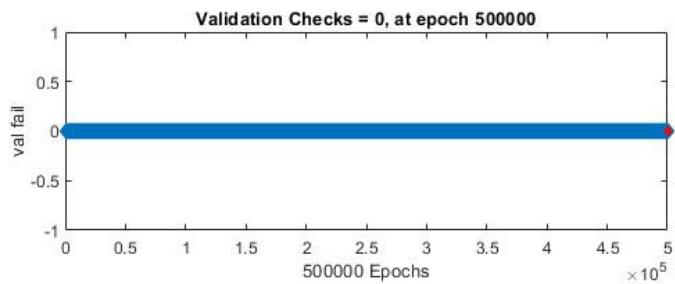 Figure 4. Original Data
Figure 3: Training Performance
Original data format:
<table><tr><td></td><td>A</td><td>B</td><td>C</td><td>D</td><td>E</td><td>F</td><td>G</td></tr><tr><td>1</td><td>02:05:46.10</td><td>2.4</td><td>6.1</td><td>341</td><td>3837</td><td>11.2</td><td>7.4</td></tr><tr><td>2</td><td>02:05:46.10</td><td>2.4</td><td>6.1</td><td>341</td><td>3837</td><td>11.2</td><td>7.4</td></tr><tr><td>3</td><td>02:05:46.10</td><td>2.4</td><td>6.1</td><td>341</td><td>2971</td><td>13.5</td><td></td></tr><tr><td>4</td><td>02:05:46.10</td><td>2.4</td><td>6.1</td><td>341</td><td>2504</td><td>7.2</td><td>7.4</td></tr><tr><td>5</td><td>02:05:46.10</td><td>2.4</td><td>6.1</td><td>341</td><td>25</td><td>1.4</td><td></td></tr><tr><td>6</td><td>02:05:46.10</td><td>2.4</td><td>6.1</td><td>341</td><td>22.3</td><td>1.6</td><td>6.4</td></tr><tr><td>7</td><td>02:07:30.00</td><td>4.3</td><td>6.1</td><td>341</td><td>22.3</td><td>1.6</td><td></td></tr><tr><td>8</td><td>02:06:06.00</td><td>4.3</td><td>6.1</td><td>341</td><td>22.3</td><td>1.6</td><td></td></tr><tr><td>9</td><td>02:06:06.00</td><td>4.3</td><td>15.1</td><td>56</td><td>8641</td><td>20.9</td><td>8</td></tr><tr><td>10</td><td>02:06:06.00</td><td>4.3</td><td>15.1</td><td>56</td><td>4891</td><td>19.6</td><td></td></tr><tr><td>11</td><td>02:06:06.00</td><td>4.3</td><td>15.1</td><td>56</td><td>3048</td><td>19.1</td><td>7.9</td></tr><tr><td>12</td><td>02:10:57.80</td><td>4.7</td><td>15.1</td><td>56</td><td>3048</td><td>19.1</td><td></td></tr><tr><td>13</td><td>02:10:46.40</td><td>0.6</td><td>15.1</td><td>56</td><td>3048</td><td>19.1</td><td></td></tr><tr><td>14</td><td>02:10:39.30</td><td>3.5</td><td>15.1</td><td>56</td><td>3048</td><td>19.1</td><td></td></tr><tr><td>15</td><td>02:07:53.60</td><td>-0.5</td><td>15.1</td><td>56</td><td>3048</td><td>19.1</td><td></td></tr><tr><td>16</td><td>02:07:46.60</td><td>-1.9</td><td>15.1</td><td>56</td><td>3048</td><td>19.1</td><td></td></tr><tr><td>17</td><td>02:07:46.60</td><td>-1.9</td><td>16.4</td><td>294</td><td>4294</td><td>17.1</td><td>7.8</td></tr><tr><td>18</td><td>02:07:46.60</td><td>-1.9</td><td>16.4</td><td>294</td><td>3972</td><td>15.8</td><td></td></tr><tr><td>19</td><td>02:07:46.60</td><td>-1.9</td><td>16.4</td><td>294</td><td>1781</td><td>17.1</td><td>7.9</td></tr><tr><td>20</td><td>02:11:11.50</td><td>5.2</td><td>16.4</td><td>294</td><td>1781</td><td>17.1</td><td></td></tr></table>
Seismic phase refers to seismic wave groups with different properties or propagation paths displayed on seismic maps. Various seismic phases have different characteristics. Specifically, in terms of arrival time, waveform, amplitude, period, and particle motion mode. The seismic phase characteristics are related to the source, propagation medium, and receiving instrument. These wave groups all have a certain duration. The waveforms of different seismic phases overlap with each other, causing interference, resulting in a complex pattern in the seismic map. One of the tasks of seismology is to analyze and explain the causes and physical meanings of various seismic phases. Using various seismic phase characteristics to determine the basic parameters of earthquakes, studying the mechanical properties of seismic sources, and exploring the internal structure of the Earth.
Filter the raw data. Select 7 features. They are: Phase when the seismic phase arrives_Time, travel time residual Resi, epicenter distance, station azimuth Azi, amplitude Amp, magnitude Mag\_ Val and Period. Due to the fact that the dates are on the same day, only hours, minutes, and seconds are taken. For ease of operation, subtract the initial time from the time and take the offset as the time characteristic value. Figure 5 shows the organized data. Removed data without magnitude from the data, leaving 856 valid data. Divided into four categories based on duration. Category 4 for more than 20 seconds. Category 3 ranges from 10 seconds to 20 seconds. Category 2 ranges from 5 seconds to 10 seconds. Category 1 is defined as below 5 seconds. Organized data format:
<table><tr><td>1</td><td>Phase_time</td><td>Resi</td><td>Distance</td><td>Azi</td><td>Amp</td><td>Mag_val</td><td>Period_val</td><td>Period</td></tr><tr><td>2</td><td>186.16</td><td>2.4</td><td>6.1</td><td>341</td><td>3837</td><td>7.4</td><td>3</td><td>11.2</td></tr><tr><td>3</td><td>186.16</td><td>2.4</td><td>6.1</td><td>341</td><td>3837</td><td>7.4</td><td>3</td><td>11.2</td></tr><tr><td>4</td><td>186.16</td><td>2.4</td><td>6.1</td><td>341</td><td>2504</td><td>7.4</td><td>2</td><td>7.2</td></tr><tr><td>5</td><td>186.16</td><td>2.4</td><td>6.1</td><td>341</td><td>22.3</td><td>6.4</td><td>1</td><td>1.6</td></tr><tr><td>6</td><td>246.06</td><td>4.3</td><td>15.1</td><td>56</td><td>8641</td><td>8</td><td>4</td><td>20.9</td></tr><tr><td>7</td><td>246.06</td><td>4.3</td><td>15.1</td><td>56</td><td>3048</td><td>7.9</td><td>3</td><td>19.1</td></tr><tr><td>8</td><td>386.66</td><td>-1.9</td><td>16.4</td><td>294</td><td>4294</td><td>7.8</td><td>3</td><td>17.1</td></tr><tr><td>9</td><td>386.66</td><td>-1.9</td><td>16.4</td><td>294</td><td>1781</td><td>7.9</td><td>3</td><td>17.1</td></tr><tr><td>10</td><td>751.56</td><td>5.2</td><td>16.4</td><td>294</td><td>70</td><td>7.3</td><td>2</td><td>5.4</td></tr><tr><td>11</td><td>751.56</td><td>5.2</td><td>16.4</td><td>294</td><td>6.3</td><td>6.9</td><td>1</td><td>1.2</td></tr><tr><td>12</td><td>442.56</td><td>-2.8</td><td>15.2</td><td>64</td><td>82</td><td>6</td><td>4</td><td>20.1</td></tr><tr><td>13</td><td>442.56</td><td>-2.8</td><td>15.2</td><td>64</td><td>728</td><td>7.2</td><td>3</td><td>14</td></tr><tr><td>14</td><td>393.46</td><td>-4.7</td><td>15.2</td><td>64</td><td>26.9</td><td>6.6</td><td>2</td><td>9</td></tr><tr><td>15</td><td>393.46</td><td>-4.7</td><td>15.2</td><td>64</td><td>0.2</td><td>5.3</td><td>1</td><td>1.7</td></tr><tr><td>16</td><td>386.36</td><td>-2.3</td><td>10.1</td><td>338</td><td>4333</td><td>7.6</td><td>3</td><td>13.5</td></tr><tr><td>17</td><td>386.36</td><td>-2.3</td><td>10.1</td><td>338</td><td>2823</td><td>7.9</td><td>3</td><td>14.7</td></tr><tr><td>18</td><td>386.36</td><td>-2.3</td><td>10.1</td><td>338</td><td>53.6</td><td>7</td><td>3</td><td>11.5</td></tr><tr><td>19</td><td>386.36</td><td>-2.3</td><td>10.1</td><td>338</td><td>0.6</td><td>6.2</td><td>1</td><td>0.9</td></tr><tr><td>20</td><td>278.46</td><td>-2.4</td><td>24.7</td><td>54</td><td>2558</td><td>7.9</td><td>3</td><td>14.2</td></tr></table>
Figure 5: Computed Data
We divided the dataset into two subsets. $80\%$ of the dataset is a training subset, and $20\%$ is a testing subset. Input data format:
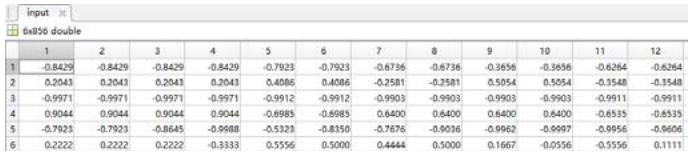 Figure 6: Input Data
Train the data using BP network and CNN network respectively. Predict the duration of aftershocks from input. Figure 7 shows the input vectors.
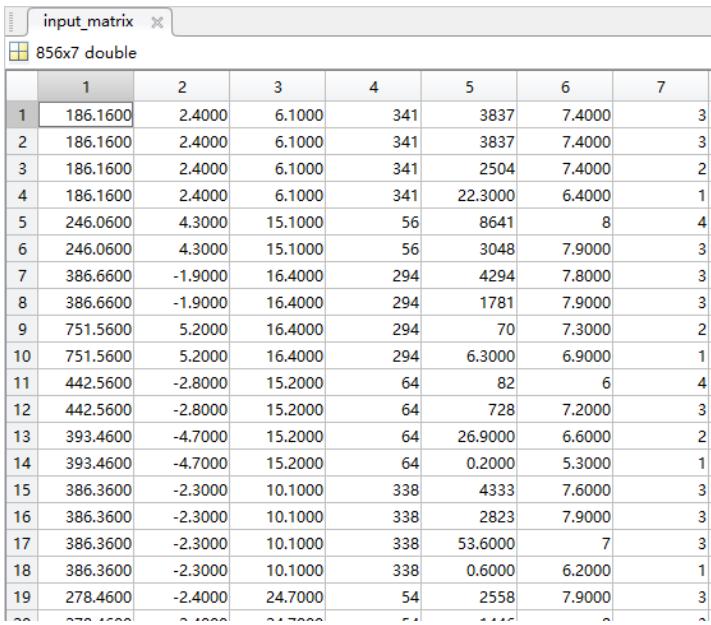 Figure 7: Input Vector
Figure 8 shows output result data.
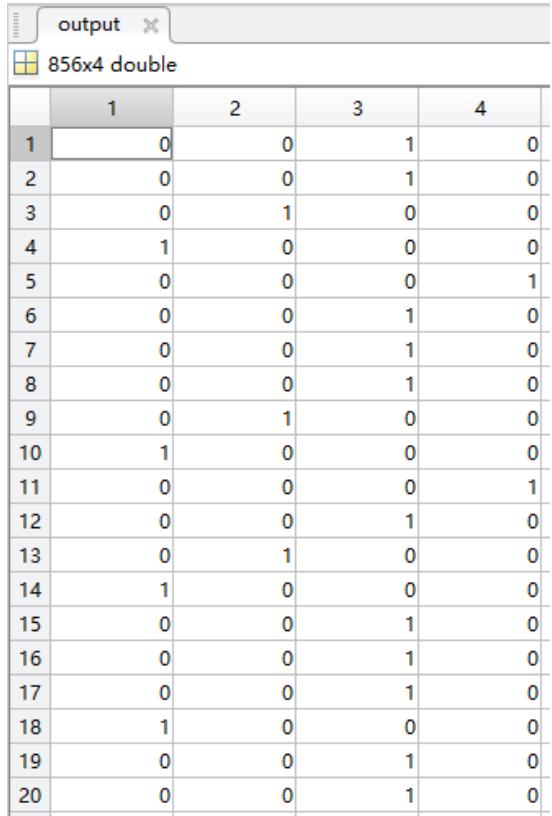 Figure 8: Output of the Neural Network Model
After training, we test the model with new dataset. Figure 9 shows the test results.
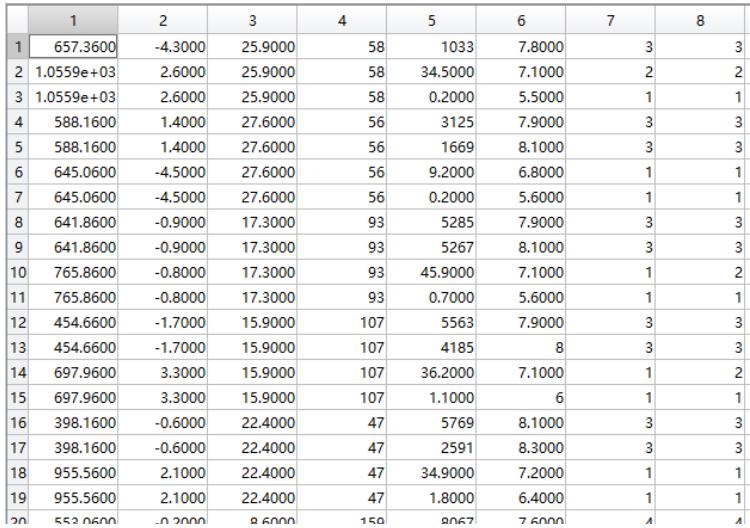 Figure 9: Test Result
## V. EVALUATION
From the rendering, it can be seen that the built-in trainingdx training function has a large output value of the entire model, resulting in significant errors that make the model unusable. In addition to output constraints and setting an output upper limit, the training is good and the approximation effect is good. This indicates that the improved constrained training dx training function can handle similar situations where the model output value is too large or too small, resulting in better results.
Mean square error (MSE) is a measure that reflects the degree of difference between the estimator and the estimated quantity. Let $t$ be the overall parameter determined based on the sample $\theta$. An estimator of $(\theta - t)$ is mathematical expectation of 2. It is called the mean square error of the estimator $t$. It is equal to $\sigma^2 + b^2$, where $\sigma^2$ and $b$ are the variance and bias of $t$.
Consistent estimation (or consensus estimation) is the standard for evaluating estimators in large samples. When the sample size is not large, people tend to use small sample based evaluation criteria. In this case, variance is used for unbiased estimation and mean square error is used for biased estimation.
Generally, when the sample size is fixed, the criterion used to evaluate the quality of a point estimation is always a function of the distance between the point estimation and the true value of the parameter. The most commonly used function is the square of the distance. Due to the randomness of the estimation, the expectation of this function can be obtained, which is the mean square error given by the following equation:
## VI. CONCLUSIONS
Predicting the duration of aftershocks is feasible on the premise that an earthquake has already occurred. In different regions, aftershock warning mechanisms can be established based on the geological conditions of the region. Expanding to larger regions and for a longer period of time, based on existing earthquakes, predicting future earthquakes should also be feasible. This is the direction that this article strives to explore.
Earthquake prediction is not the goal. The goal of this study is to provide data support for earthquake relief. In the event of an earthquake, minimize personnel and property damage as much as possible.
In future research, we will delve deeper into the use of deep learning algorithms and construct new aftershock prediction models using typical residual models. Fully utilize all parameters in seismic phase data to make detailed predictions of aftershocks.
Generating HTML Viewer...
References
13 Cites in Article
W Qianlong,G Yifan,Y Lixing,L Pan (2020). Earthquake Prediction based on Spatio-Temporal Data Mining: An LSTM Network Approach.
C Cattania,P Segall (2019). Crack Models of Repeating Earthquakes Predict Observed Moment‐Recurrence Scaling.
Valeri Gitis,Alexander Derendyaev,Konstantin Petrov (2021). Analyzing the Performance of GPS Data for Earthquake Prediction.
Chang-Qing Li,Xiao-Ping Zhou (2021). Laboratory Earthquake Prediction Of Granite.
J Helene,R Tiziana,Caroline Cliodhna,O (2018). Stigma In Science: The Case Of Earthquake Prediction.
L Rui,L Xiaobo,L Shuowei,Y Haipeng,Q Jianfeng,Z Lei (2020). Dlep: A Deep Learning Model For Earthquake Prediction.
William Prescott (2019). Pre-earthquake processes: a multidisciplinary approach to earthquake prediction studies.
S Danijel,M Warner,M Thomas,H J Yosihiko,O David,D J Sum,M David,A R Matthew,C G Naoshi,H Maria,L Philip,J M,Anne,Matteo,Stefan Jeremy,D Z Jiancang,Z (2018). The Collaboratory for the Study of Earthquake Predictability: Achievements and Priorities.
Saba Sehrish,Faraz Ahsan,Sajjadmohsin (2017). BAT-ANN based earthquake prediction for Pakistan region.
A Gualberto,M Francisco,A,Jorge (2016). A sensitivity study of seismicity indicators in supervised learning to improve earthquake prediction.
Elshin Oleg,Tronin Andrew,A (2020). Global Earthquake Prediction Systems.
G Molchan,L Romashkova,A Peresan (2017). On some methods for assessing earthquake predictions.
Asmae Berhich,Fatima-Zahra Belouadha,Mohammed Kabbaj (2020). LSTM-based Models for Earthquake Prediction.
Explore published articles in an immersive Augmented Reality environment. Our platform converts research papers into interactive 3D books, allowing readers to view and interact with content using AR and VR compatible devices.
Your published article is automatically converted into a realistic 3D book. Flip through pages and read research papers in a more engaging and interactive format.
Earthquake prediction is a difficult task. Constrained within a certain spatiotemporal range, earthquakes are only a probability event. In a large area, predicting earthquakes based on geographical events that have already occurred is reliable. Predicting the duration of aftershocks under the condition that a major earthquake has already occurred is the research content of this article. Extract 6 features from seismic phase data to predict the aftershock period. We constructed a convolutional neural network model, sorted out 855 data from 1351 data, and trained the network. The accuracy of training verification reaches 90%, and the accuracy of testing reaches 100%. After further refinement, this model can be used to predict the duration of aftershocks in earthquakes. Provide data guidance for earthquake rescue.
Our website is actively being updated, and changes may occur frequently. Please clear your browser cache if needed. For feedback or error reporting, please email [email protected]
Thank you for connecting with us. We will respond to you shortly.